| Param | Original file | Final file |
|---|---|---|
| Filename | modeM0/AS1A14_002T07_9000006498cztM0_level2.fits | modeM0/AS1A14_002T07_9000006498cztM0_level2_quad_clean.evt |
| Size (bytes) | 1,087,557,120 | 362,802,240 |
| Size | 1.0 GB | 346.0 MB |
| Events in quadrant A | 5,992,200 | 309,481 |
| Events in quadrant B | 6,526,060 | 409,959 |
| Events in quadrant C | 4,262,014 | 128,007 |
| Events in quadrant D | 6,293,576 | 344,279 |
| Mode SS | |||
|---|---|---|---|
| Quadrant | BADHDUFLAG | Total packets | Discarded packets |
| A | 0 | 2895 | 0 |
| B | 0 | 2896 | 0 |
| C | 0 | 2896 | 0 |
| D | 0 | 2894 | 0 |
| Mode M9 | |||
|---|---|---|---|
| Quadrant | BADHDUFLAG | Total packets | Discarded packets |
| A | 0 | 173 | 0 |
| B | 0 | 174 | 0 |
| C | 0 | 174 | 0 |
| D | 0 | 174 | 0 |
| Mode M0 | |||
|---|---|---|---|
| Quadrant | BADHDUFLAG | Total packets | Discarded packets |
| A | 0 | 760581 | 0 |
| B | 0 | 469025 | 0 |
| C | 0 | 923467 | 0 |
| D | 0 | 341960 | 0 |
| Quadrant | Total seconds | Saturated seconds | Saturation percentage |
|---|---|---|---|
| A | 142744 | 53428 | 37.429244% |
| B | 142810 | 21146 | 14.807086% |
| C | 142772 | 86181 | 60.362676% |
| D | 142816 | 3698 | 2.589346% |
Noise dominated data is calculated using 1-second bins in cleaned event files. If a bin has >2000 counts, and if more than 50% of those come from <1% of pixels, then it is considered to be noise-dominated and hence unusable.
| Quadrant | # 1 sec bins | Bins with >0 counts | Bins with >2000 counts | High rate bins dominated by noise | Noise dominated (total time) | Noise dominated (detector-on time) | Marked lightcurve |
|---|---|---|---|---|---|---|---|
| A | 165606 | 142086 | 0 | 0 | 0.00% | 0.00% | 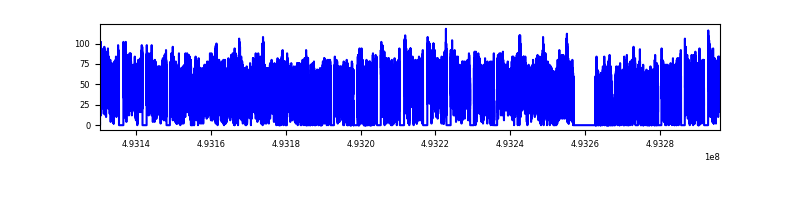 |
| B | 165606 | 142467 | 0 | 0 | 0.00% | 0.00% | 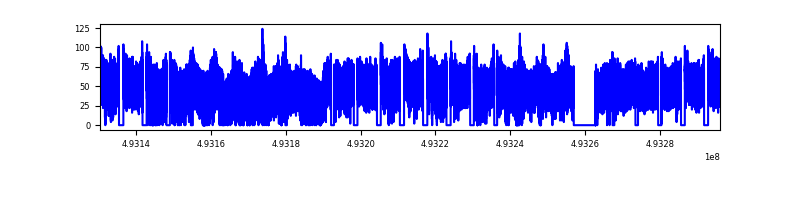 |
| C | 165606 | 139581 | 0 | 0 | 0.00% | 0.00% | 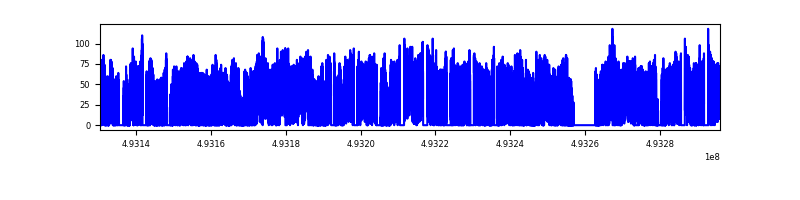 |
| D | 165606 | 142762 | 0 | 0 | 0.00% | 0.00% | 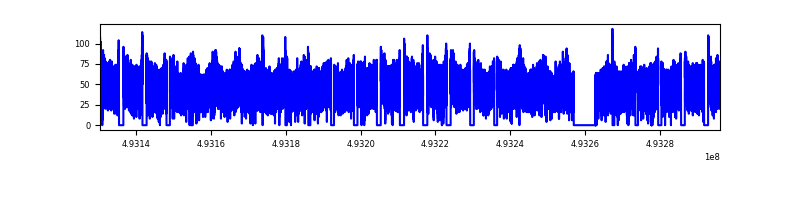 |
Top three noisy pixels from each quadrant. If the there are fewer than three noisy pixels in the level2.evt file, extra rows are filled as -1
| Pixel properties | Quadrant properties | ||||||
|---|---|---|---|---|---|---|---|
| Quadrant | DetID | PixID | Counts | Sigma | Mean | Median | Sigma |
| A | 14 | 188 | 6669 | 9.98 | 1571 | 1450 | 522.8 |
| A | 9 | 255 | 6232 | 9.15 | 1571 | 1450 | 522.8 |
| A | 14 | 204 | 5209 | 7.19 | 1571 | 1450 | 522.8 |
| B | 2 | 9 | 7453 | 14.37 | 1727 | 1634 | 404.8 |
| B | 2 | 8 | 6695 | 12.5 | 1727 | 1634 | 404.8 |
| B | 3 | 25 | 5415 | 9.34 | 1727 | 1634 | 404.8 |
| C | 15 | 175 | 3576 | 6.48 | 1139 | 1034 | 392.3 |
| C | 2 | 31 | 3290 | 5.75 | 1139 | 1034 | 392.3 |
| C | 12 | 241 | 3284 | 5.74 | 1139 | 1034 | 392.3 |
| D | 6 | 218 | 7678 | 10.12 | 1793 | 1593 | 601.6 |
| D | 15 | 11 | 5836 | 7.05 | 1793 | 1593 | 601.6 |
| D | 3 | 30 | 5739 | 6.89 | 1793 | 1593 | 601.6 |
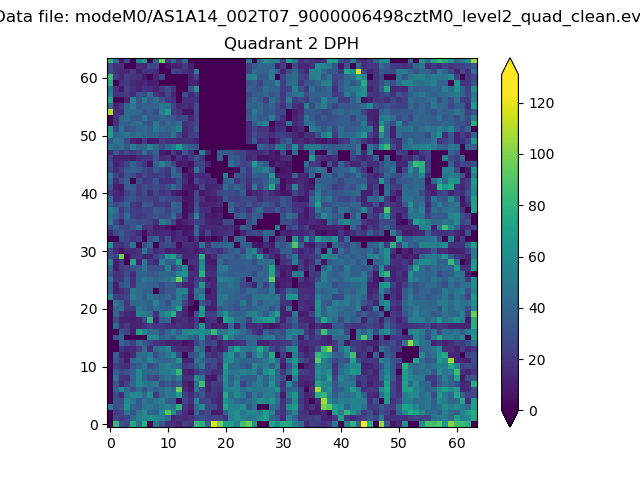
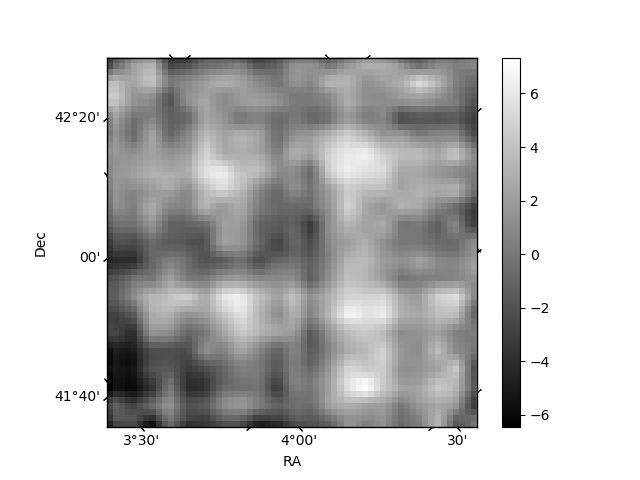
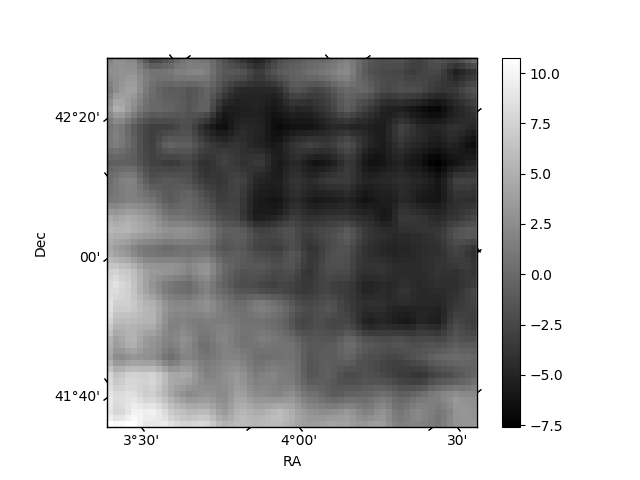
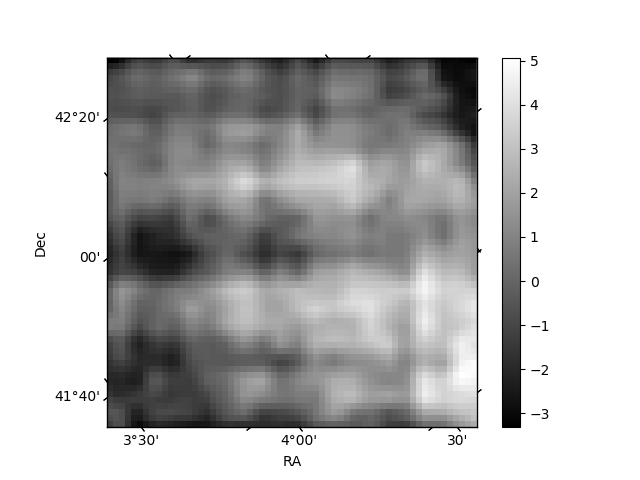
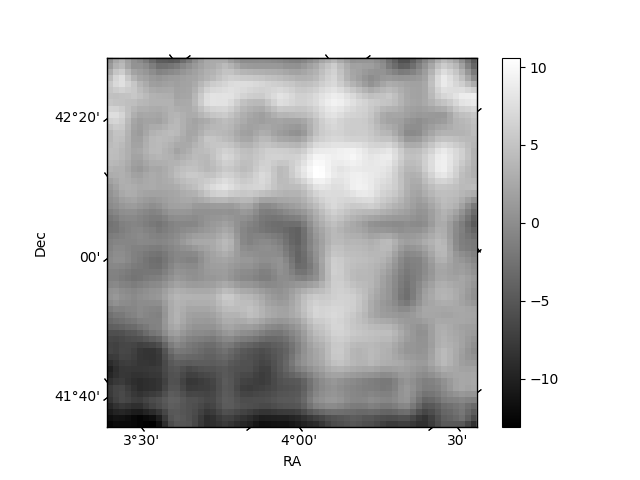
Histogram calculated using DETX and DETY for each event in the final _common_clean file
| Quadrant A | 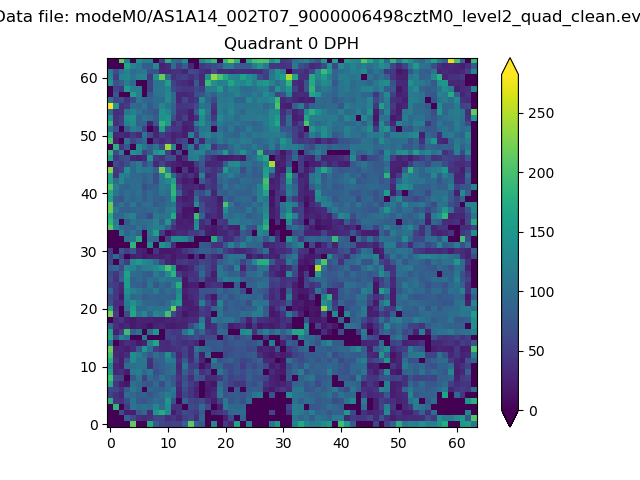 |
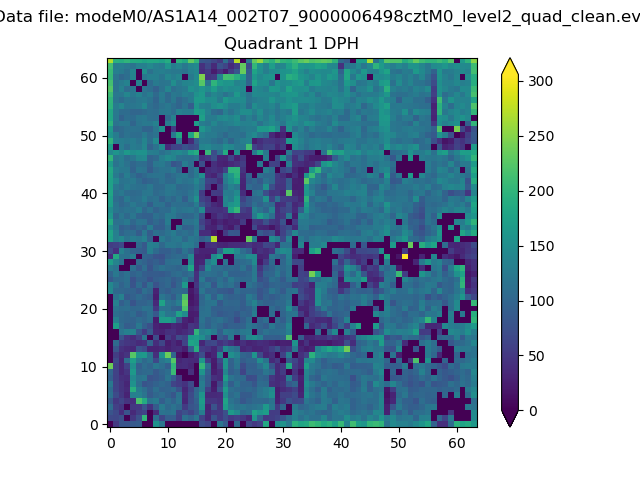 |
Quadrant B |
|---|---|---|---|
| Quadrant D | 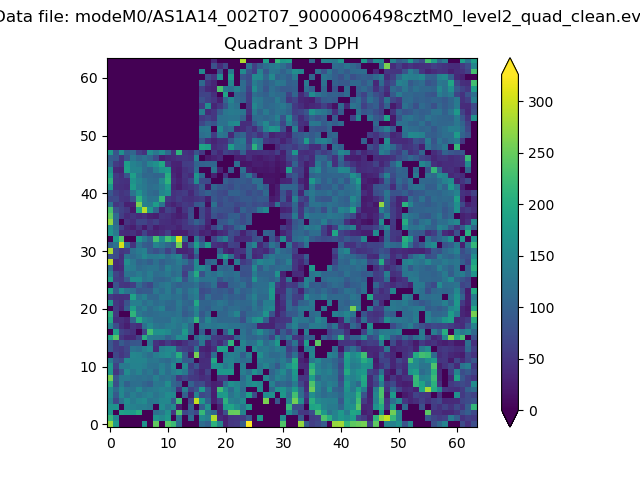 |
 |
Quadrant C |
| Plot type | Count rate plots | Images |
|---|---|---|
| Comparison with Poisson distribution Blue bars denote a histogram of data divided into 1 sec bins. Red curve is a Poisson curve with rate = median count rate of data. |
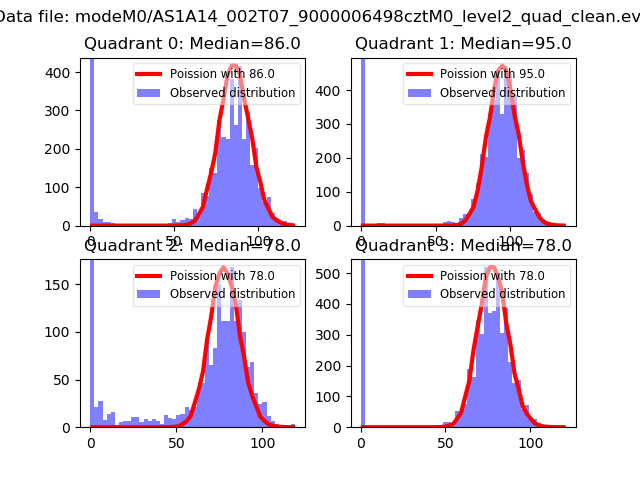 |
 |
| Quadrant-wise count rates Data is divided into 100 sec bins |
 |
|
| Module-wise count rates for Quadrant A Data is divided into 100 sec bins |
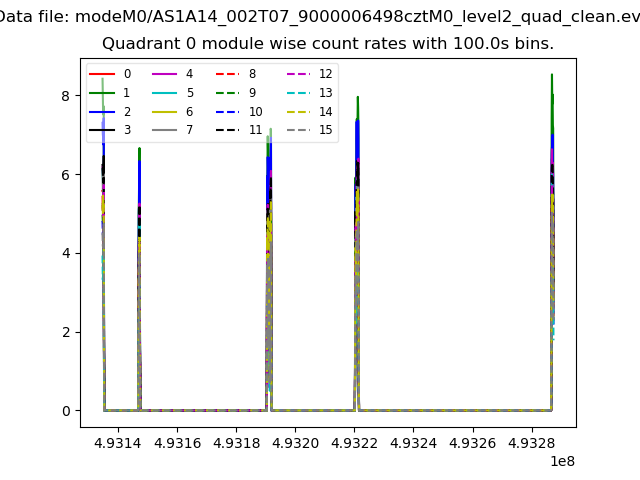 |
 |
| Module-wise count rates for Quadrant B Data is divided into 100 sec bins |
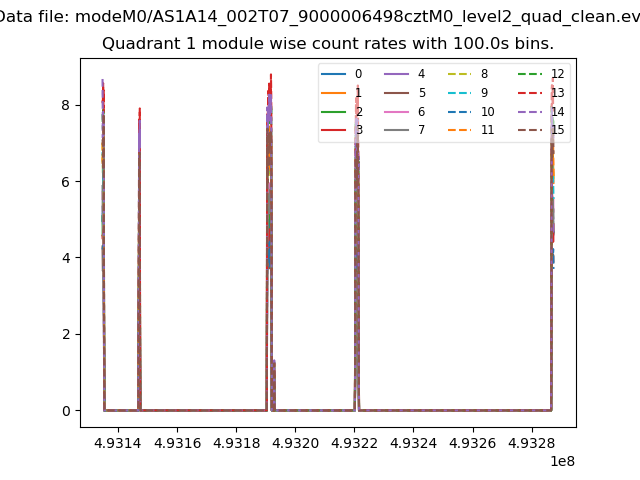 |
 |
| Module-wise count rates for Quadrant C Data is divided into 100 sec bins |
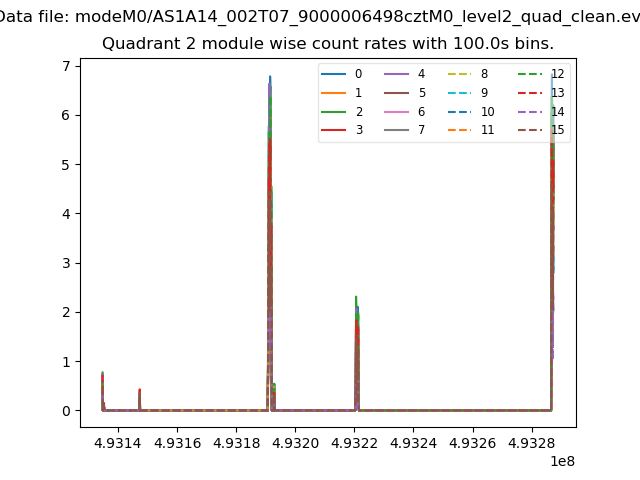 |
 |
| Module-wise count rates for Quadrant D Data is divided into 100 sec bins |
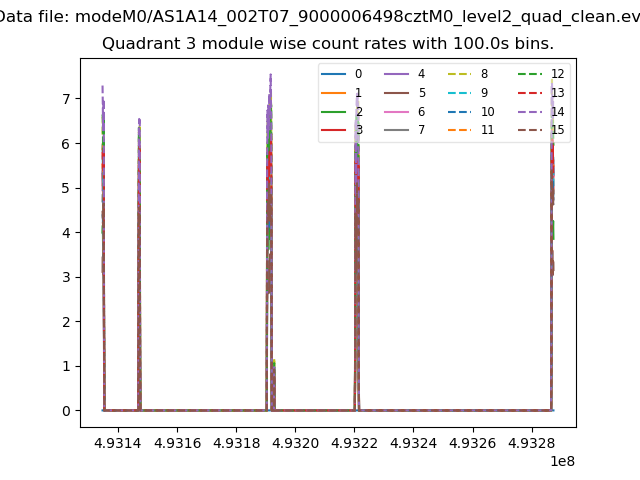 |
 |
| Parameter | Plot |
|---|---|
| CZT HV Monitor | 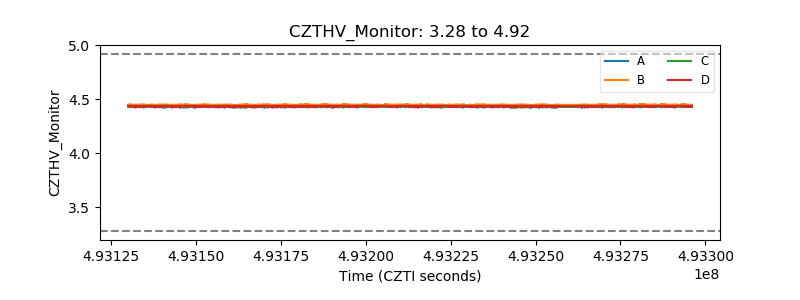 |
| D_VDD | 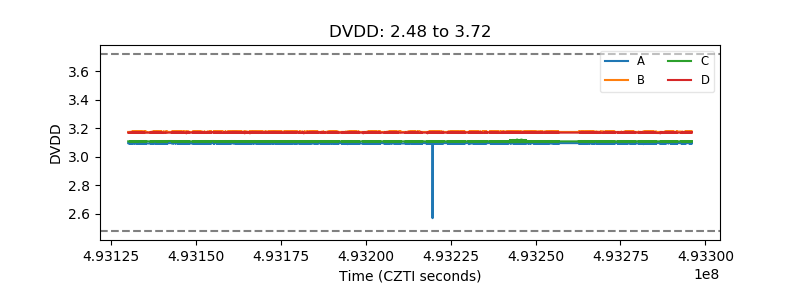 |
| Temperature 1 | 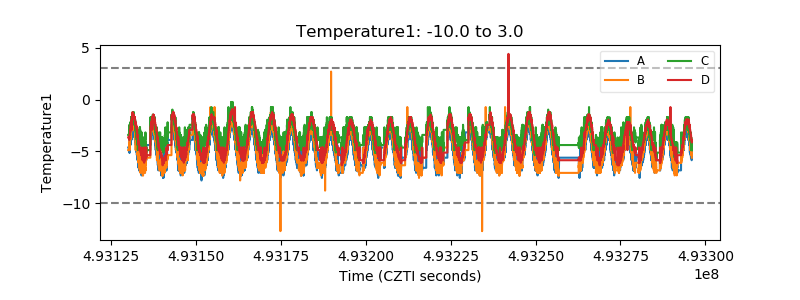 |
| Veto HV Monitor | 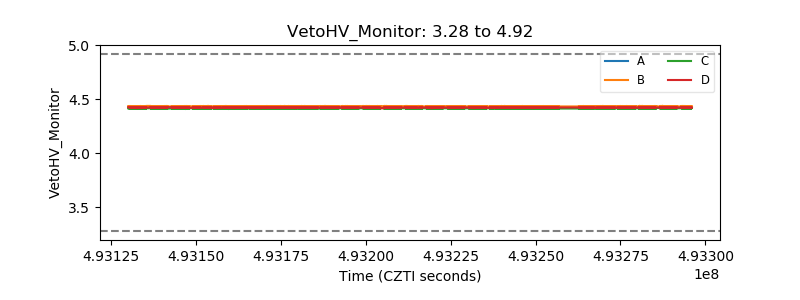 |
| Veto LLD | 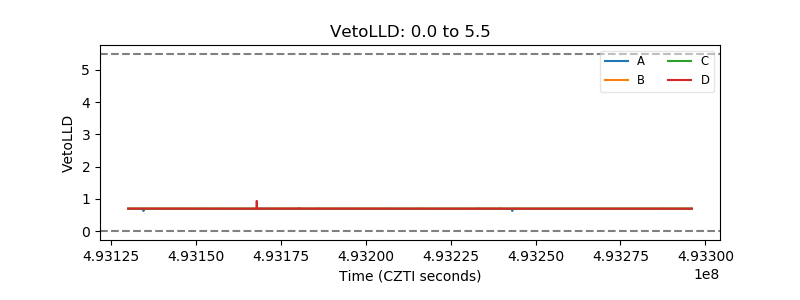 |
| Alpha Counter | 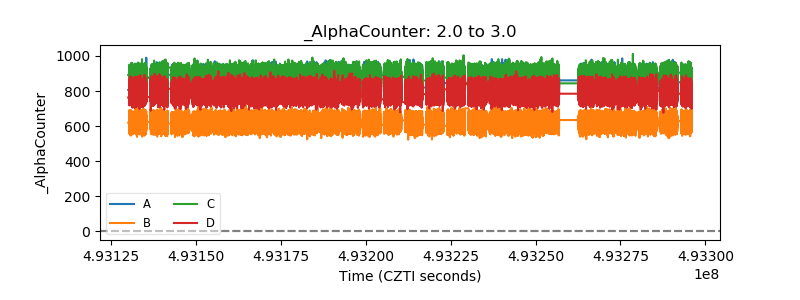 |
| _CPM_Rate | 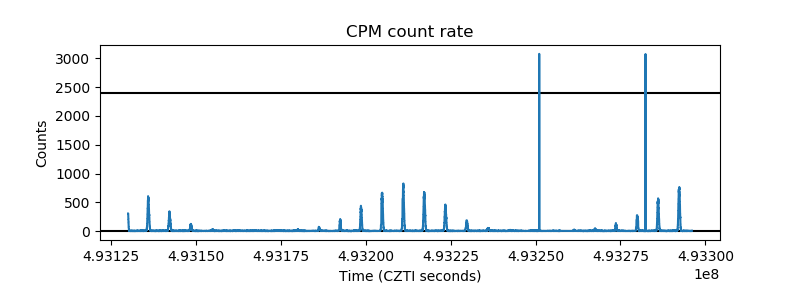 |
| CZT Counter | 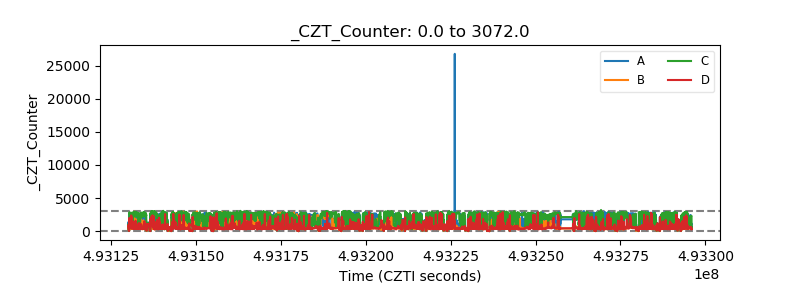 |
| +2.5 Volts monitor | 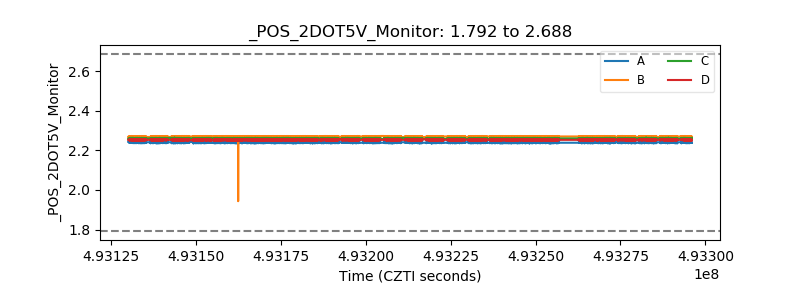 |
| +5 Volts monitor | 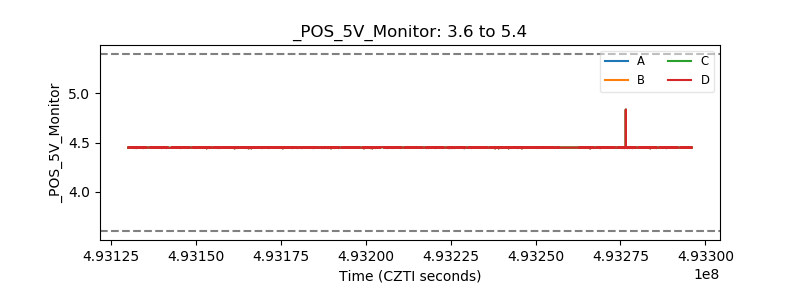 |
| _ROLL_ROT | 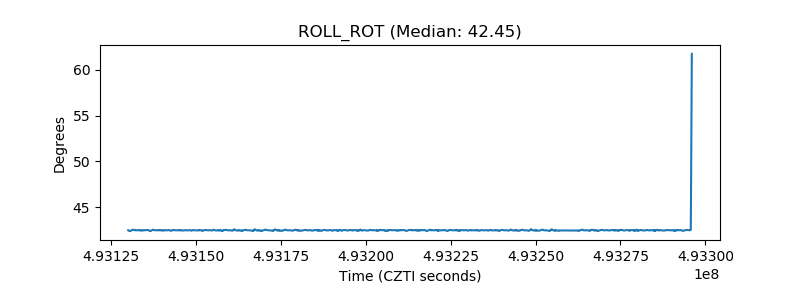 |
| _Roll_DEC | 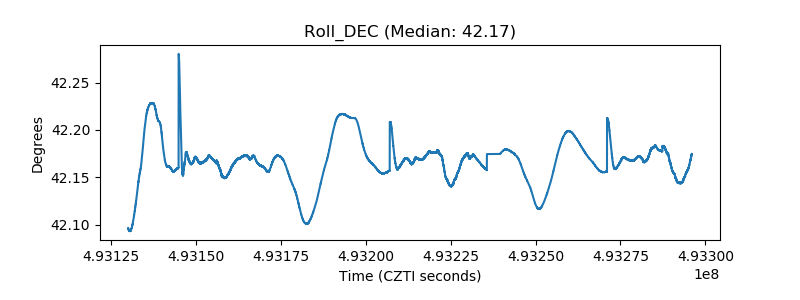 |
| _Roll_RA | 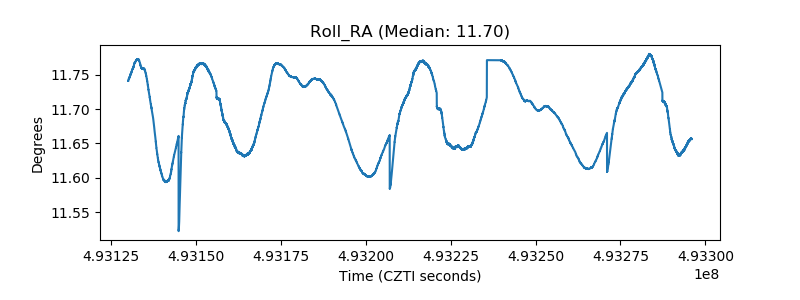 |
| Veto Counter | 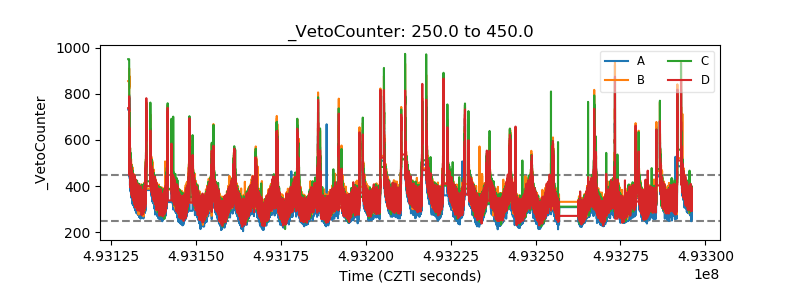 |