| Param | Original file | Final file |
|---|---|---|
| Filename | modeM0/AS1A14_002T07_9000006498_53485cztM0_level2.fits | modeM0/AS1A14_002T07_9000006498_53485cztM0_level2_quad_clean.evt |
| Size (bytes) | 875,710,080 | 83,848,320 |
| Size | 835.1 MB | 80.0 MB |
| Events in quadrant A | 6,623,536 | 659,891 |
| Events in quadrant B | 4,426,250 | 740,866 |
| Events in quadrant C | 16,375,042 | 67,229 |
| Events in quadrant D | 4,479,632 | 610,478 |
| Mode SS | |||
|---|---|---|---|
| Quadrant | BADHDUFLAG | Total packets | Discarded packets |
| A | 0 | 134 | 0 |
| B | 0 | 134 | 0 |
| C | 0 | 134 | 0 |
| D | 0 | 134 | 0 |
| Mode M9 | |||
|---|---|---|---|
| Quadrant | BADHDUFLAG | Total packets | Discarded packets |
| A | 0 | 14 | 0 |
| B | 0 | 15 | 0 |
| C | 0 | 15 | 0 |
| D | 0 | 15 | 0 |
| Mode M0 | |||
|---|---|---|---|
| Quadrant | BADHDUFLAG | Total packets | Discarded packets |
| A | 0 | 24339 | 2 |
| B | 0 | 17409 | 2 |
| C | 0 | 53276 | 2 |
| D | 0 | 17880 | 2 |
| Quadrant | Total seconds | Saturated seconds | Saturation percentage |
|---|---|---|---|
| A | 6601 | 724 | 10.968035% |
| B | 6601 | 329 | 4.984093% |
| C | 6600 | 6021 | 91.227273% |
| D | 6600 | 247 | 3.742424% |
Noise dominated data is calculated using 1-second bins in cleaned event files. If a bin has >2000 counts, and if more than 50% of those come from <1% of pixels, then it is considered to be noise-dominated and hence unusable.
| Quadrant | # 1 sec bins | Bins with >0 counts | Bins with >2000 counts | High rate bins dominated by noise | Noise dominated (total time) | Noise dominated (detector-on time) | Marked lightcurve |
|---|---|---|---|---|---|---|---|
| A | 7786 | 6601 | 522 | 522 | 6.70% | 7.91% | 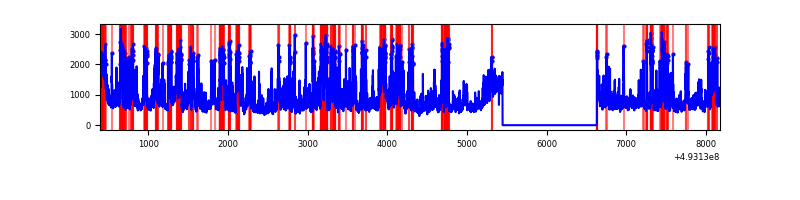 |
| B | 7786 | 6601 | 179 | 179 | 2.30% | 2.71% | 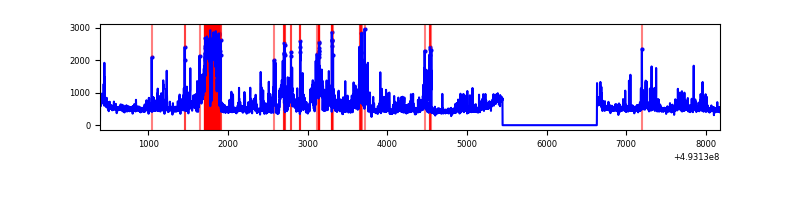 |
| C | 7784 | 6599 | 5983 | 5983 | 76.86% | 90.67% | 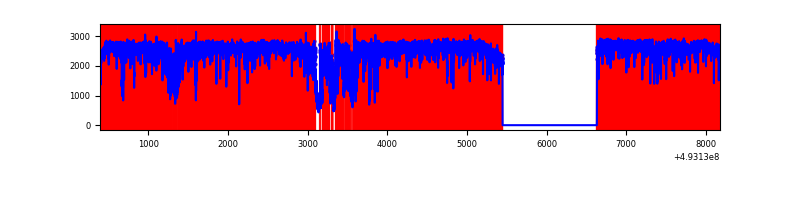 |
| D | 7785 | 6600 | 157 | 157 | 2.02% | 2.38% | 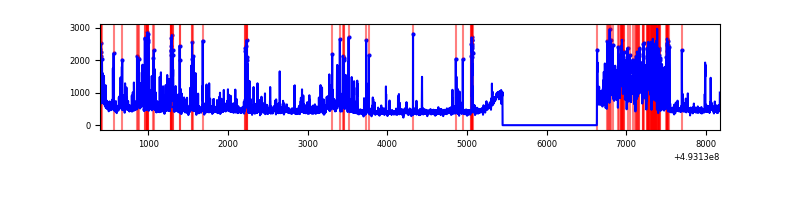 |
Top three noisy pixels from each quadrant. If the there are fewer than three noisy pixels in the level2.evt file, extra rows are filled as -1
| Pixel properties | Quadrant properties | ||||||
|---|---|---|---|---|---|---|---|
| Quadrant | DetID | PixID | Counts | Sigma | Mean | Median | Sigma |
| A | 3 | 63 | 2020895 | 11009.42 | 752 | 733 | 183.5 |
| A | 15 | 174 | 666145 | 3626.34 | 752 | 733 | 183.5 |
| A | 3 | 62 | 569554 | 3099.94 | 752 | 733 | 183.5 |
| B | 0 | 213 | 437101 | 2704.51 | 761 | 737 | 161.3 |
| B | 2 | 249 | 401354 | 2482.96 | 761 | 737 | 161.3 |
| B | 15 | 20 | 148942 | 918.55 | 761 | 737 | 161.3 |
| C | 7 | 64 | 13050946 | 157880.4 | 297 | 294 | 82.7 |
| C | 15 | 224 | 1091333 | 13198.86 | 297 | 294 | 82.7 |
| C | 1 | 241 | 485782 | 5873.2 | 297 | 294 | 82.7 |
| D | 11 | 245 | 752666 | 3564.39 | 749 | 715 | 211.0 |
| D | 12 | 35 | 200639 | 947.68 | 749 | 715 | 211.0 |
| D | 2 | 249 | 147715 | 696.81 | 749 | 715 | 211.0 |
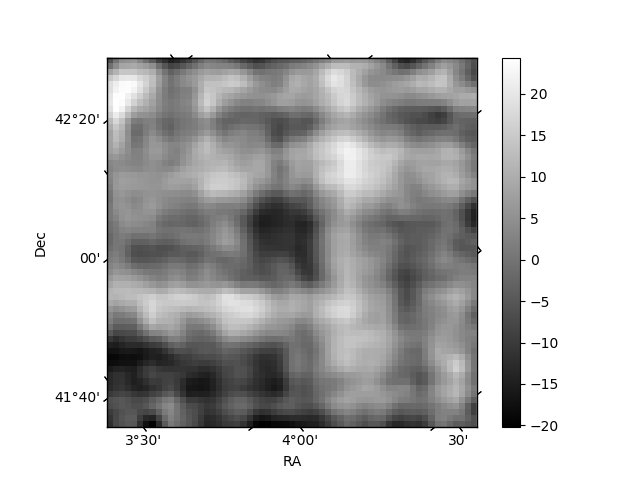
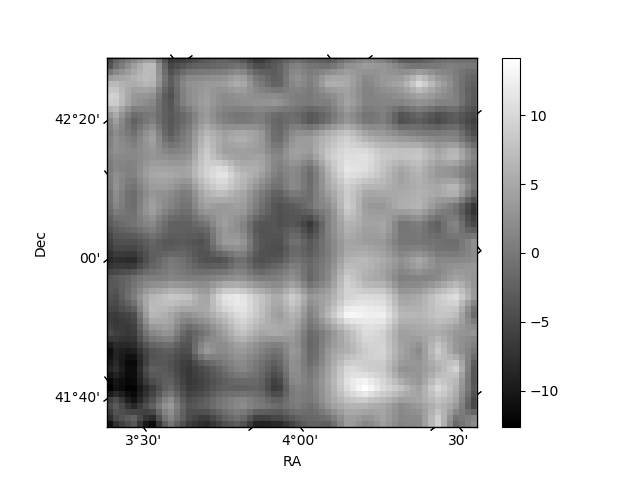
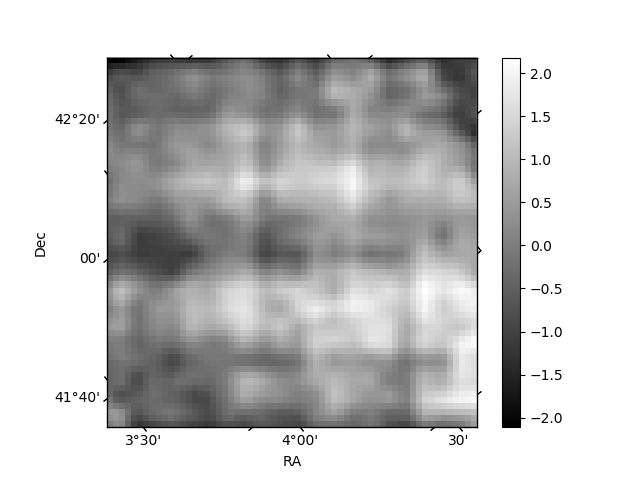
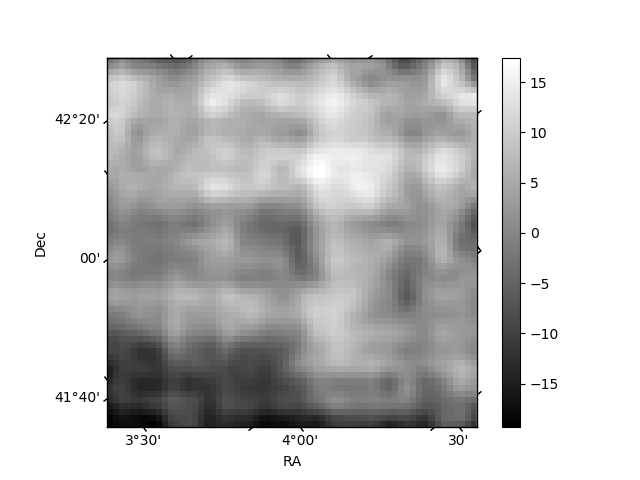
Histogram calculated using DETX and DETY for each event in the final _common_clean file
| Quadrant A | 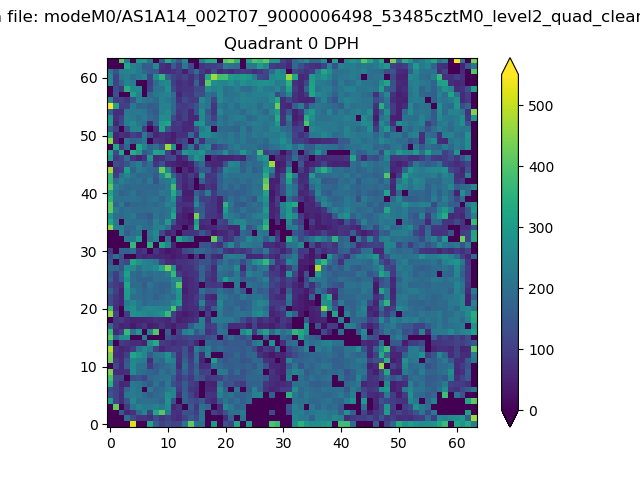 |
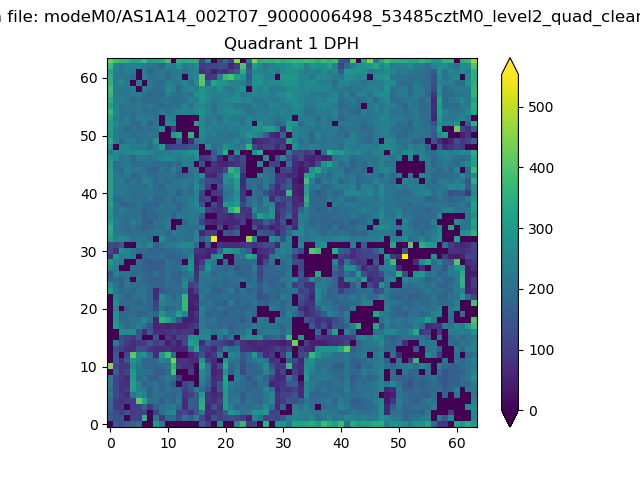 |
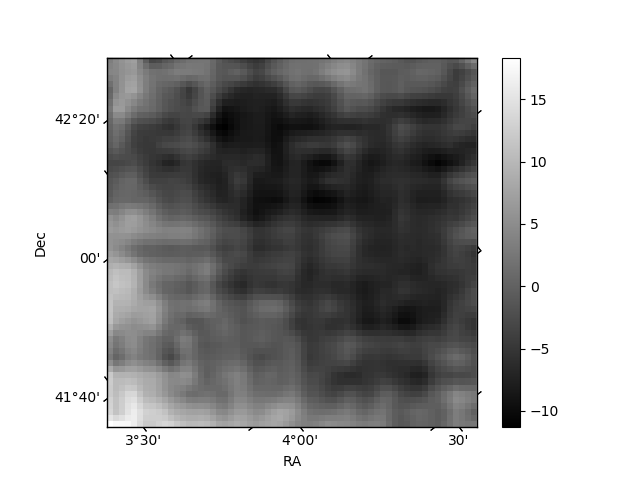
Quadrant B |
|---|---|---|---|
| Quadrant D | 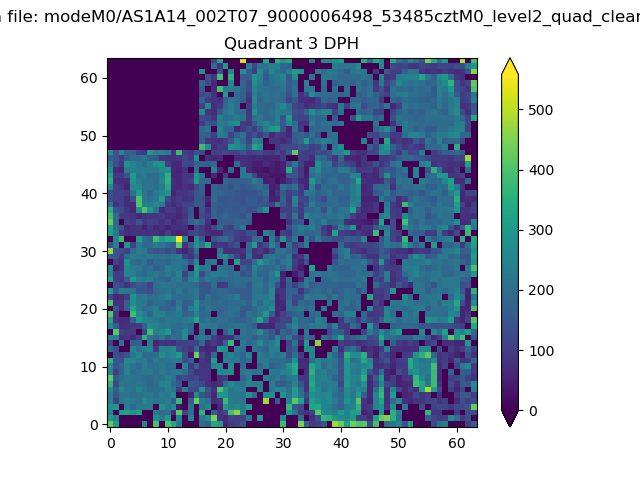 |
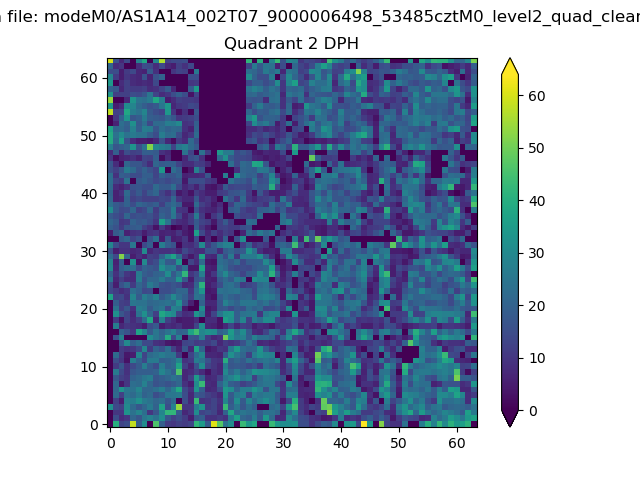 |
Quadrant C |
| Plot type | Count rate plots | Images |
|---|---|---|
| Comparison with Poisson distribution Blue bars denote a histogram of data divided into 1 sec bins. Red curve is a Poisson curve with rate = median count rate of data. |
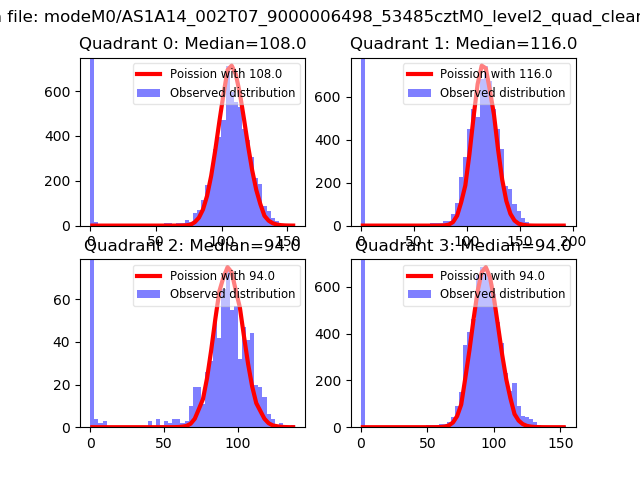 |
 |
| Quadrant-wise count rates Data is divided into 100 sec bins |
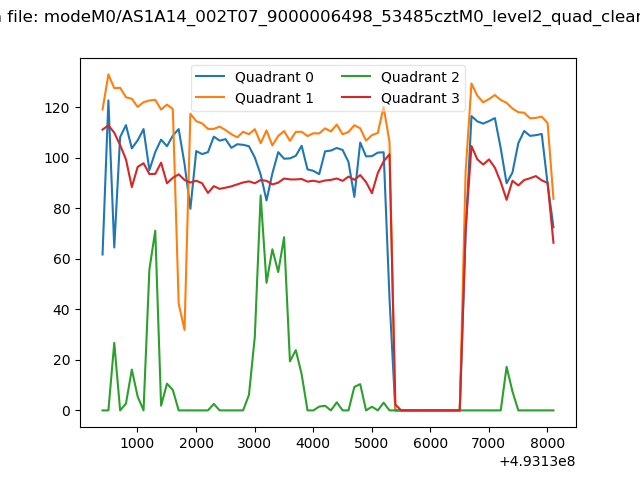 |
|
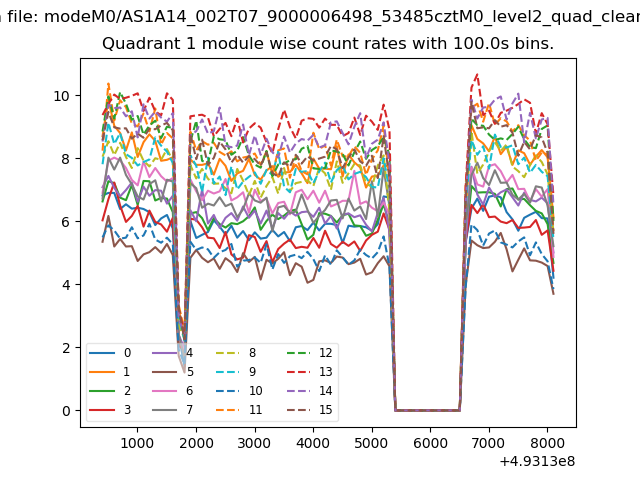
| Module-wise count rates for Quadrant A Data is divided into 100 sec bins |
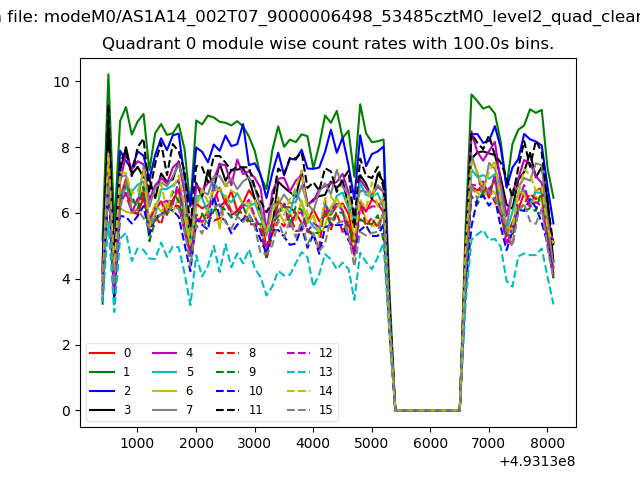 |
 |
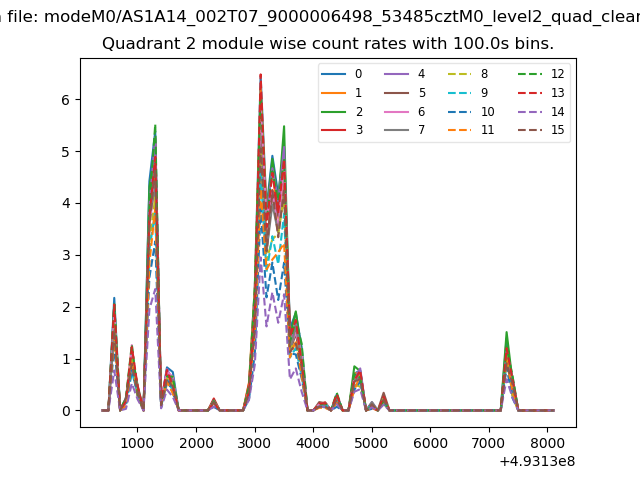
| Module-wise count rates for Quadrant B Data is divided into 100 sec bins |
 |
 |
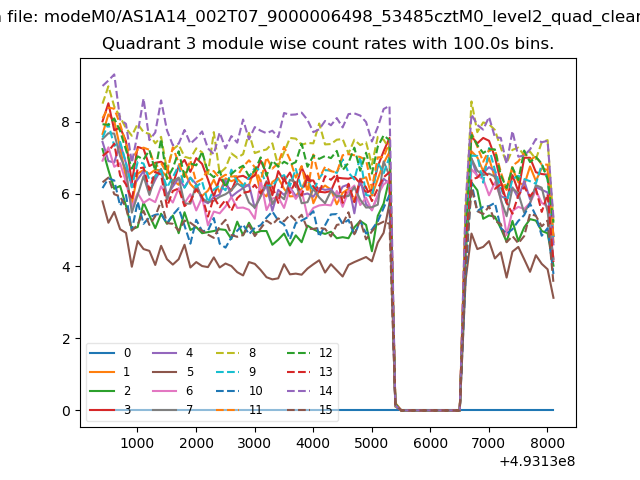
| Module-wise count rates for Quadrant C Data is divided into 100 sec bins |
 |
 |
| Module-wise count rates for Quadrant D Data is divided into 100 sec bins |
 |
 |
| Parameter | Plot |
|---|---|
| CZT HV Monitor | 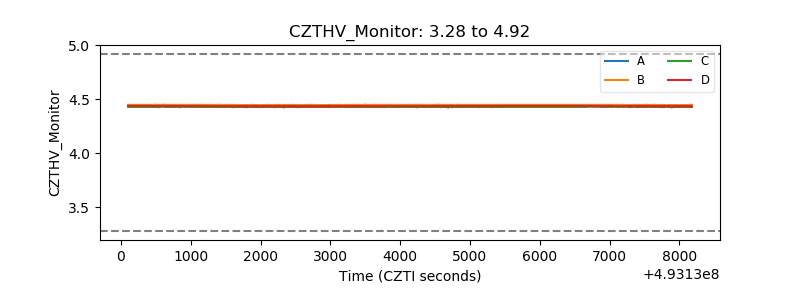 |
| D_VDD | 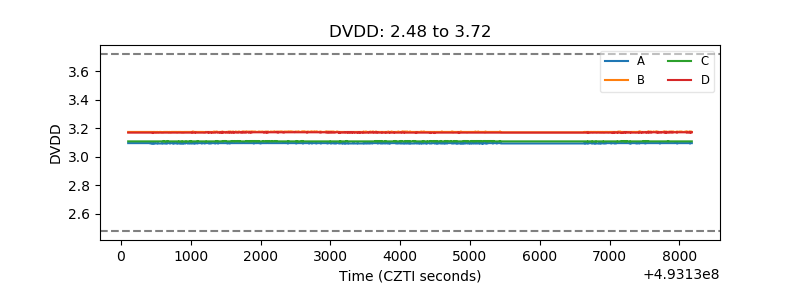 |
| Temperature 1 | 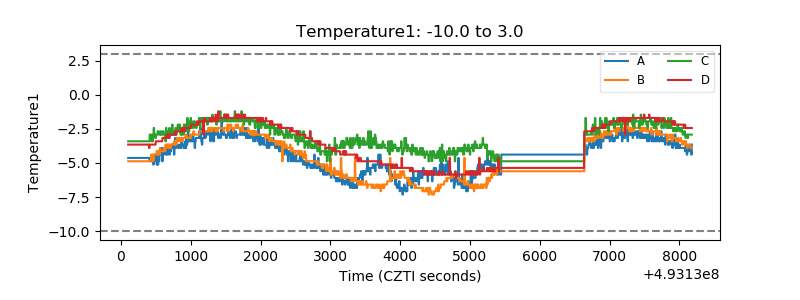 |
| Veto HV Monitor |  |
| Veto LLD | 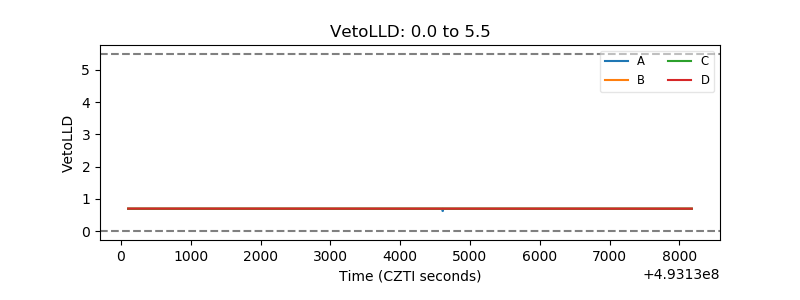 |
| Alpha Counter | 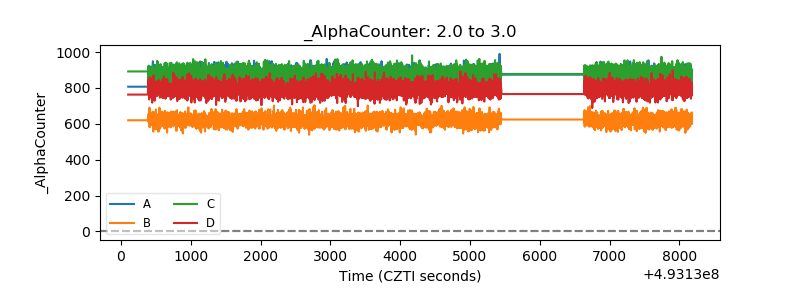 |
| _CPM_Rate | 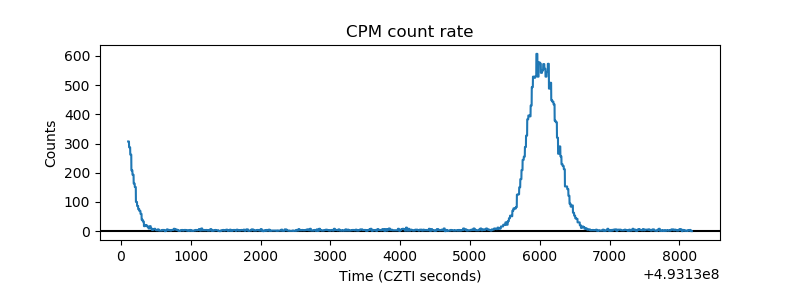 |
| CZT Counter | 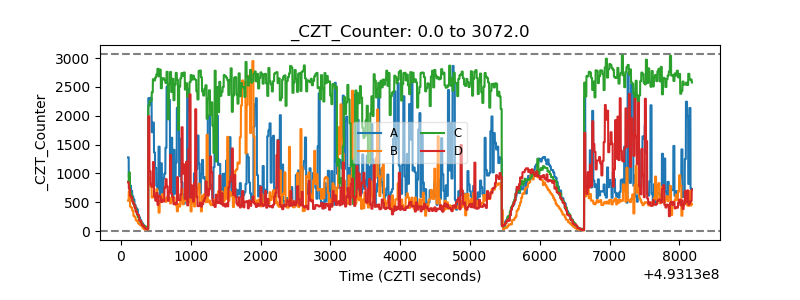 |
| +2.5 Volts monitor | 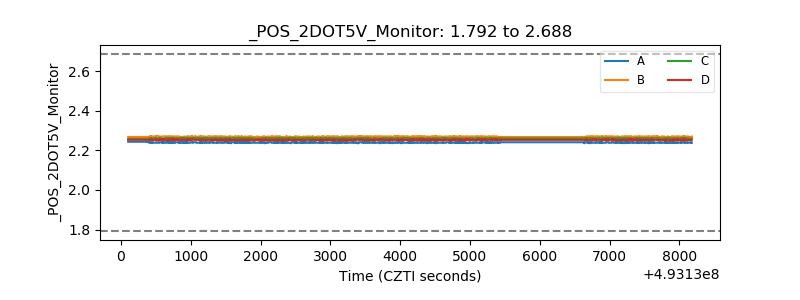 |
| +5 Volts monitor | 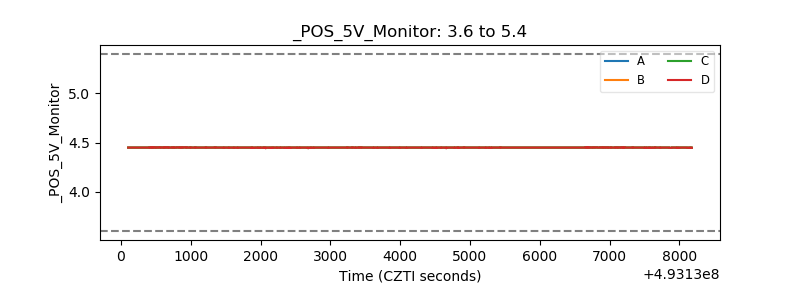 |
| _ROLL_ROT | 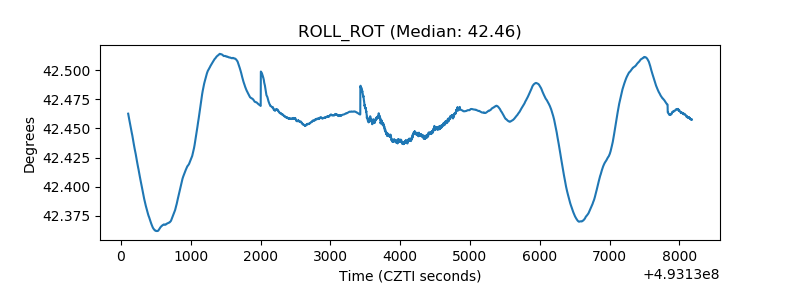 |
| _Roll_DEC | 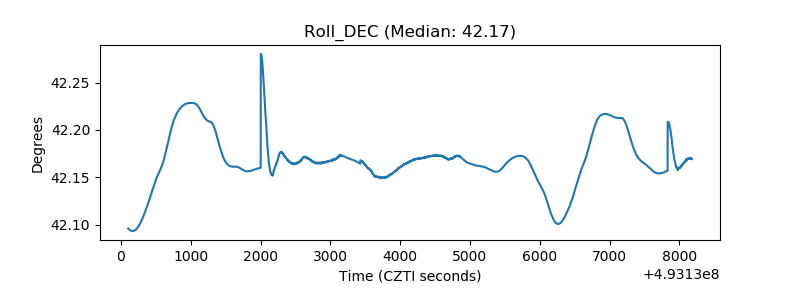 |
| _Roll_RA | 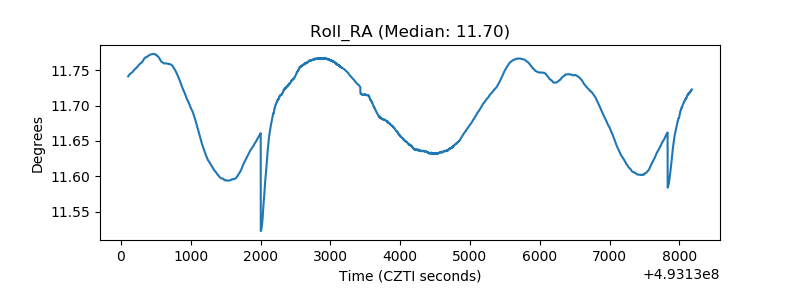 |
| Veto Counter | 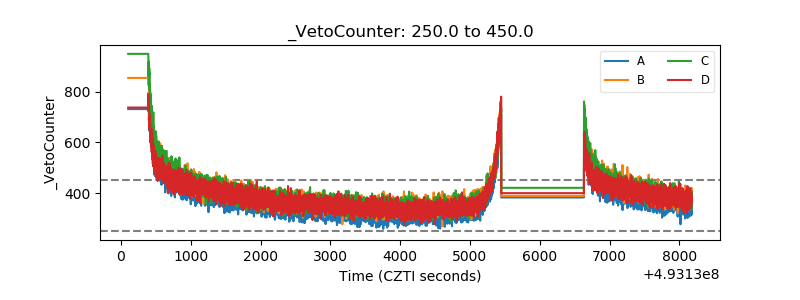 |