| Param | Original file | Final file |
|---|---|---|
| Filename | modeM0/AS1A14_002T07_9000006498_53486cztM0_level2.fits | modeM0/AS1A14_002T07_9000006498_53486cztM0_level2_quad_clean.evt |
| Size (bytes) | 791,375,040 | 86,123,520 |
| Size | 754.7 MB | 82.1 MB |
| Events in quadrant A | 7,152,374 | 607,609 |
| Events in quadrant B | 4,713,079 | 675,787 |
| Events in quadrant C | 12,590,421 | 272,837 |
| Events in quadrant D | 4,329,387 | 593,009 |
| Mode SS | |||
|---|---|---|---|
| Quadrant | BADHDUFLAG | Total packets | Discarded packets |
| A | 0 | 134 | 0 |
| B | 0 | 134 | 0 |
| C | 0 | 134 | 0 |
| D | 0 | 134 | 0 |
| Mode M9 | |||
|---|---|---|---|
| Quadrant | BADHDUFLAG | Total packets | Discarded packets |
| A | 0 | 20 | 0 |
| B | 0 | 21 | 0 |
| C | 0 | 21 | 0 |
| D | 0 | 21 | 0 |
| Mode M0 | |||
|---|---|---|---|
| Quadrant | BADHDUFLAG | Total packets | Discarded packets |
| A | 0 | 25863 | 2 |
| B | 0 | 18470 | 2 |
| C | 0 | 41969 | 2 |
| D | 0 | 17543 | 2 |
| Quadrant | Total seconds | Saturated seconds | Saturation percentage |
|---|---|---|---|
| A | 6571 | 979 | 14.898798% |
| B | 6571 | 704 | 10.713742% |
| C | 6570 | 3926 | 59.756469% |
| D | 6570 | 217 | 3.302892% |
Noise dominated data is calculated using 1-second bins in cleaned event files. If a bin has >2000 counts, and if more than 50% of those come from <1% of pixels, then it is considered to be noise-dominated and hence unusable.
| Quadrant | # 1 sec bins | Bins with >0 counts | Bins with >2000 counts | High rate bins dominated by noise | Noise dominated (total time) | Noise dominated (detector-on time) | Marked lightcurve |
|---|---|---|---|---|---|---|---|
| A | 7686 | 6571 | 760 | 760 | 9.89% | 11.57% | 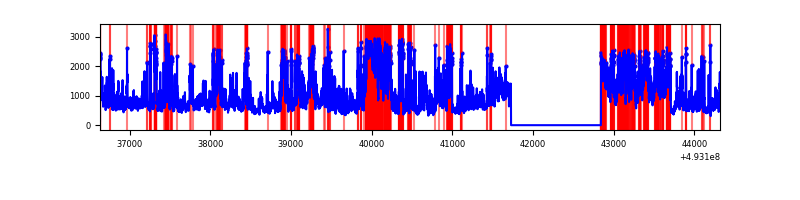 |
| B | 7685 | 6570 | 487 | 487 | 6.34% | 7.41% | 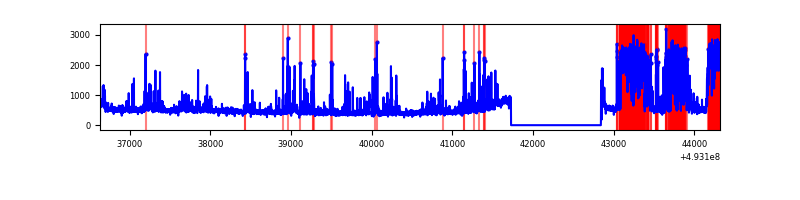 |
| C | 7685 | 6570 | 3759 | 3759 | 48.91% | 57.21% | 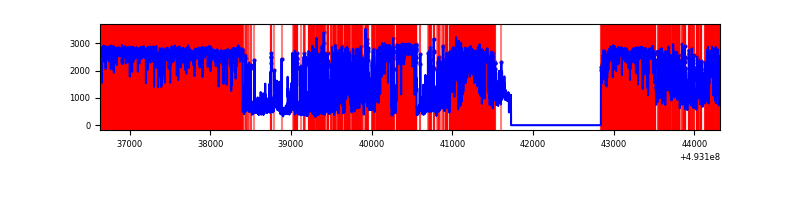 |
| D | 7685 | 6570 | 134 | 134 | 1.74% | 2.04% | 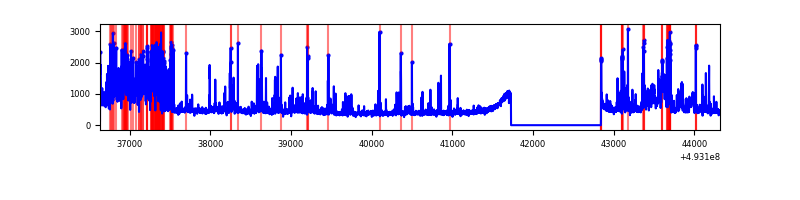 |
Top three noisy pixels from each quadrant. If the there are fewer than three noisy pixels in the level2.evt file, extra rows are filled as -1
| Pixel properties | Quadrant properties | ||||||
|---|---|---|---|---|---|---|---|
| Quadrant | DetID | PixID | Counts | Sigma | Mean | Median | Sigma |
| A | 3 | 63 | 2439161 | 13725.15 | 728 | 710 | 177.7 |
| A | 3 | 62 | 938483 | 5278.38 | 728 | 710 | 177.7 |
| A | 15 | 174 | 704839 | 3963.29 | 728 | 710 | 177.7 |
| B | 2 | 249 | 1072754 | 6898.86 | 721 | 695 | 155.4 |
| B | 5 | 185 | 337252 | 2165.79 | 721 | 695 | 155.4 |
| B | 10 | 28 | 162072 | 1038.48 | 721 | 695 | 155.4 |
| C | 7 | 64 | 3886787 | 30924.98 | 458 | 454 | 125.7 |
| C | 1 | 241 | 2944339 | 23425.57 | 458 | 454 | 125.7 |
| C | 15 | 224 | 1923424 | 15301.78 | 458 | 454 | 125.7 |
| D | 11 | 245 | 743367 | 3563.94 | 734 | 699 | 208.4 |
| D | 2 | 249 | 297479 | 1424.2 | 734 | 699 | 208.4 |
| D | 3 | 12 | 129067 | 616.02 | 734 | 699 | 208.4 |
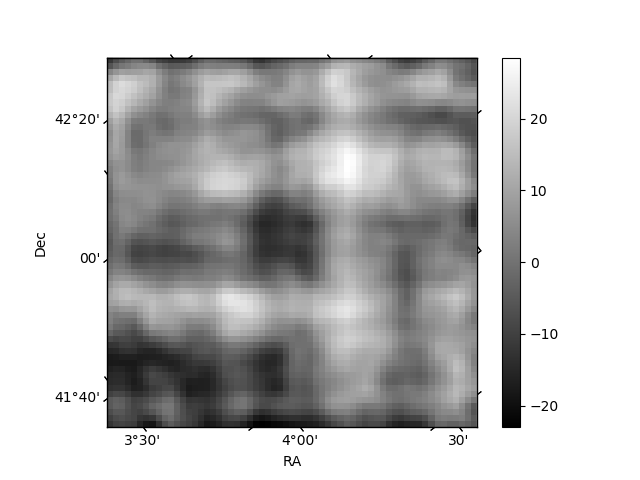
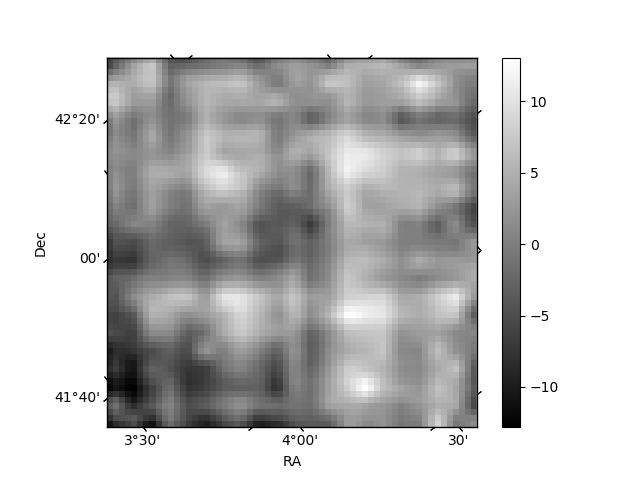
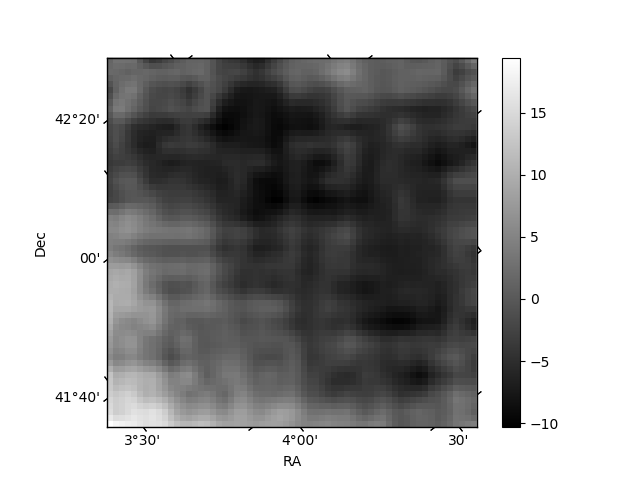
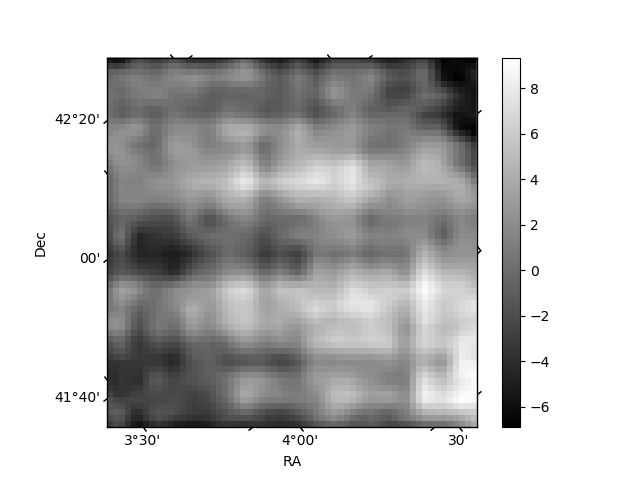
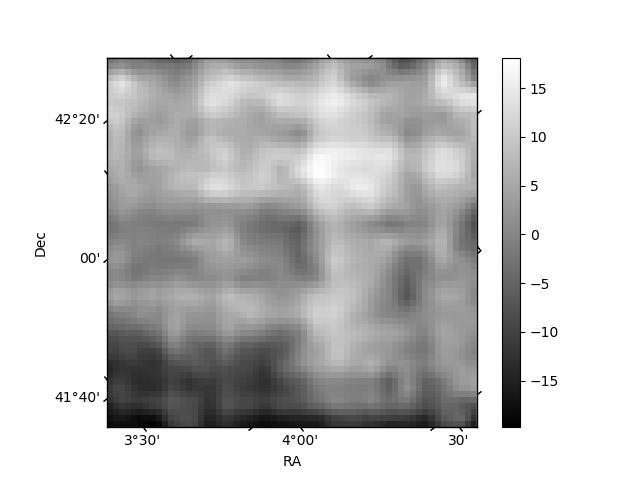
Histogram calculated using DETX and DETY for each event in the final _common_clean file
| Quadrant A | 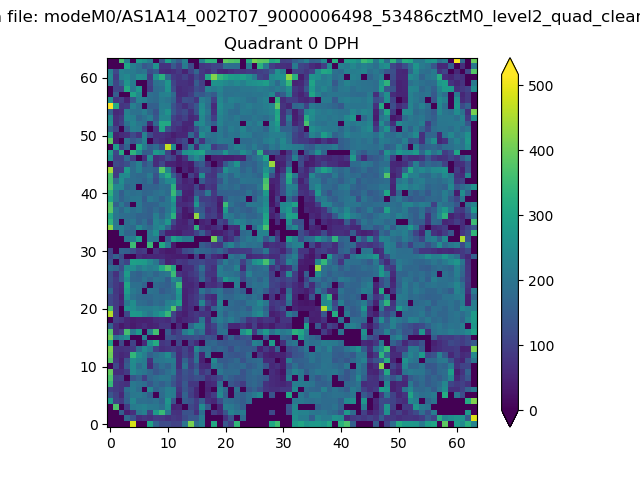 |
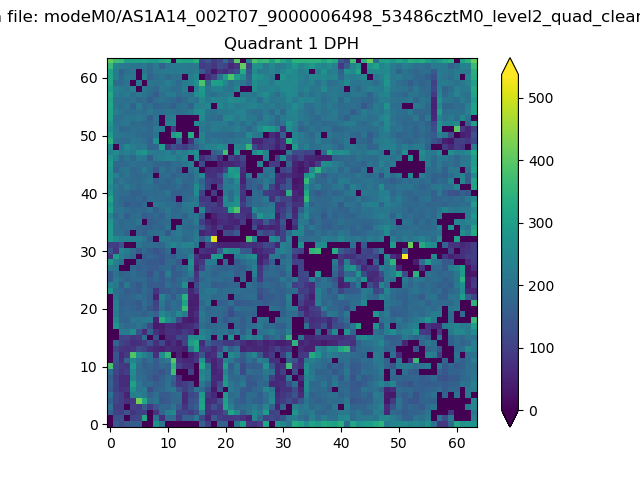 |
Quadrant B |
|---|---|---|---|
| Quadrant D | 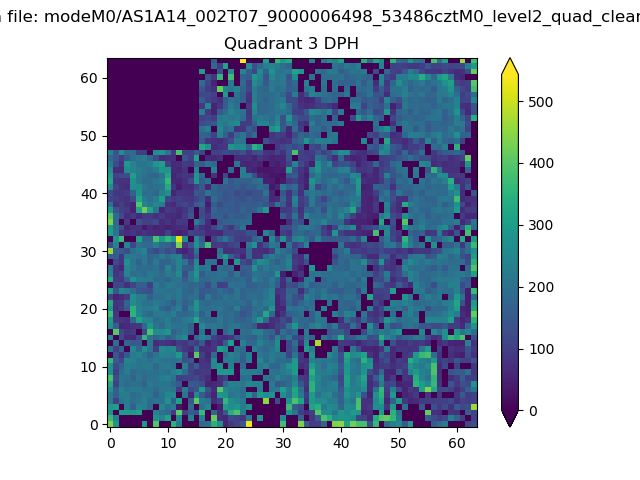 |
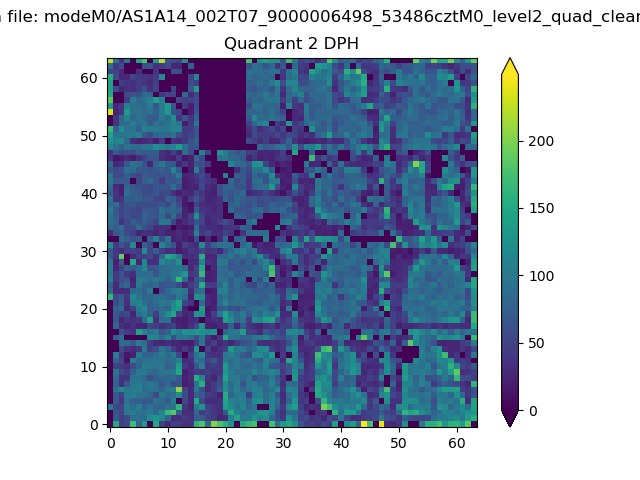 |
Quadrant C |
| Plot type | Count rate plots | Images |
|---|---|---|
| Comparison with Poisson distribution Blue bars denote a histogram of data divided into 1 sec bins. Red curve is a Poisson curve with rate = median count rate of data. |
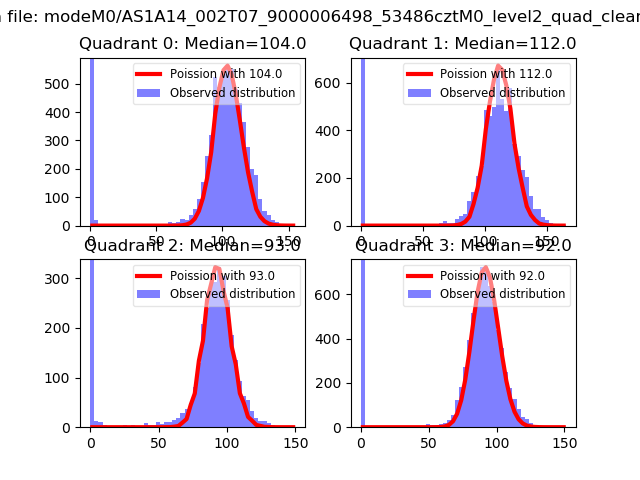 |
 |
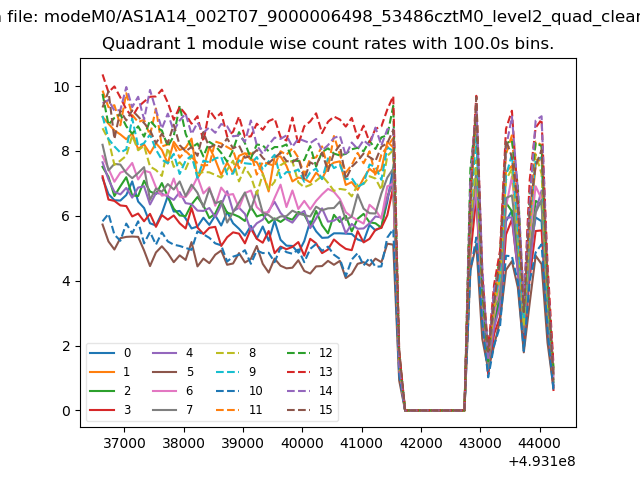
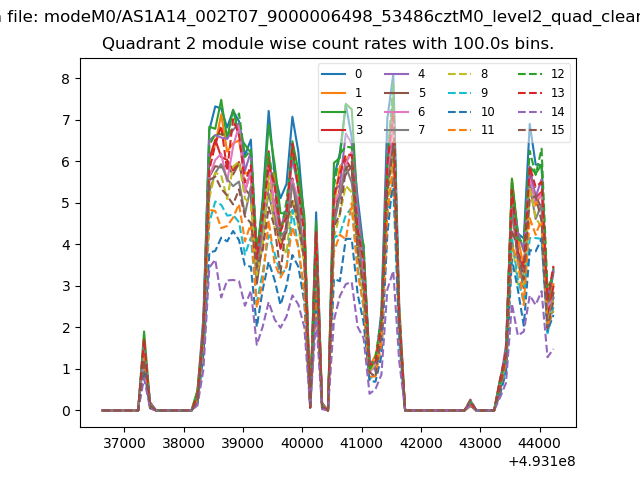
| Quadrant-wise count rates Data is divided into 100 sec bins |
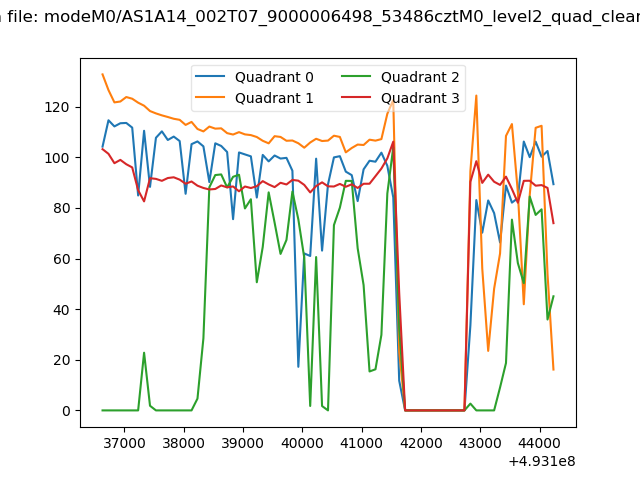 |
|
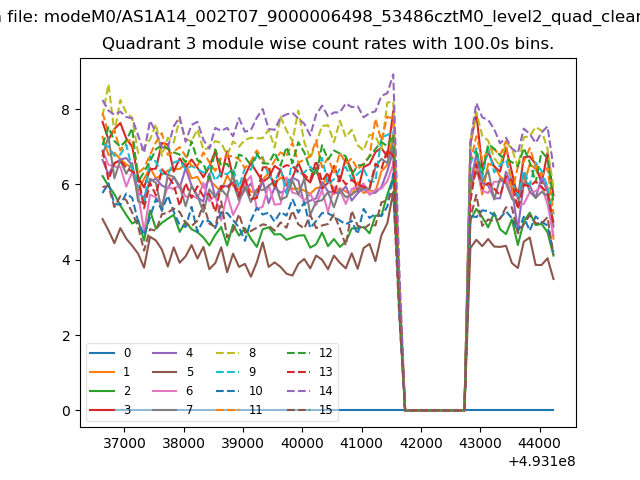
| Module-wise count rates for Quadrant A Data is divided into 100 sec bins |
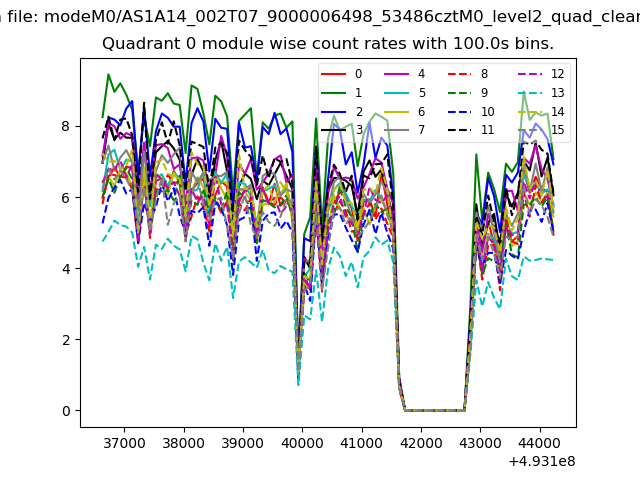 |
 |
| Module-wise count rates for Quadrant B Data is divided into 100 sec bins |
 |
 |
| Module-wise count rates for Quadrant C Data is divided into 100 sec bins |
 |
 |
| Module-wise count rates for Quadrant D Data is divided into 100 sec bins |
 |
 |
| Parameter | Plot |
|---|---|
| CZT HV Monitor | 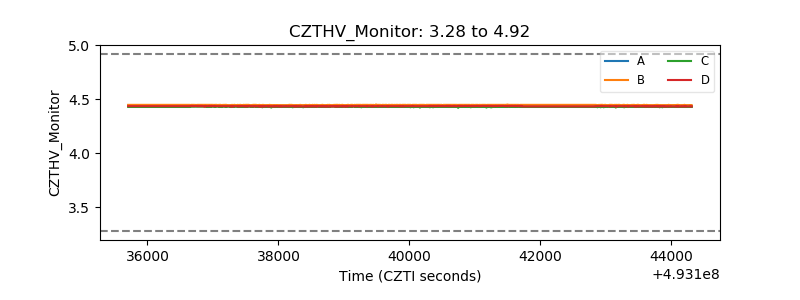 |
| D_VDD | 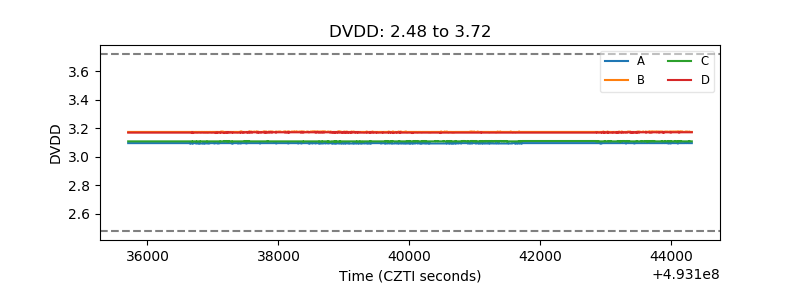 |
| Temperature 1 | 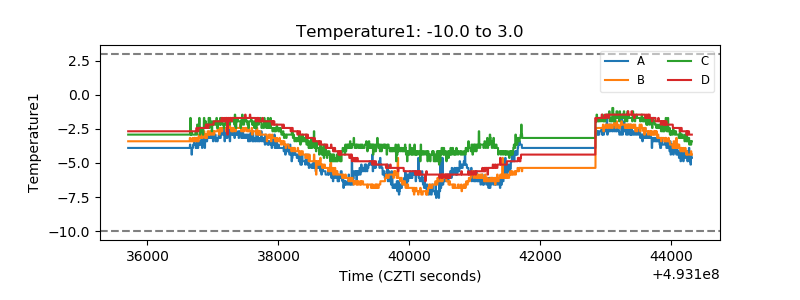 |
| Veto HV Monitor | 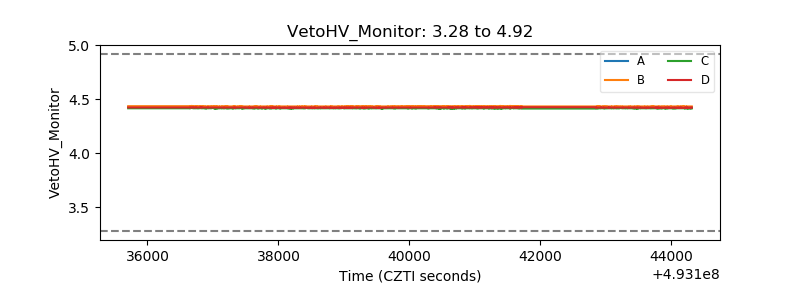 |
| Veto LLD | 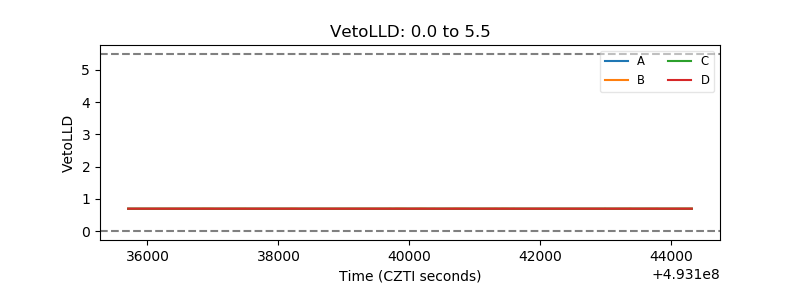 |
| Alpha Counter | 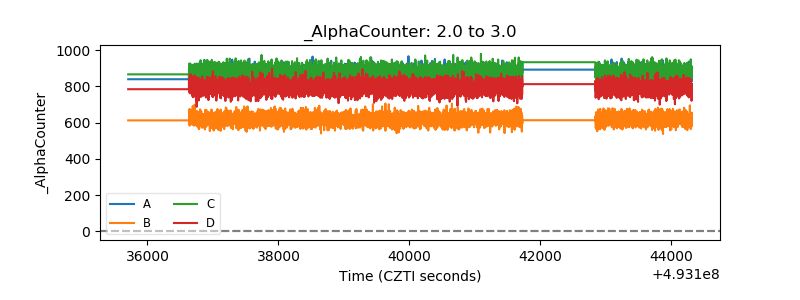 |
| _CPM_Rate | 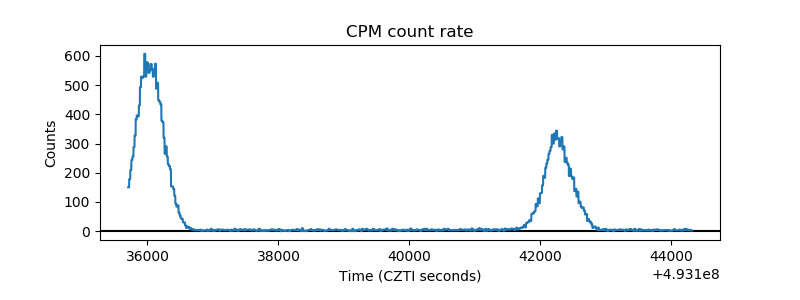 |
| CZT Counter | 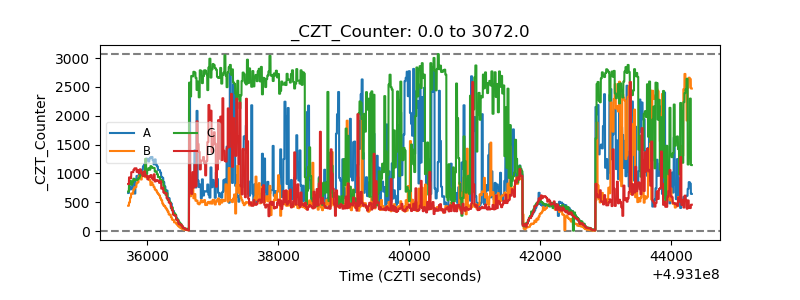 |
| +2.5 Volts monitor | 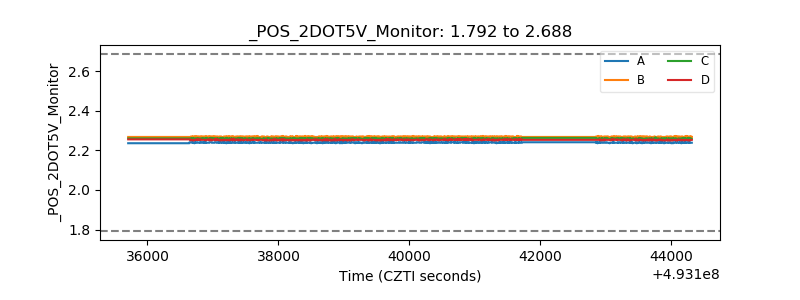 |
| +5 Volts monitor | 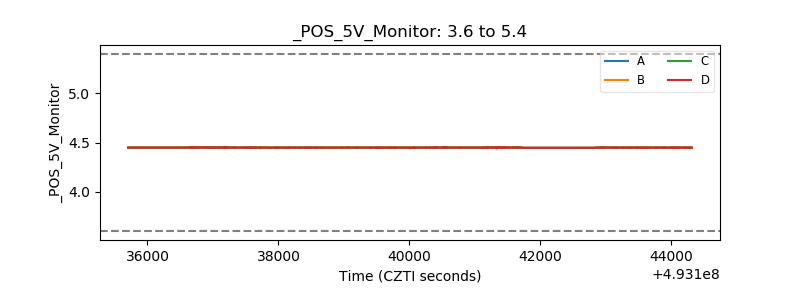 |
| _ROLL_ROT | 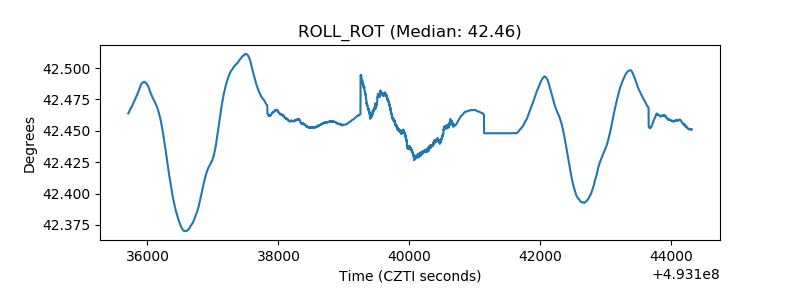 |
| _Roll_DEC | 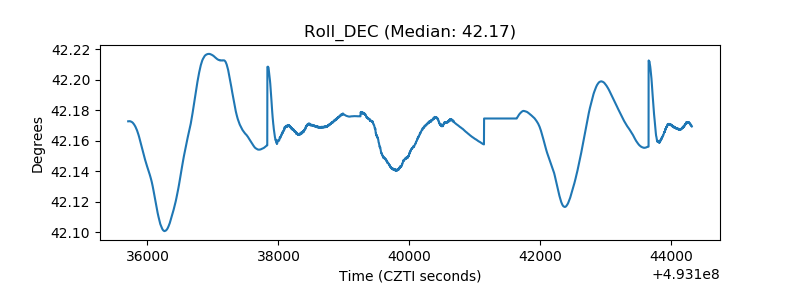 |
| _Roll_RA | 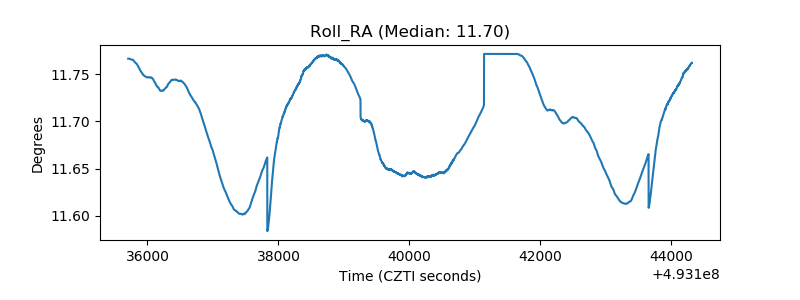 |
| Veto Counter | 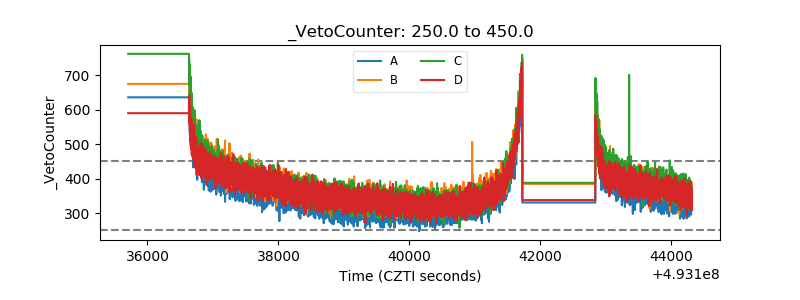 |