| Param | Original file | Final file |
|---|---|---|
| Filename | modeM0/AS1A14_002T07_9000006498_53487cztM0_level2.fits | modeM0/AS1A14_002T07_9000006498_53487cztM0_level2_quad_clean.evt |
| Size (bytes) | 1,038,265,920 | 74,635,200 |
| Size | 990.2 MB | 71.2 MB |
| Events in quadrant A | 10,183,551 | 506,354 |
| Events in quadrant B | 7,869,257 | 573,393 |
| Events in quadrant C | 15,938,135 | 103,779 |
| Events in quadrant D | 3,911,148 | 597,152 |
| Mode SS | |||
|---|---|---|---|
| Quadrant | BADHDUFLAG | Total packets | Discarded packets |
| A | 0 | 142 | 0 |
| B | 0 | 142 | 0 |
| C | 0 | 142 | 0 |
| D | 0 | 142 | 0 |
| Mode M9 | |||
|---|---|---|---|
| Quadrant | BADHDUFLAG | Total packets | Discarded packets |
| A | 0 | 20 | 0 |
| B | 0 | 20 | 0 |
| C | 0 | 20 | 0 |
| D | 0 | 20 | 0 |
| Mode M0 | |||
|---|---|---|---|
| Quadrant | BADHDUFLAG | Total packets | Discarded packets |
| A | 0 | 35084 | 2 |
| B | 0 | 27994 | 2 |
| C | 0 | 52028 | 7 |
| D | 0 | 16488 | 2 |
| Quadrant | Total seconds | Saturated seconds | Saturation percentage |
|---|---|---|---|
| A | 6870 | 2192 | 31.906841% |
| B | 6871 | 1832 | 26.662786% |
| C | 6870 | 5942 | 86.491994% |
| D | 6870 | 212 | 3.085881% |
Noise dominated data is calculated using 1-second bins in cleaned event files. If a bin has >2000 counts, and if more than 50% of those come from <1% of pixels, then it is considered to be noise-dominated and hence unusable.
| Quadrant | # 1 sec bins | Bins with >0 counts | Bins with >2000 counts | High rate bins dominated by noise | Noise dominated (total time) | Noise dominated (detector-on time) | Marked lightcurve |
|---|---|---|---|---|---|---|---|
| A | 8905 | 6870 | 1808 | 1808 | 20.30% | 26.32% | 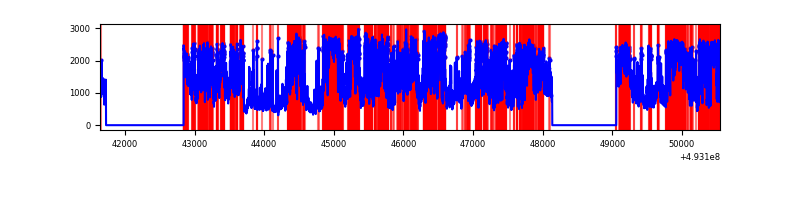 |
| B | 8906 | 6871 | 1500 | 1500 | 16.84% | 21.83% | 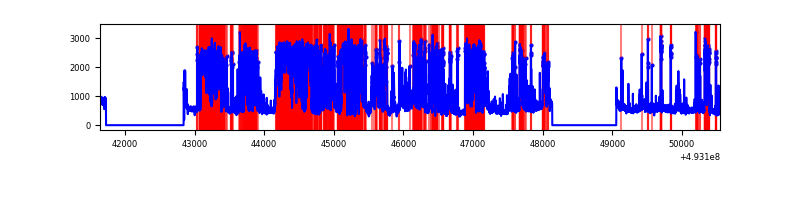 |
| C | 8904 | 6869 | 5597 | 5597 | 62.86% | 81.48% | 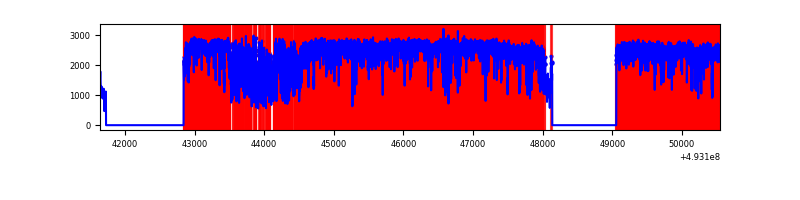 |
| D | 8905 | 6870 | 82 | 82 | 0.92% | 1.19% | 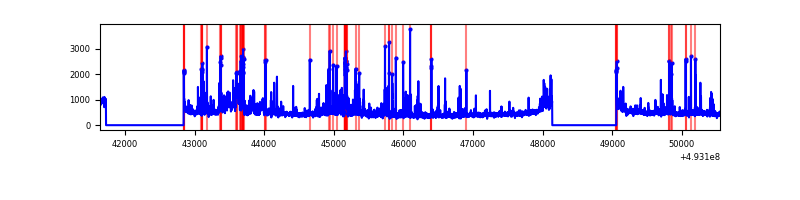 |
Top three noisy pixels from each quadrant. If the there are fewer than three noisy pixels in the level2.evt file, extra rows are filled as -1
| Pixel properties | Quadrant properties | ||||||
|---|---|---|---|---|---|---|---|
| Quadrant | DetID | PixID | Counts | Sigma | Mean | Median | Sigma |
| A | 3 | 63 | 5589103 | 32880.22 | 698 | 682 | 170.0 |
| A | 15 | 174 | 1208052 | 7103.72 | 698 | 682 | 170.0 |
| A | 3 | 62 | 424577 | 2494.04 | 698 | 682 | 170.0 |
| B | 2 | 249 | 4232314 | 29011.81 | 681 | 658 | 145.9 |
| B | 5 | 185 | 479704 | 3284.29 | 681 | 658 | 145.9 |
| B | 10 | 28 | 125852 | 858.32 | 681 | 658 | 145.9 |
| C | 7 | 64 | 9106951 | 91947.69 | 364 | 361 | 99.0 |
| C | 15 | 224 | 1591754 | 16068.02 | 364 | 361 | 99.0 |
| C | 9 | 38 | 1397102 | 14102.66 | 364 | 361 | 99.0 |
| D | 2 | 249 | 296908 | 1373.81 | 758 | 722 | 215.6 |
| D | 3 | 12 | 178587 | 825.0 | 758 | 722 | 215.6 |
| D | 12 | 35 | 151116 | 697.58 | 758 | 722 | 215.6 |
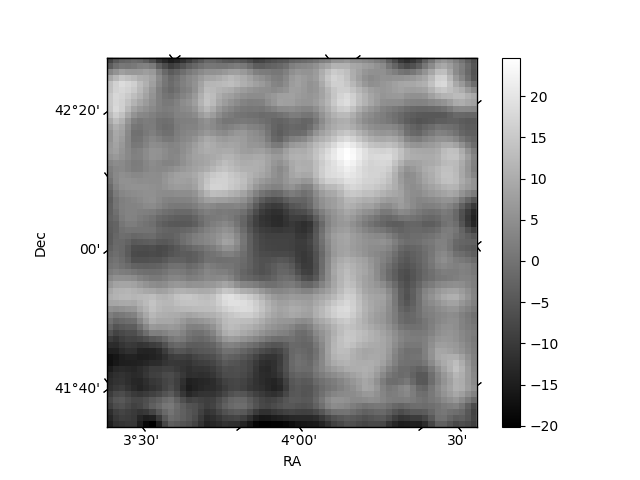
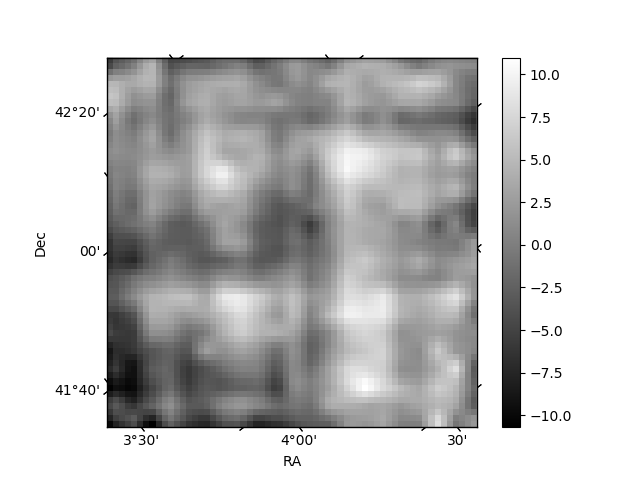
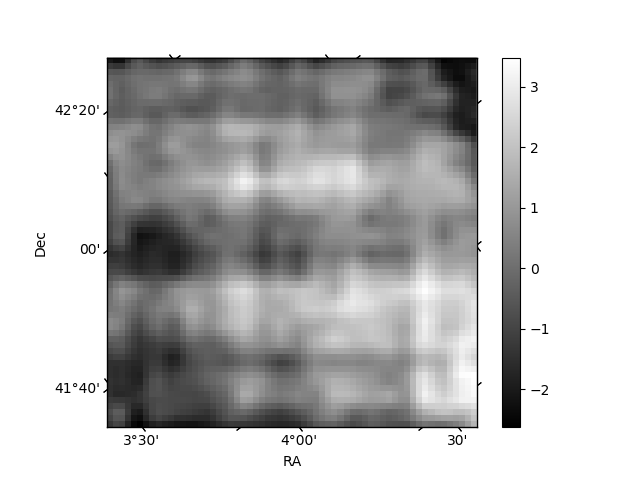
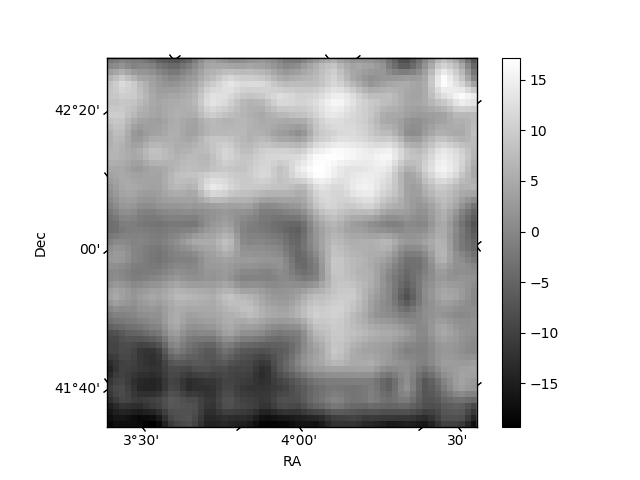
Histogram calculated using DETX and DETY for each event in the final _common_clean file
| Quadrant A | 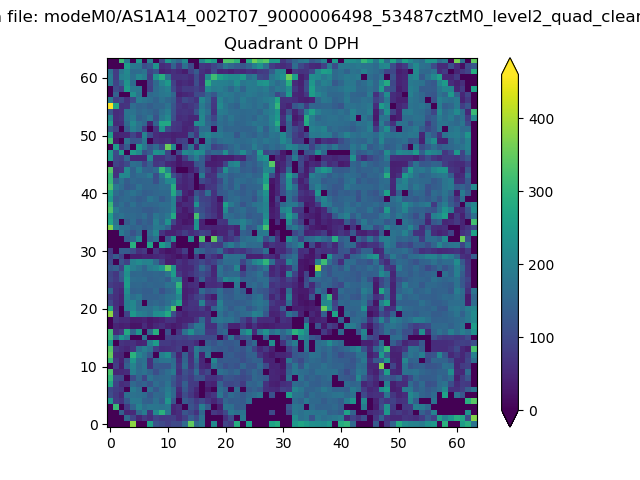 |
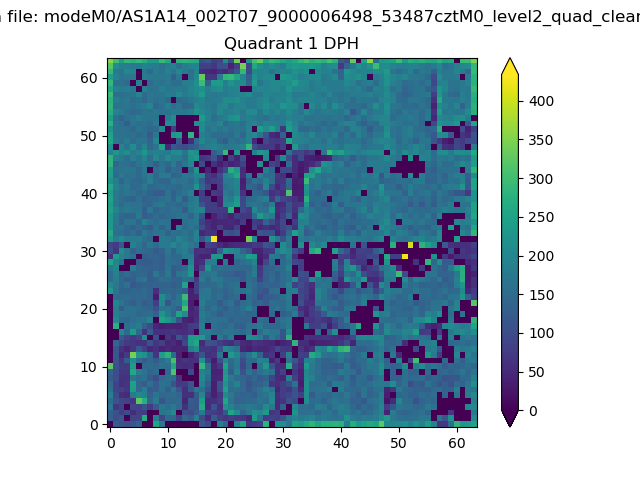 |
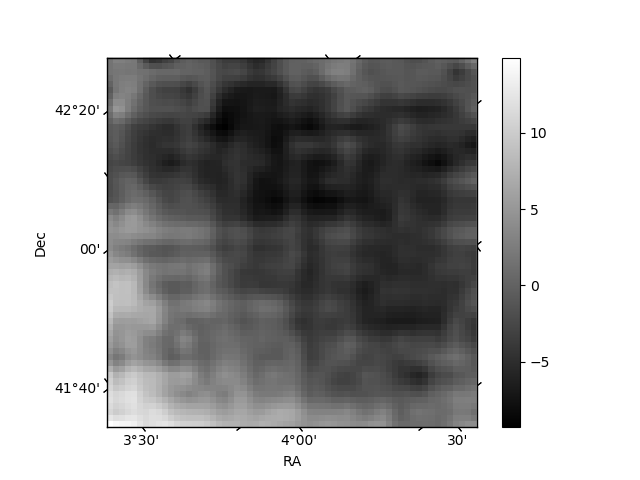
Quadrant B |
|---|---|---|---|
| Quadrant D | 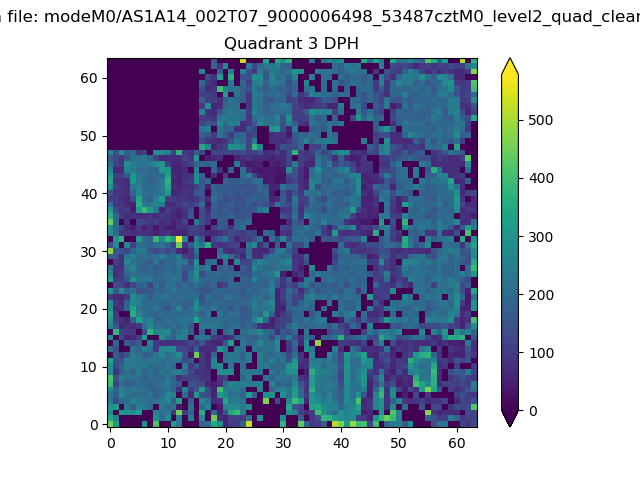 |
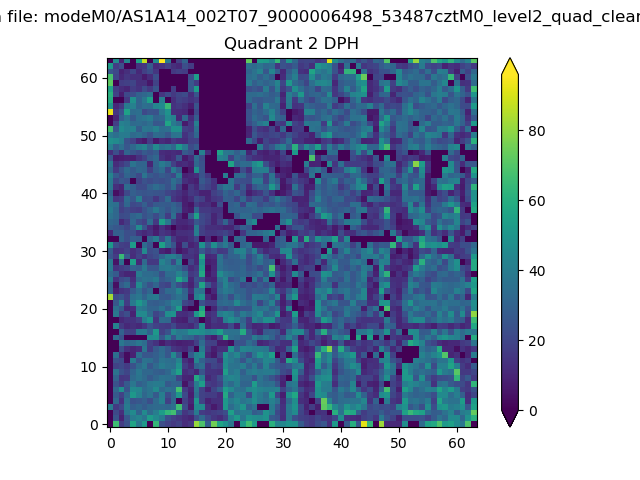 |
Quadrant C |
| Plot type | Count rate plots | Images |
|---|---|---|
| Comparison with Poisson distribution Blue bars denote a histogram of data divided into 1 sec bins. Red curve is a Poisson curve with rate = median count rate of data. |
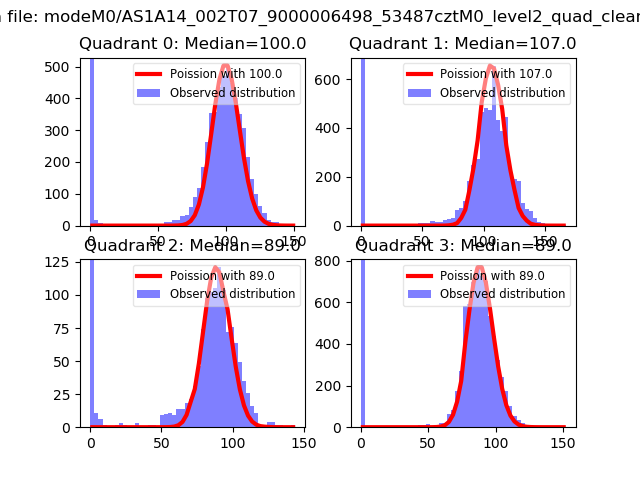 |
 |
| Quadrant-wise count rates Data is divided into 100 sec bins |
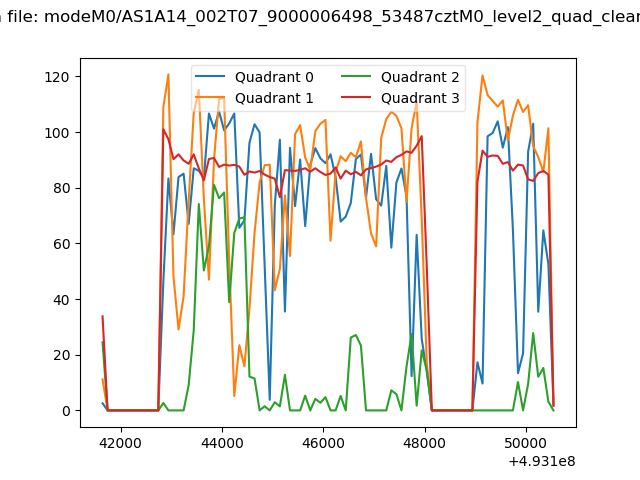 |
|
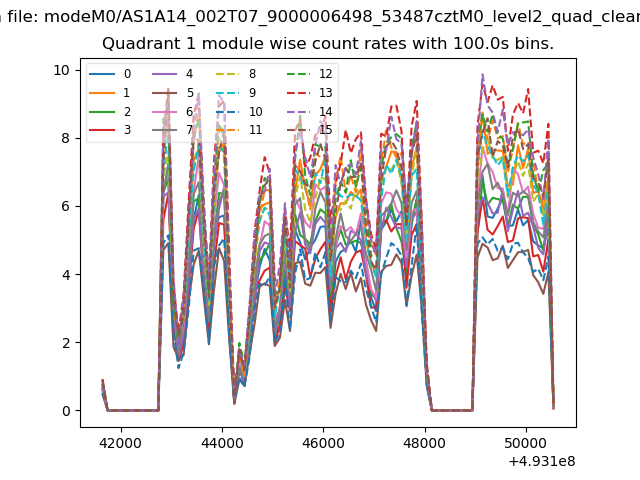
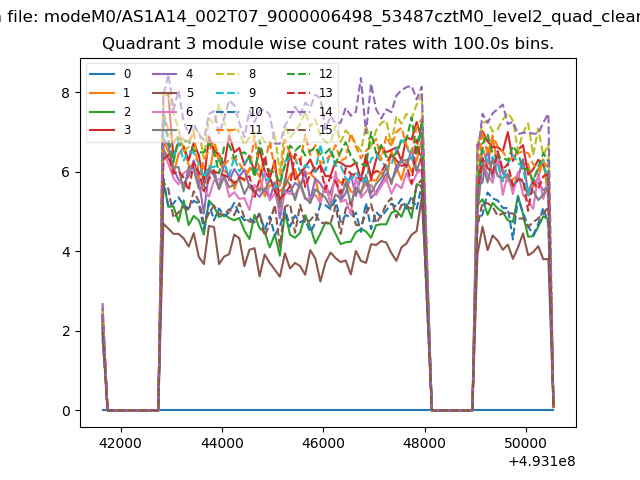
| Module-wise count rates for Quadrant A Data is divided into 100 sec bins |
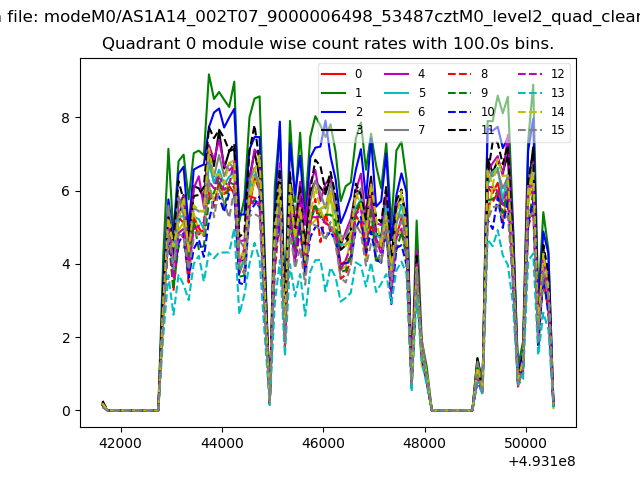 |
 |
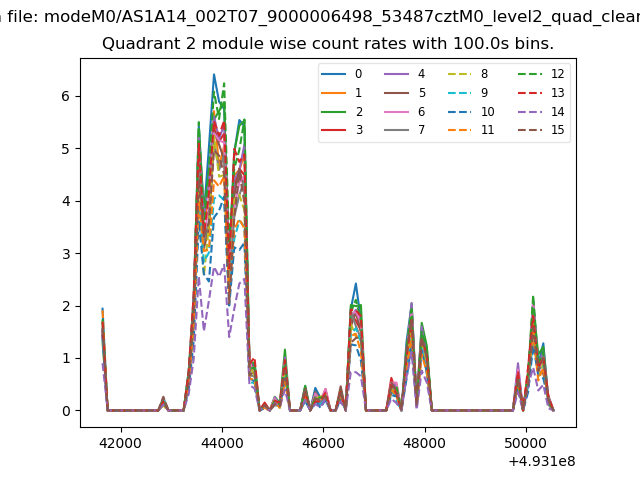
| Module-wise count rates for Quadrant B Data is divided into 100 sec bins |
 |
 |
| Module-wise count rates for Quadrant C Data is divided into 100 sec bins |
 |
 |
| Module-wise count rates for Quadrant D Data is divided into 100 sec bins |
 |
 |
| Parameter | Plot |
|---|---|
| CZT HV Monitor | 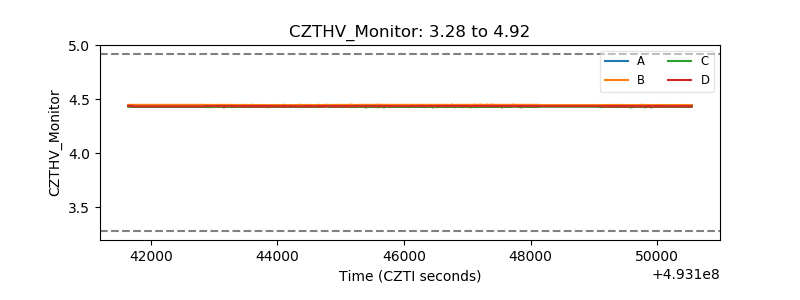 |
| D_VDD | 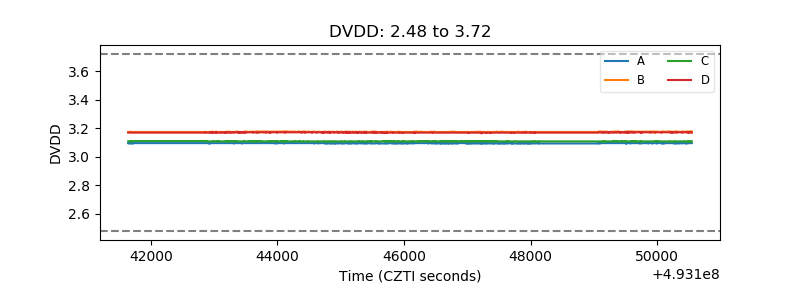 |
| Temperature 1 | 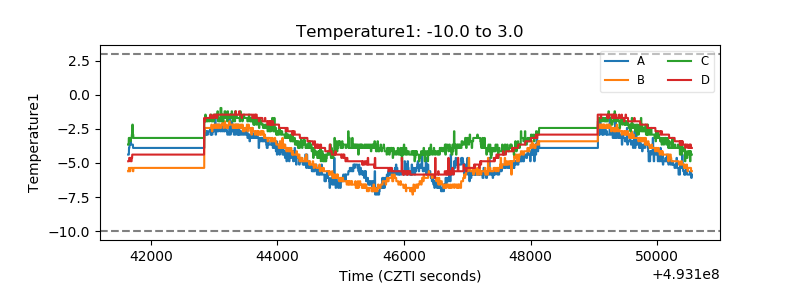 |
| Veto HV Monitor | 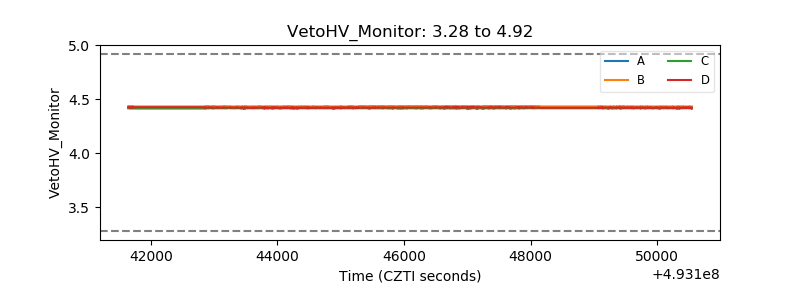 |
| Veto LLD | 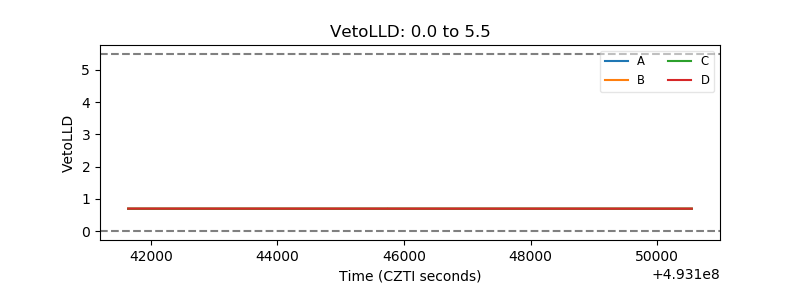 |
| Alpha Counter | 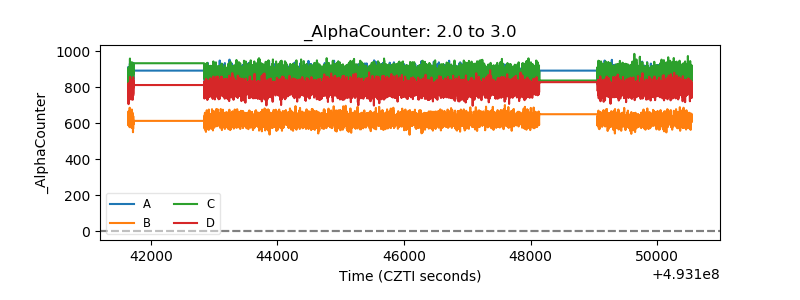 |
| _CPM_Rate | 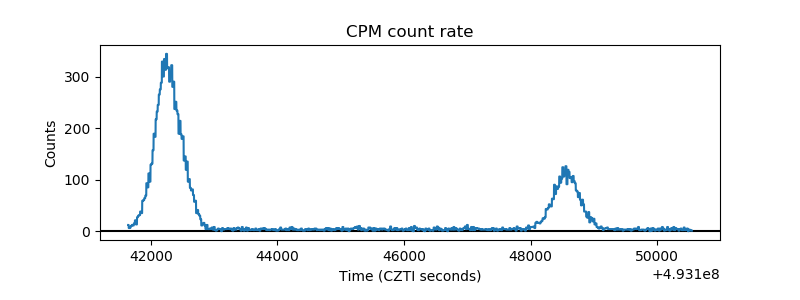 |
| CZT Counter | 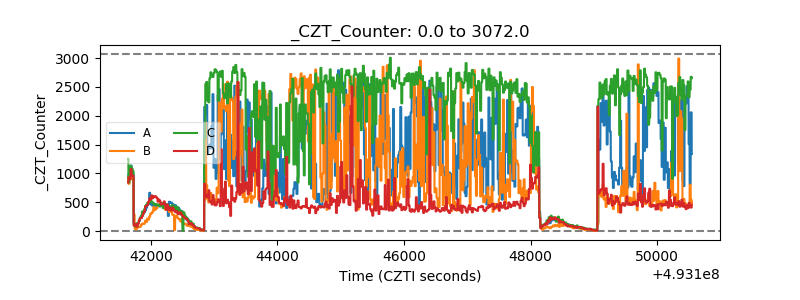 |
| +2.5 Volts monitor | 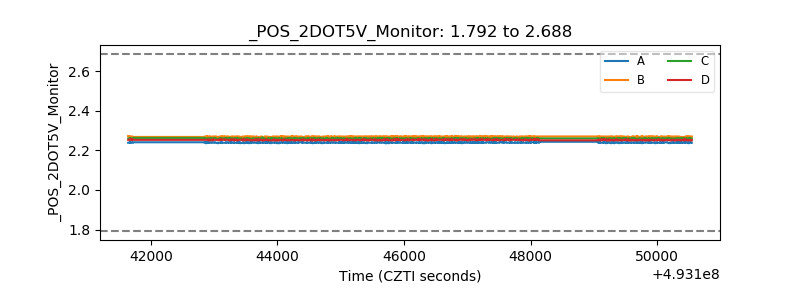 |
| +5 Volts monitor | 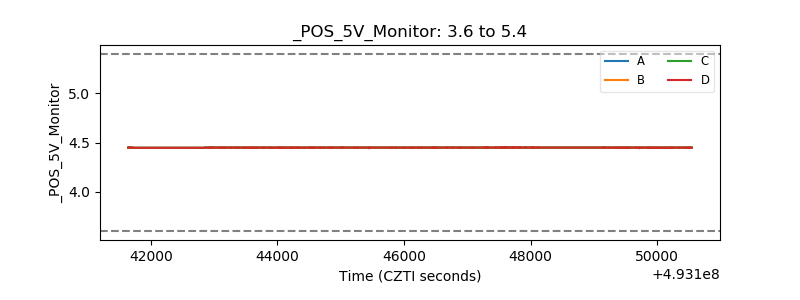 |
| _ROLL_ROT | 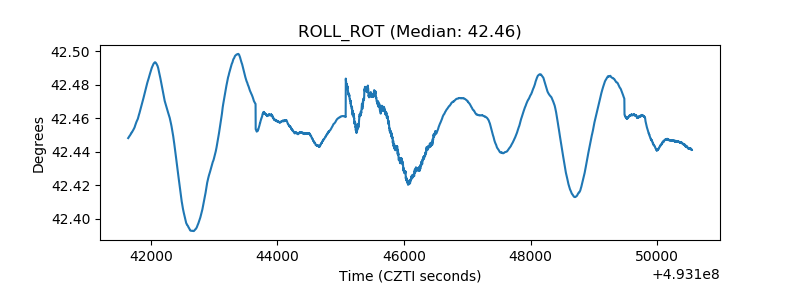 |
| _Roll_DEC | 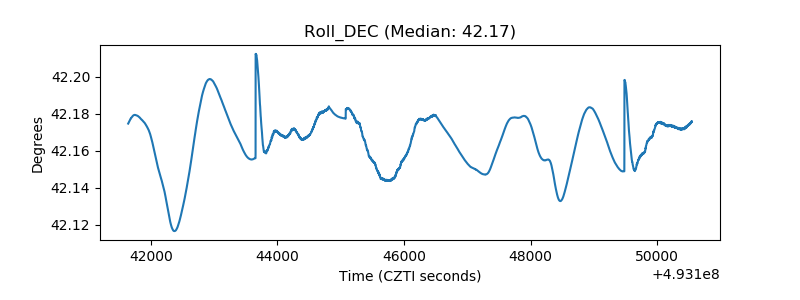 |
| _Roll_RA | 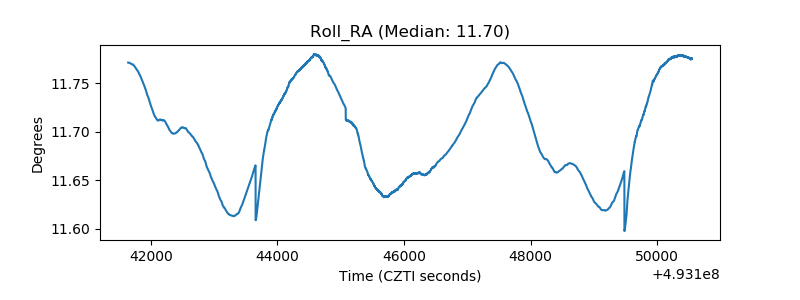 |
| Veto Counter | 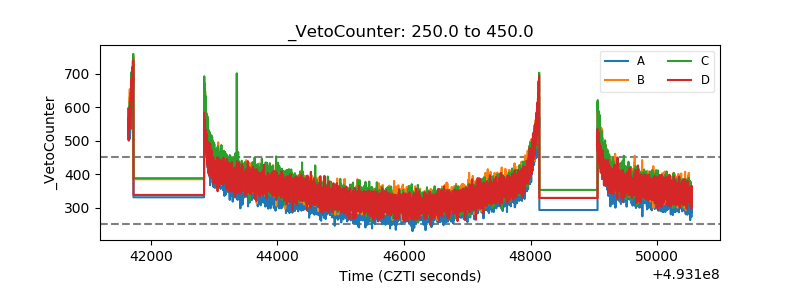 |