| Param | Original file | Final file |
|---|---|---|
| Filename | modeM0/AS1A14_002T07_9000006498_53488cztM0_level2.fits | modeM0/AS1A14_002T07_9000006498_53488cztM0_level2_quad_clean.evt |
| Size (bytes) | 1,047,130,560 | 83,934,720 |
| Size | 998.6 MB | 80.0 MB |
| Events in quadrant A | 11,466,721 | 489,876 |
| Events in quadrant B | 6,882,060 | 710,165 |
| Events in quadrant C | 15,948,235 | 193,100 |
| Events in quadrant D | 3,894,517 | 634,074 |
| Mode SS | |||
|---|---|---|---|
| Quadrant | BADHDUFLAG | Total packets | Discarded packets |
| A | 0 | 154 | 0 |
| B | 0 | 154 | 0 |
| C | 0 | 154 | 0 |
| D | 0 | 154 | 0 |
| Mode M9 | |||
|---|---|---|---|
| Quadrant | BADHDUFLAG | Total packets | Discarded packets |
| A | 0 | 13 | 0 |
| B | 0 | 13 | 0 |
| C | 0 | 13 | 0 |
| D | 0 | 13 | 0 |
| Mode M0 | |||
|---|---|---|---|
| Quadrant | BADHDUFLAG | Total packets | Discarded packets |
| A | 0 | 39222 | 7 |
| B | 0 | 25487 | 3 |
| C | 0 | 52438 | 3 |
| D | 0 | 16868 | 3 |
| Quadrant | Total seconds | Saturated seconds | Saturation percentage |
|---|---|---|---|
| A | 7372 | 2759 | 37.425393% |
| B | 7372 | 972 | 13.185024% |
| C | 7372 | 5582 | 75.718937% |
| D | 7372 | 193 | 2.618014% |
Noise dominated data is calculated using 1-second bins in cleaned event files. If a bin has >2000 counts, and if more than 50% of those come from <1% of pixels, then it is considered to be noise-dominated and hence unusable.
| Quadrant | # 1 sec bins | Bins with >0 counts | Bins with >2000 counts | High rate bins dominated by noise | Noise dominated (total time) | Noise dominated (detector-on time) | Marked lightcurve |
|---|---|---|---|---|---|---|---|
| A | 8807 | 7373 | 2400 | 2400 | 27.25% | 32.55% | 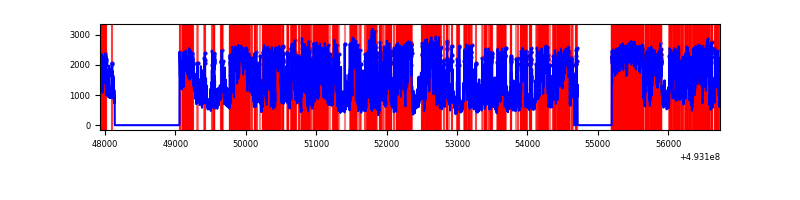 |
| B | 8807 | 7374 | 674 | 674 | 7.65% | 9.14% | 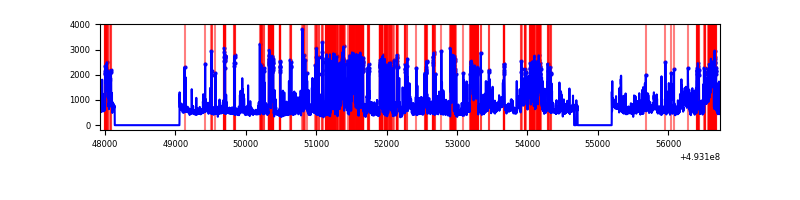 |
| C | 8806 | 7371 | 5330 | 5330 | 60.53% | 72.31% | 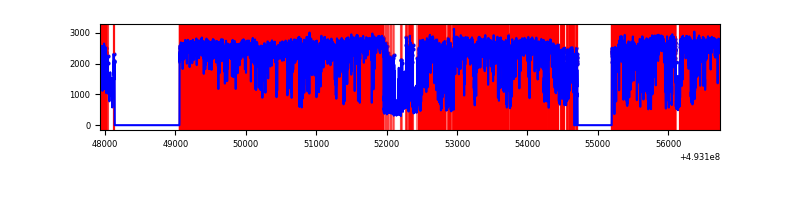 |
| D | 8807 | 7374 | 93 | 93 | 1.06% | 1.26% | 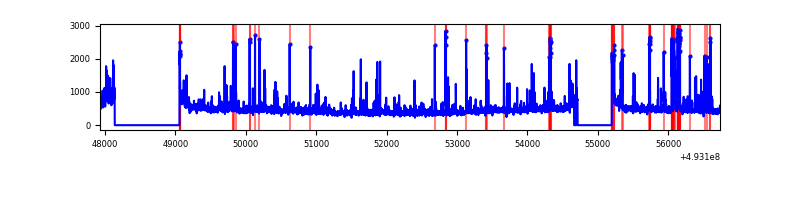 |
Top three noisy pixels from each quadrant. If the there are fewer than three noisy pixels in the level2.evt file, extra rows are filled as -1
| Pixel properties | Quadrant properties | ||||||
|---|---|---|---|---|---|---|---|
| Quadrant | DetID | PixID | Counts | Sigma | Mean | Median | Sigma |
| A | 3 | 63 | 6519614 | 37831.17 | 703 | 687 | 172.3 |
| A | 15 | 174 | 1251093 | 7256.46 | 703 | 687 | 172.3 |
| A | 3 | 62 | 608705 | 3528.5 | 703 | 687 | 172.3 |
| B | 2 | 249 | 1943465 | 11663.73 | 782 | 754 | 166.6 |
| B | 0 | 213 | 415244 | 2488.53 | 782 | 754 | 166.6 |
| B | 10 | 254 | 370835 | 2221.91 | 782 | 754 | 166.6 |
| C | 7 | 64 | 11078933 | 87378.92 | 461 | 456 | 126.8 |
| C | 15 | 224 | 1164614 | 9182.03 | 461 | 456 | 126.8 |
| C | 9 | 38 | 518423 | 4085.34 | 461 | 456 | 126.8 |
| D | 3 | 12 | 280504 | 1227.01 | 797 | 763 | 228.0 |
| D | 7 | 70 | 102650 | 446.9 | 797 | 763 | 228.0 |
| D | 2 | 249 | 97301 | 423.44 | 797 | 763 | 228.0 |
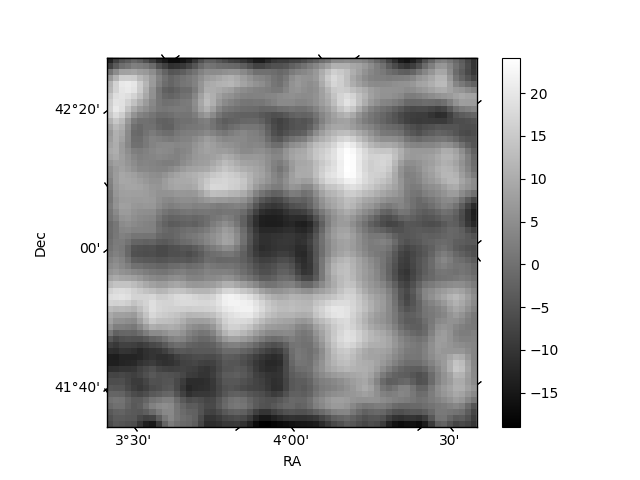
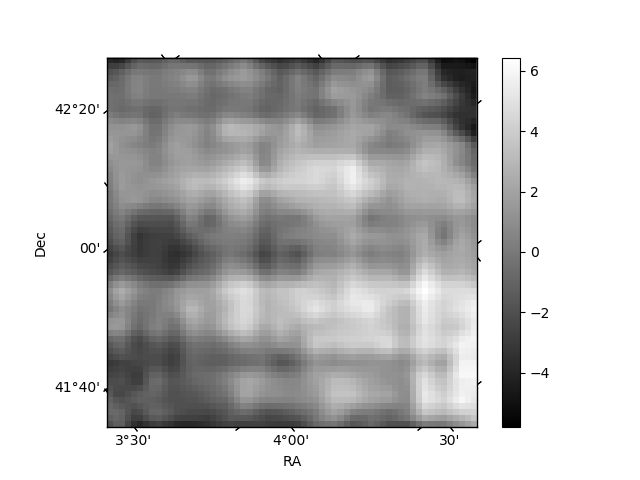
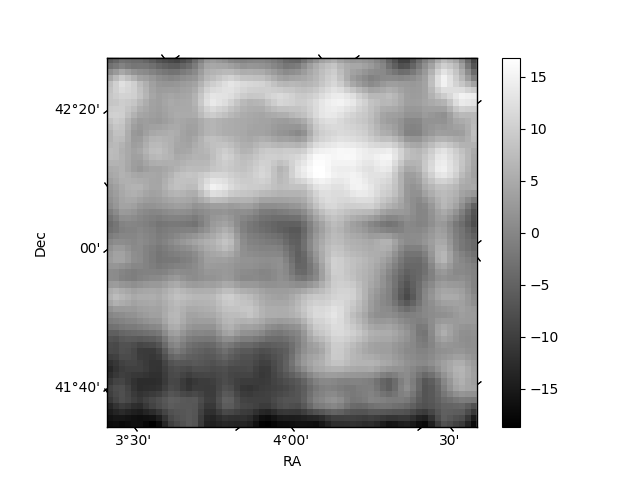
Histogram calculated using DETX and DETY for each event in the final _common_clean file
| Quadrant A | 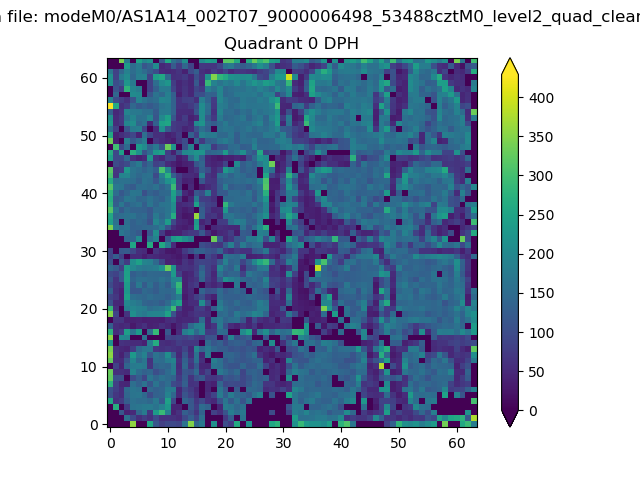 |
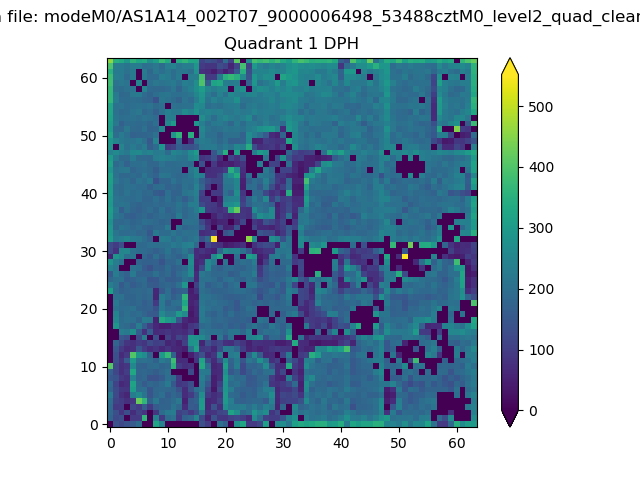 |
Quadrant B |
|---|---|---|---|
| Quadrant D | 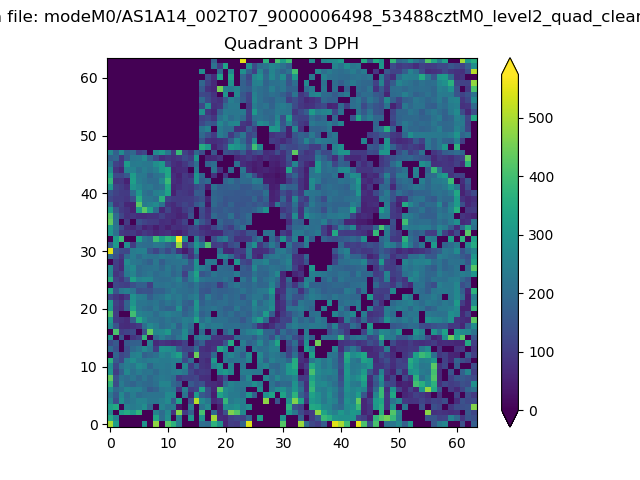 |
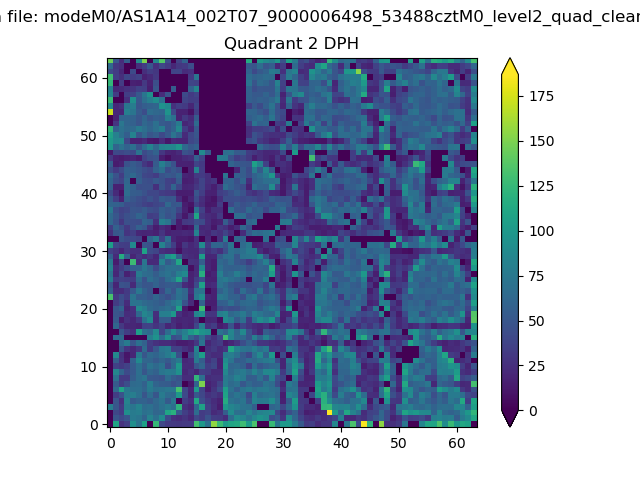 |
Quadrant C |
| Plot type | Count rate plots | Images |
|---|---|---|
| Comparison with Poisson distribution Blue bars denote a histogram of data divided into 1 sec bins. Red curve is a Poisson curve with rate = median count rate of data. |
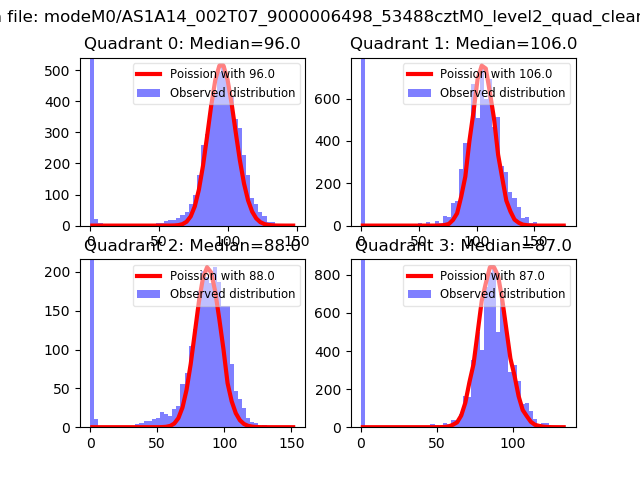 |
 |
| Quadrant-wise count rates Data is divided into 100 sec bins |
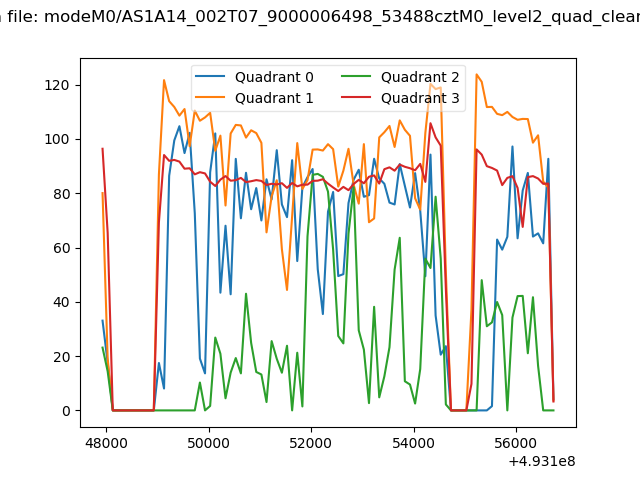 |
|
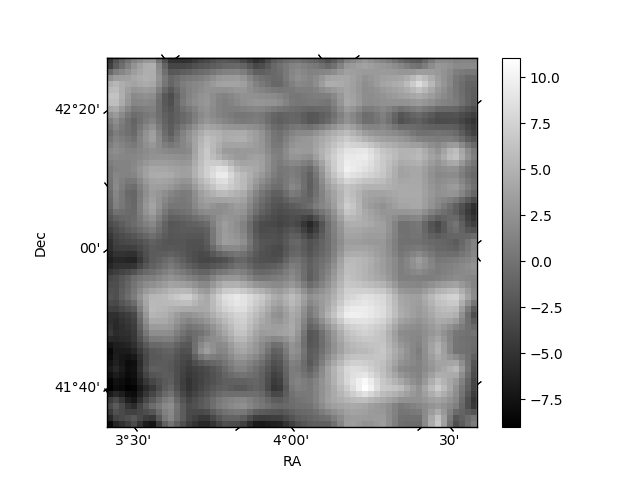
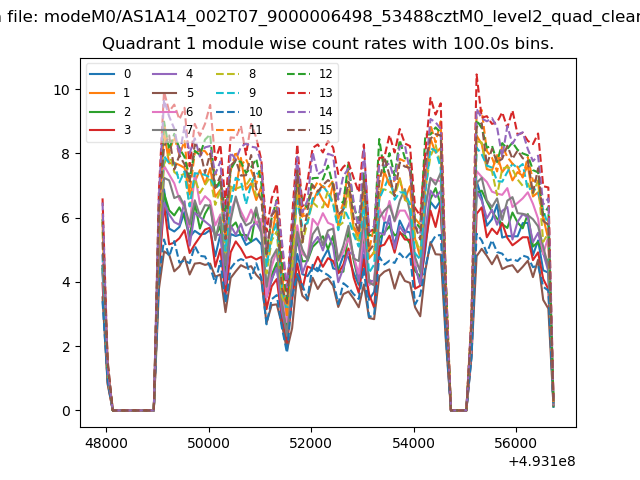
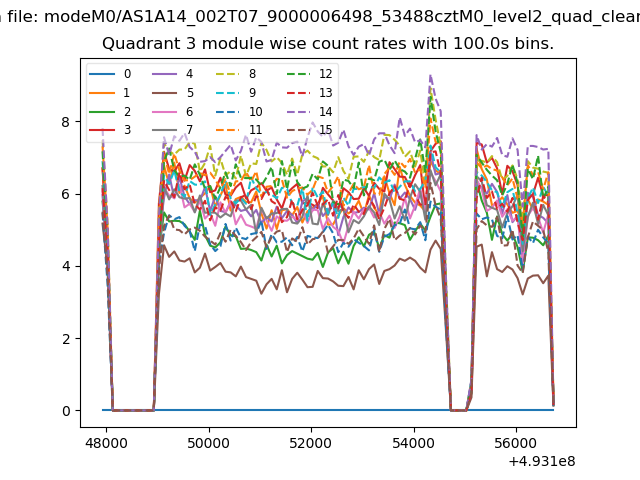
| Module-wise count rates for Quadrant A Data is divided into 100 sec bins |
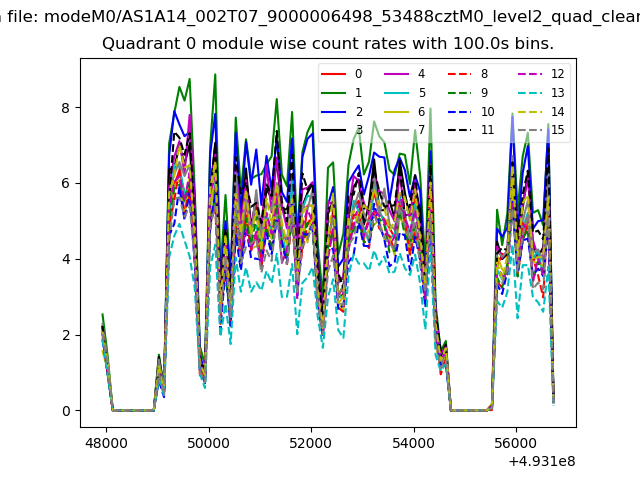 |
 |
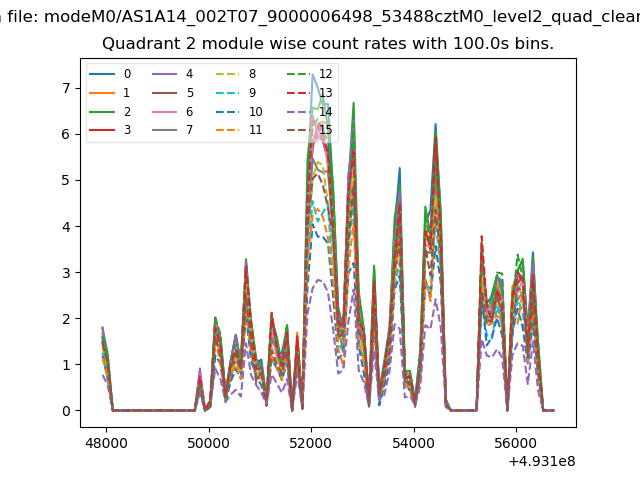
| Module-wise count rates for Quadrant B Data is divided into 100 sec bins |
 |
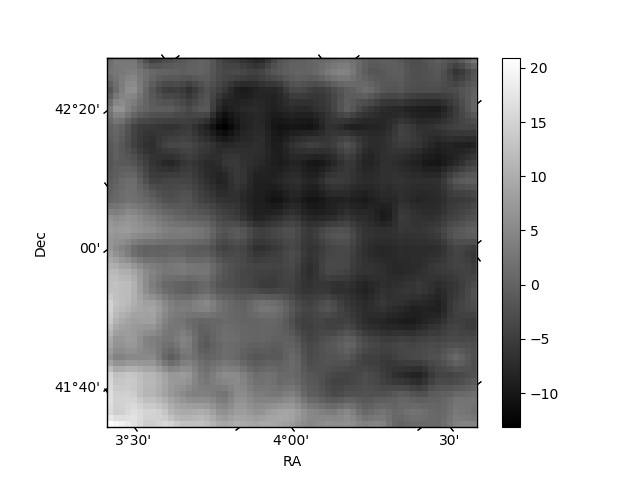 |
| Module-wise count rates for Quadrant C Data is divided into 100 sec bins |
 |
 |
| Module-wise count rates for Quadrant D Data is divided into 100 sec bins |
 |
 |
| Parameter | Plot |
|---|---|
| CZT HV Monitor | 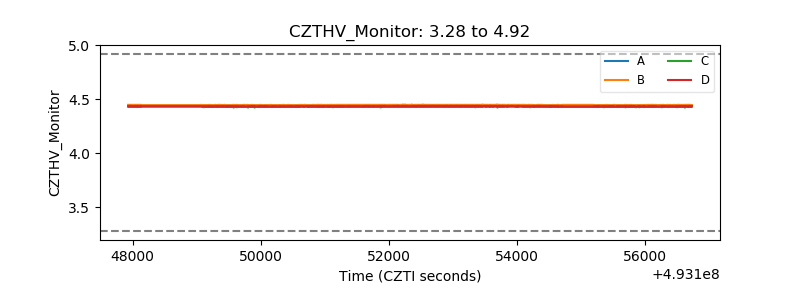 |
| D_VDD | 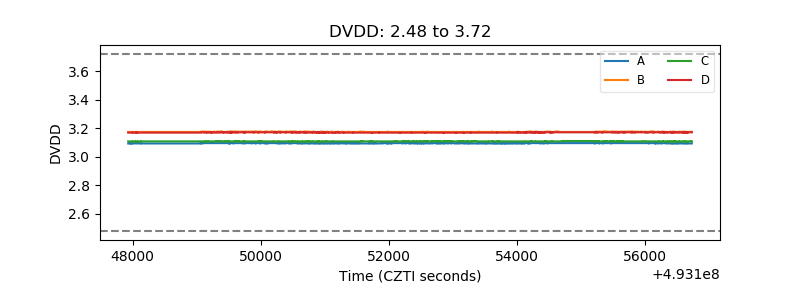 |
| Temperature 1 | 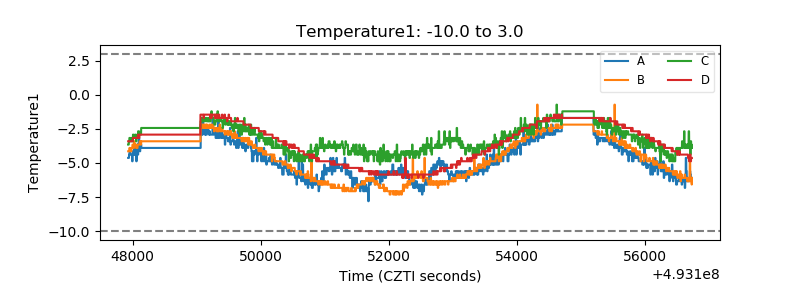 |
| Veto HV Monitor | 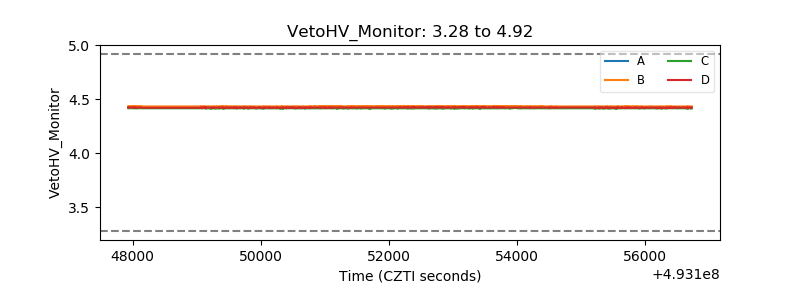 |
| Veto LLD | 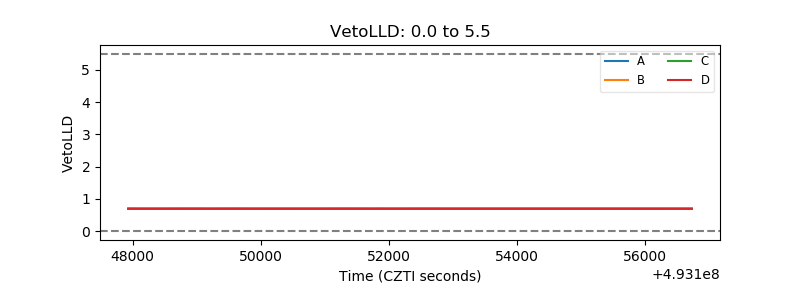 |
| Alpha Counter | 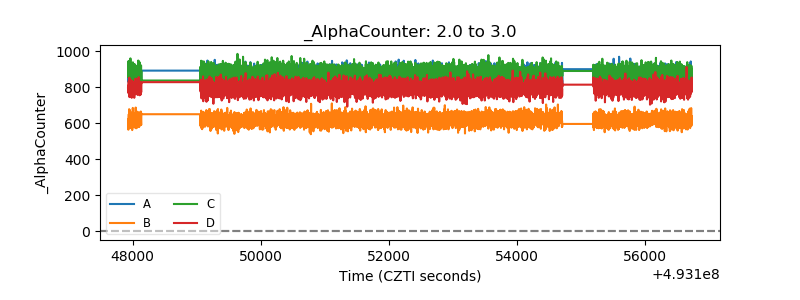 |
| _CPM_Rate | 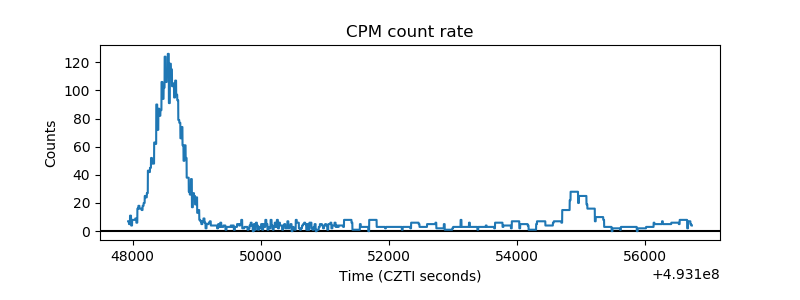 |
| CZT Counter | 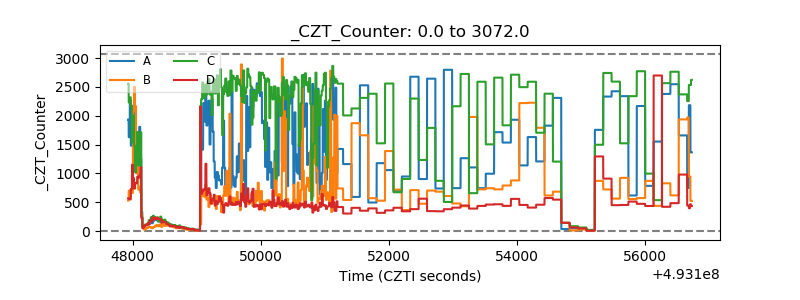 |
| +2.5 Volts monitor |  |
| +5 Volts monitor |  |
| _ROLL_ROT | 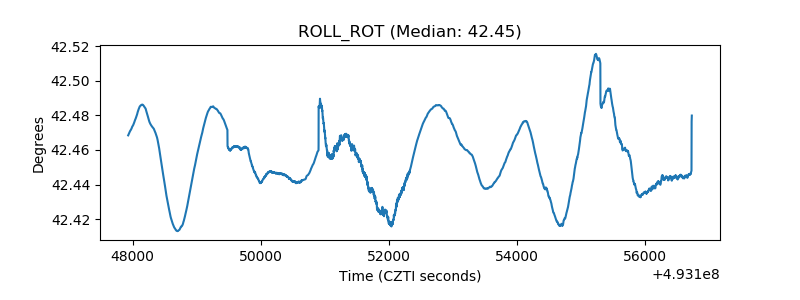 |
| _Roll_DEC | 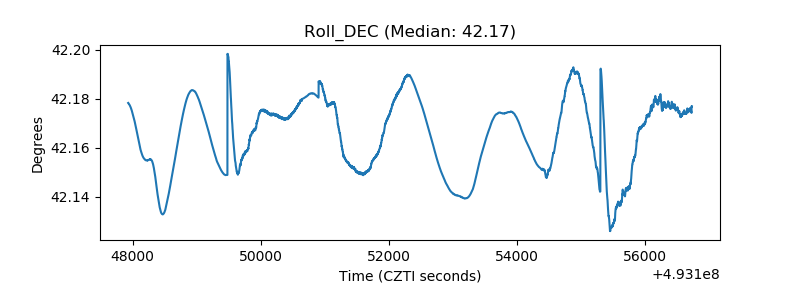 |
| _Roll_RA | 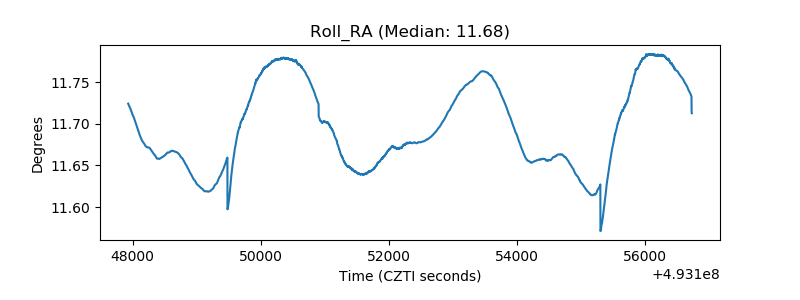 |
| Veto Counter | 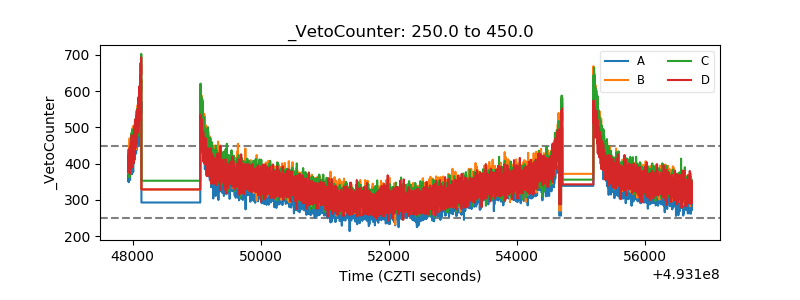 |