| Param | Original file | Final file |
|---|---|---|
| Filename | modeM0/AS1A14_002T07_9000006498_53489cztM0_level2.fits | modeM0/AS1A14_002T07_9000006498_53489cztM0_level2_quad_clean.evt |
| Size (bytes) | 1,186,107,840 | 85,800,960 |
| Size | 1.1 GB | 81.8 MB |
| Events in quadrant A | 12,173,079 | 513,372 |
| Events in quadrant B | 9,106,169 | 704,456 |
| Events in quadrant C | 17,985,622 | 159,970 |
| Events in quadrant D | 4,036,433 | 674,663 |
| Mode SS | |||
|---|---|---|---|
| Quadrant | BADHDUFLAG | Total packets | Discarded packets |
| A | 0 | 160 | 0 |
| B | 0 | 160 | 0 |
| C | 0 | 160 | 0 |
| D | 0 | 160 | 0 |
| Mode M9 | |||
|---|---|---|---|
| Quadrant | BADHDUFLAG | Total packets | Discarded packets |
| A | 0 | 3 | 0 |
| B | 0 | 4 | 0 |
| C | 0 | 4 | 0 |
| D | 0 | 4 | 0 |
| Mode M0 | |||
|---|---|---|---|
| Quadrant | BADHDUFLAG | Total packets | Discarded packets |
| A | 0 | 41681 | 2 |
| B | 0 | 32491 | 1 |
| C | 0 | 58816 | 1 |
| D | 0 | 17768 | 1 |
| Quadrant | Total seconds | Saturated seconds | Saturation percentage |
|---|---|---|---|
| A | 7833 | 2894 | 36.946253% |
| B | 7833 | 1630 | 20.809396% |
| C | 7833 | 6351 | 81.080046% |
| D | 7833 | 131 | 1.672412% |
Noise dominated data is calculated using 1-second bins in cleaned event files. If a bin has >2000 counts, and if more than 50% of those come from <1% of pixels, then it is considered to be noise-dominated and hence unusable.
| Quadrant | # 1 sec bins | Bins with >0 counts | Bins with >2000 counts | High rate bins dominated by noise | Noise dominated (total time) | Noise dominated (detector-on time) | Marked lightcurve |
|---|---|---|---|---|---|---|---|
| A | 7832 | 7832 | 2648 | 2648 | 33.81% | 33.81% | 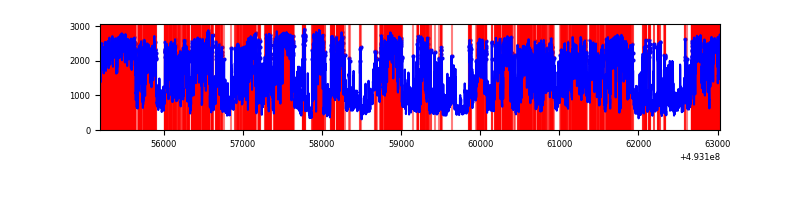 |
| B | 7833 | 7833 | 1341 | 1341 | 17.12% | 17.12% | 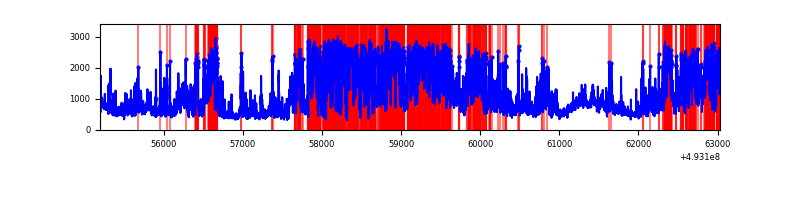 |
| C | 7833 | 7833 | 6239 | 6239 | 79.65% | 79.65% | 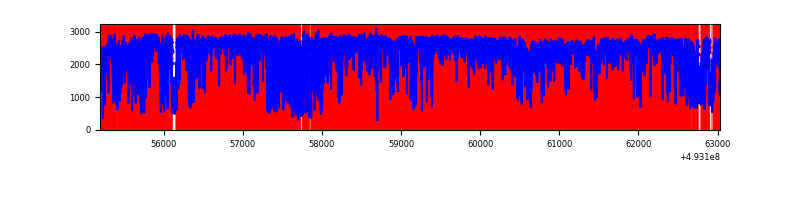 |
| D | 7833 | 7833 | 96 | 96 | 1.23% | 1.23% | 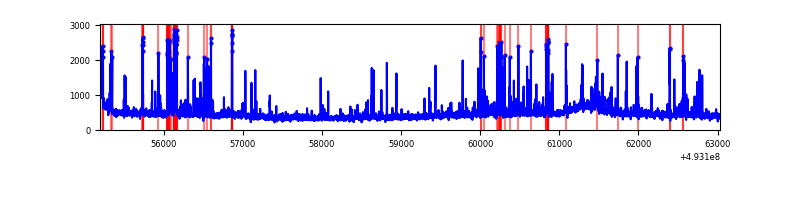 |
Top three noisy pixels from each quadrant. If the there are fewer than three noisy pixels in the level2.evt file, extra rows are filled as -1
| Pixel properties | Quadrant properties | ||||||
|---|---|---|---|---|---|---|---|
| Quadrant | DetID | PixID | Counts | Sigma | Mean | Median | Sigma |
| A | 3 | 63 | 6595238 | 36303.95 | 738 | 719 | 181.6 |
| A | 15 | 174 | 1236115 | 6801.06 | 738 | 719 | 181.6 |
| A | 3 | 62 | 771988 | 4245.97 | 738 | 719 | 181.6 |
| B | 2 | 249 | 3594473 | 20942.65 | 803 | 774 | 171.6 |
| B | 10 | 254 | 1381903 | 8048.67 | 803 | 774 | 171.6 |
| B | 10 | 28 | 235711 | 1369.12 | 803 | 774 | 171.6 |
| C | 7 | 64 | 13591274 | 114486.6 | 426 | 422 | 118.7 |
| C | 15 | 224 | 1476689 | 12435.78 | 426 | 422 | 118.7 |
| C | 1 | 241 | 404686 | 3405.44 | 426 | 422 | 118.7 |
| D | 3 | 12 | 249169 | 1035.89 | 840 | 801 | 239.8 |
| D | 13 | 153 | 125549 | 520.3 | 840 | 801 | 239.8 |
| D | 7 | 70 | 82565 | 341.02 | 840 | 801 | 239.8 |
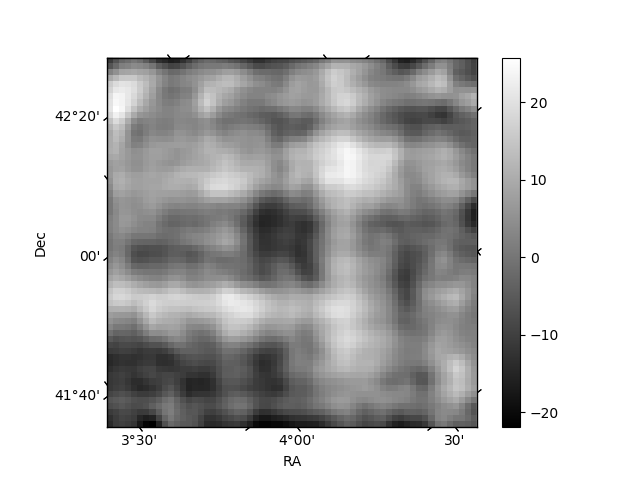
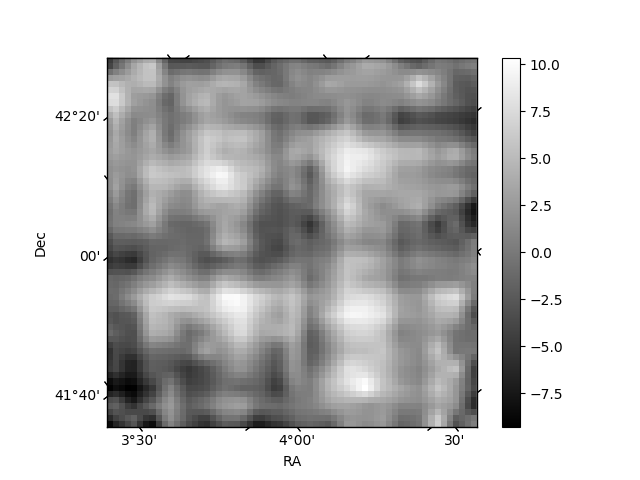
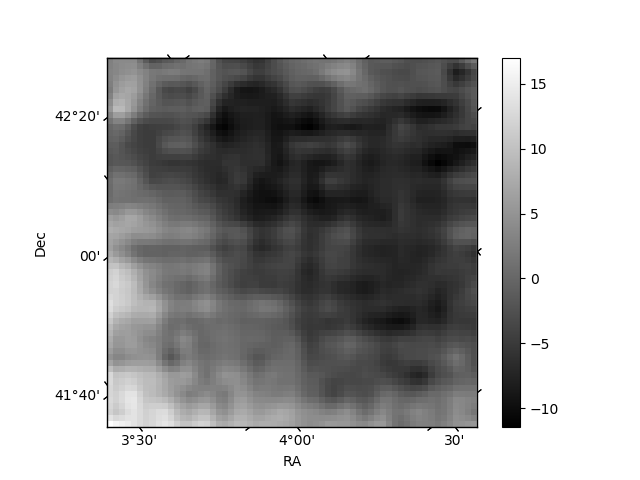
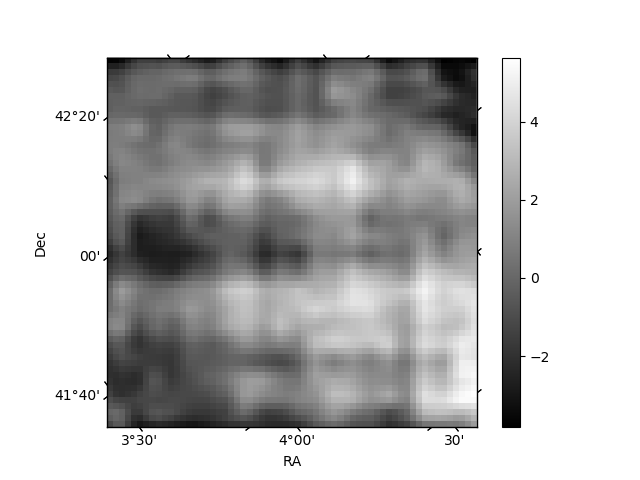
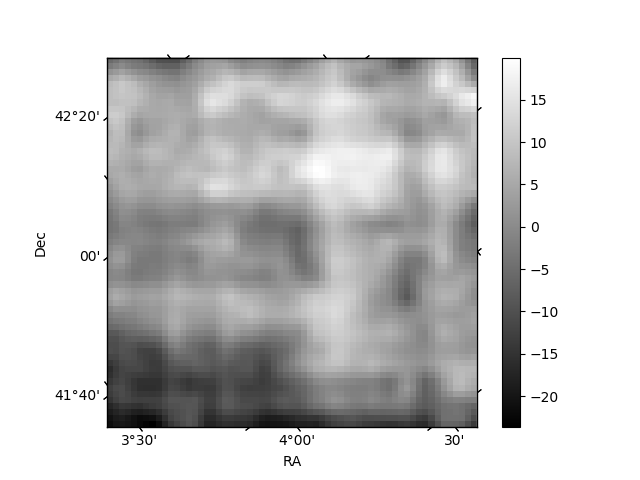
Histogram calculated using DETX and DETY for each event in the final _common_clean file
| Quadrant A | 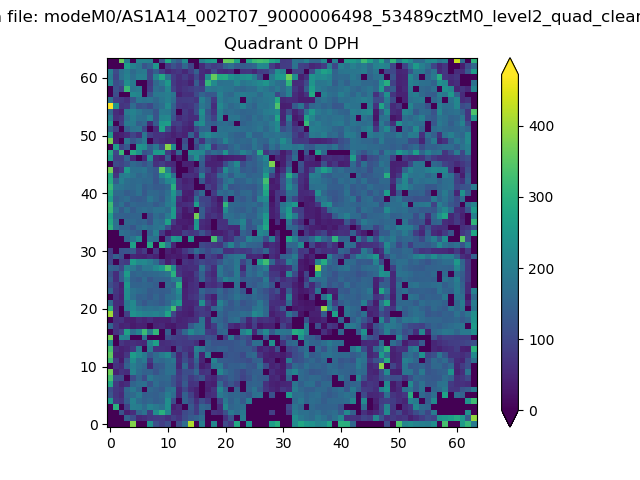 |
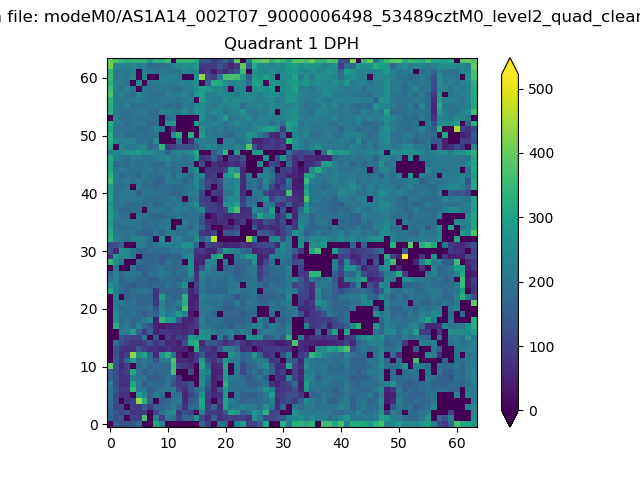 |
Quadrant B |
|---|---|---|---|
| Quadrant D | 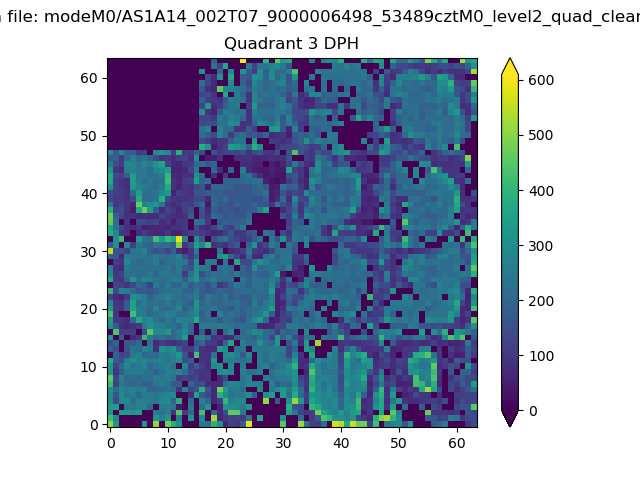 |
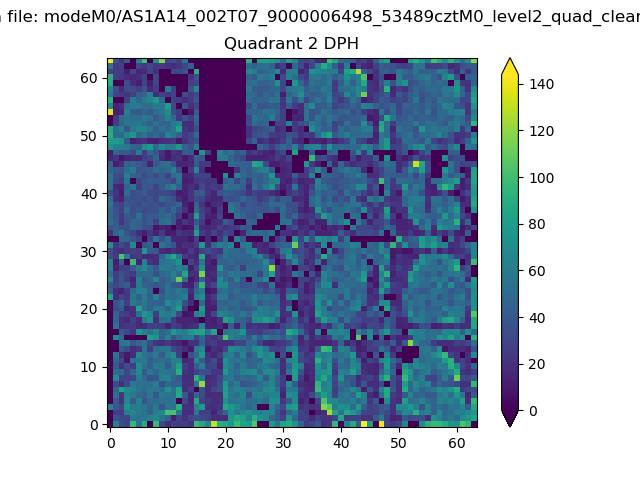 |
Quadrant C |
| Plot type | Count rate plots | Images |
|---|---|---|
| Comparison with Poisson distribution Blue bars denote a histogram of data divided into 1 sec bins. Red curve is a Poisson curve with rate = median count rate of data. |
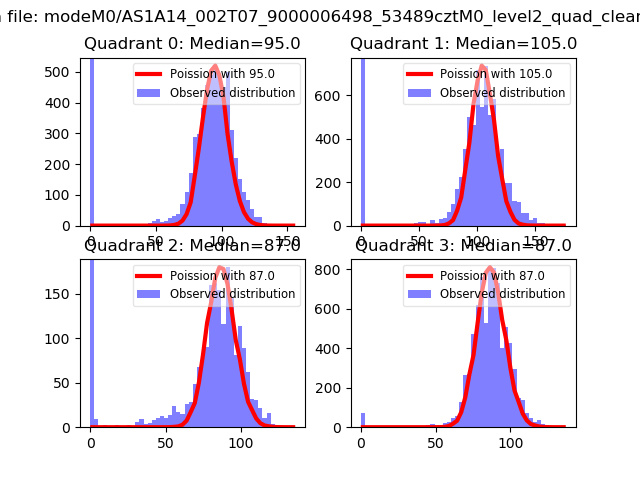 |
 |
| Quadrant-wise count rates Data is divided into 100 sec bins |
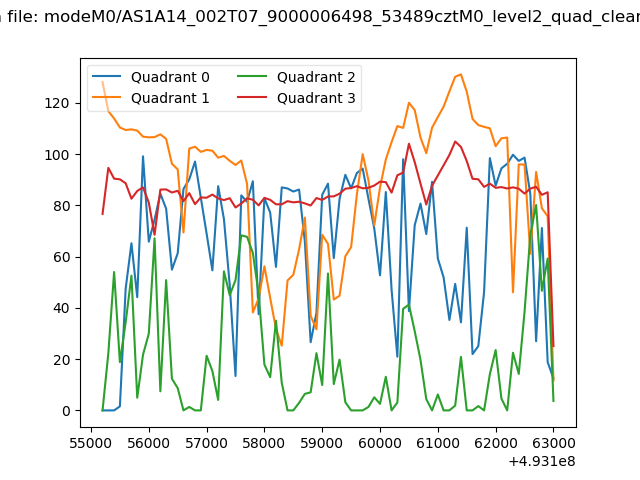 |
|
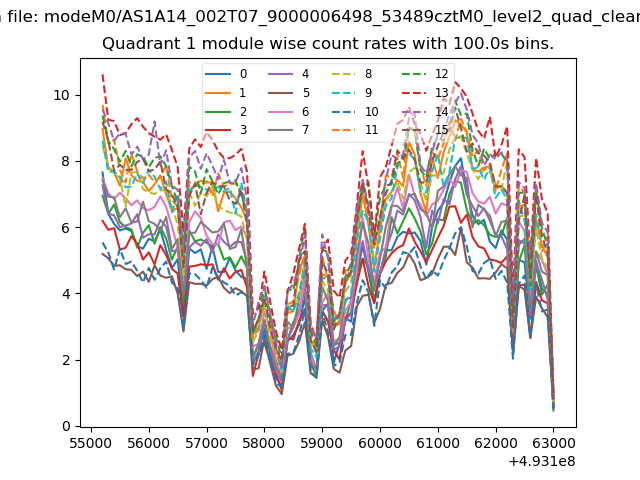
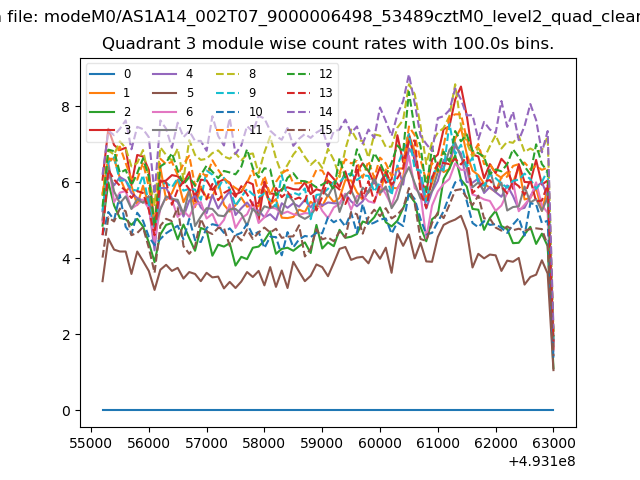
| Module-wise count rates for Quadrant A Data is divided into 100 sec bins |
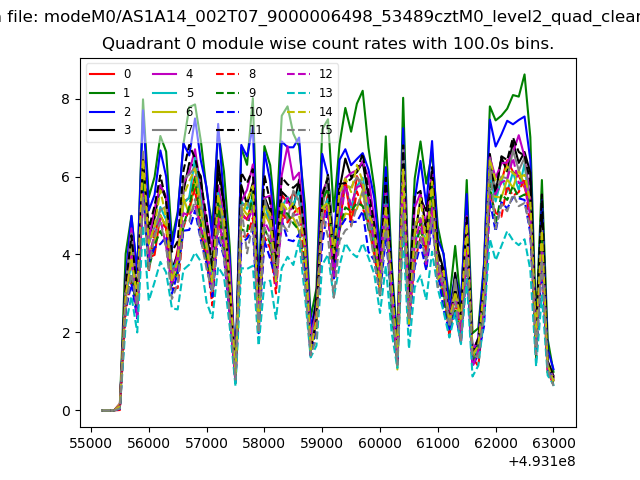 |
 |
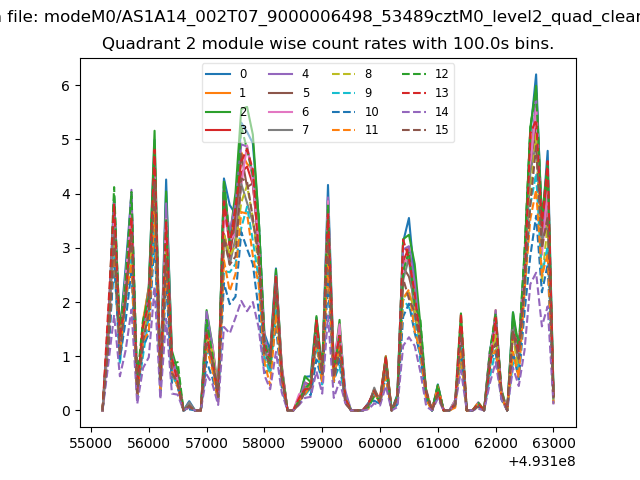
| Module-wise count rates for Quadrant B Data is divided into 100 sec bins |
 |
 |
| Module-wise count rates for Quadrant C Data is divided into 100 sec bins |
 |
 |
| Module-wise count rates for Quadrant D Data is divided into 100 sec bins |
 |
 |
| Parameter | Plot |
|---|---|
| CZT HV Monitor | 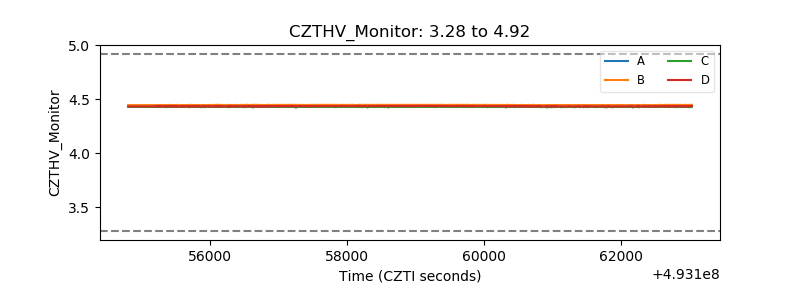 |
| D_VDD | 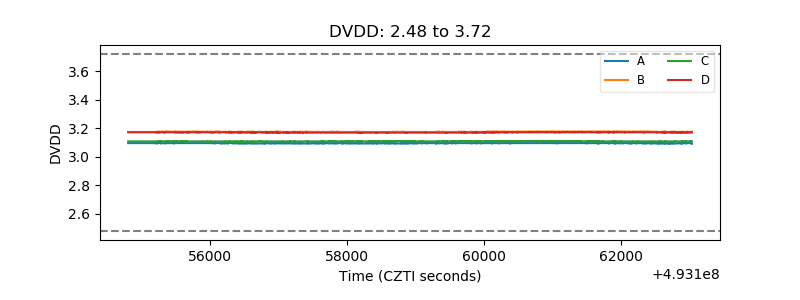 |
| Temperature 1 | 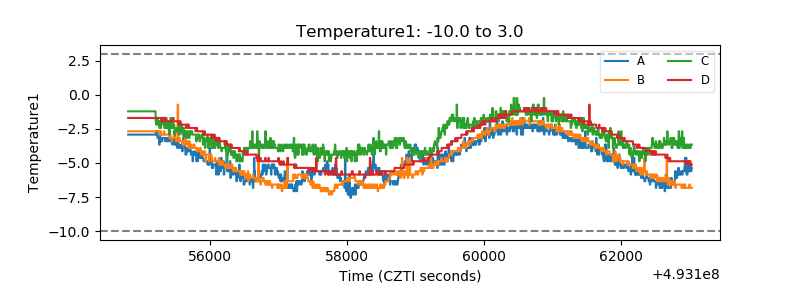 |
| Veto HV Monitor | 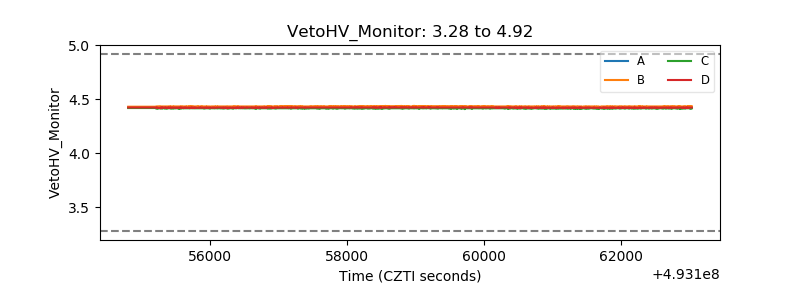 |
| Veto LLD | 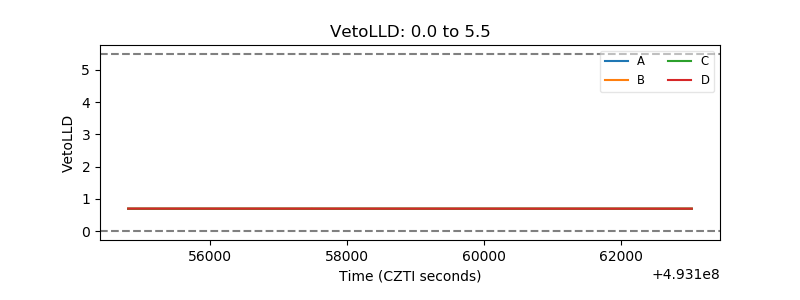 |
| Alpha Counter | 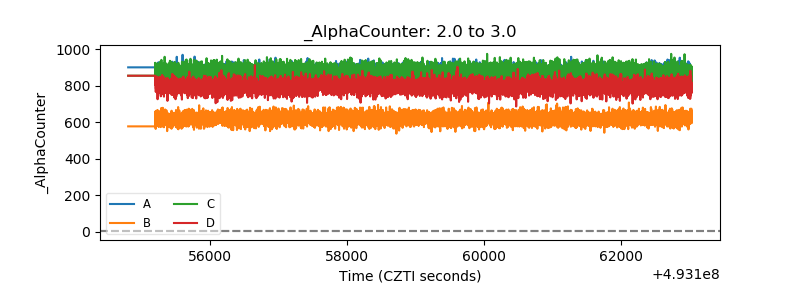 |
| _CPM_Rate | 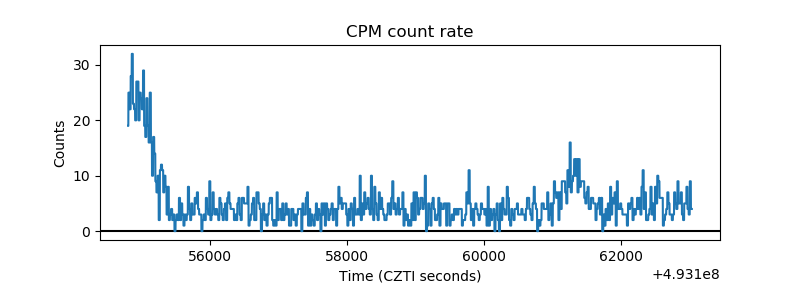 |
| CZT Counter | 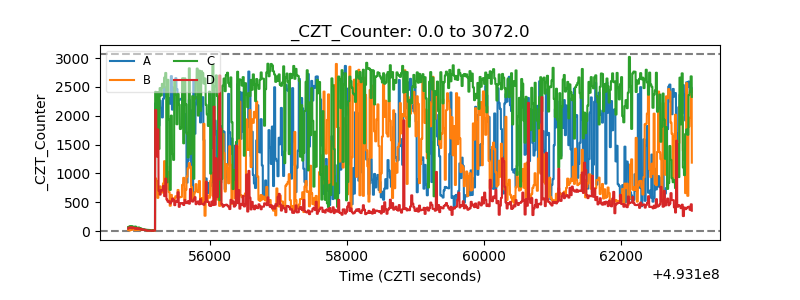 |
| +2.5 Volts monitor | 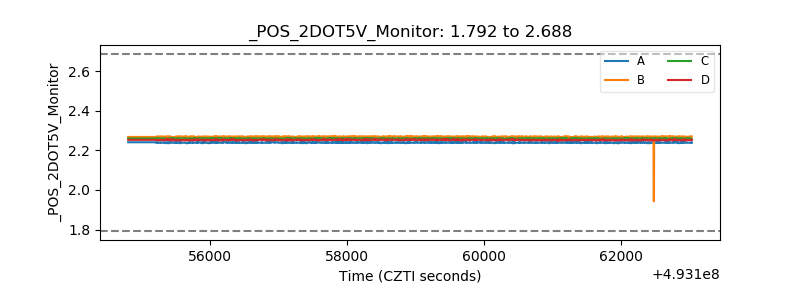 |
| +5 Volts monitor | 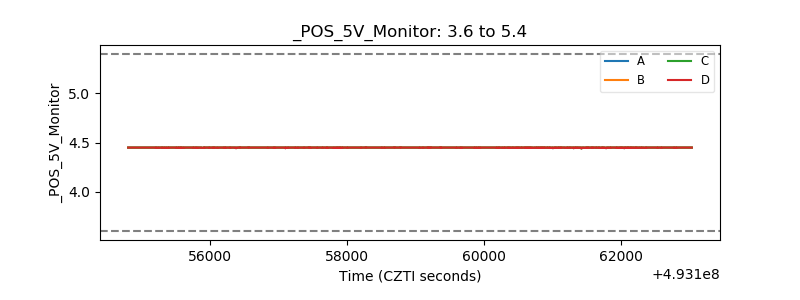 |
| _ROLL_ROT | 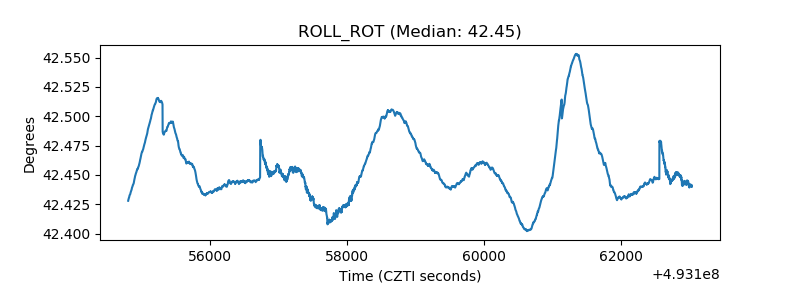 |
| _Roll_DEC | 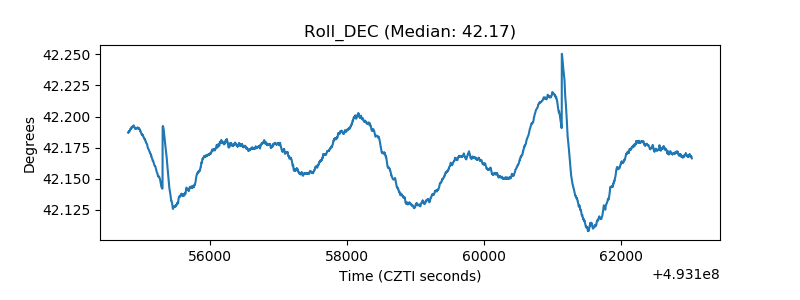 |
| _Roll_RA | 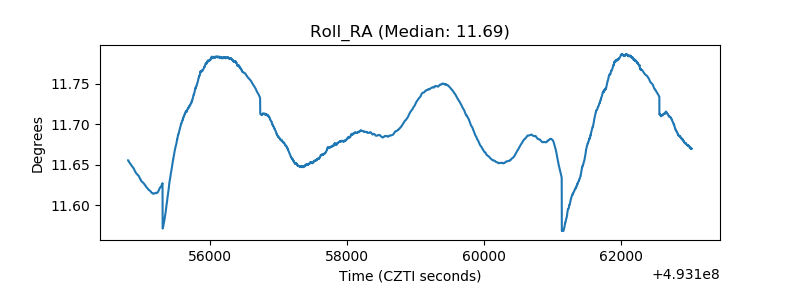 |
| Veto Counter | 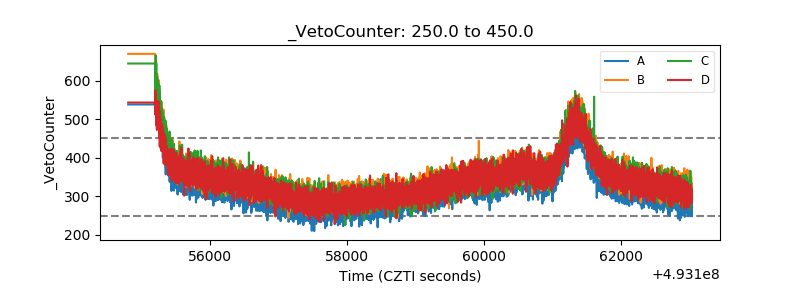 |