| Param | Original file | Final file |
|---|---|---|
| Filename | modeM0/AS1A14_002T07_9000006498_53490cztM0_level2.fits | modeM0/AS1A14_002T07_9000006498_53490cztM0_level2_quad_clean.evt |
| Size (bytes) | 1,271,056,320 | 75,945,600 |
| Size | 1.2 GB | 72.4 MB |
| Events in quadrant A | 12,040,026 | 509,085 |
| Events in quadrant B | 12,811,369 | 461,242 |
| Events in quadrant C | 17,855,366 | 145,103 |
| Events in quadrant D | 3,757,555 | 654,291 |
| Mode SS | |||
|---|---|---|---|
| Quadrant | BADHDUFLAG | Total packets | Discarded packets |
| A | 0 | 152 | 0 |
| B | 0 | 152 | 0 |
| C | 0 | 152 | 0 |
| D | 0 | 152 | 0 |
| Mode M0 | |||
|---|---|---|---|
| Quadrant | BADHDUFLAG | Total packets | Discarded packets |
| A | 0 | 41068 | 0 |
| B | 0 | 43257 | 0 |
| C | 0 | 58309 | 0 |
| D | 0 | 16742 | 0 |
| Quadrant | Total seconds | Saturated seconds | Saturation percentage |
|---|---|---|---|
| A | 7607 | 2769 | 36.400684% |
| B | 7607 | 3587 | 47.153937% |
| C | 7608 | 6218 | 81.729758% |
| D | 7608 | 44 | 0.578339% |
Noise dominated data is calculated using 1-second bins in cleaned event files. If a bin has >2000 counts, and if more than 50% of those come from <1% of pixels, then it is considered to be noise-dominated and hence unusable.
| Quadrant | # 1 sec bins | Bins with >0 counts | Bins with >2000 counts | High rate bins dominated by noise | Noise dominated (total time) | Noise dominated (detector-on time) | Marked lightcurve |
|---|---|---|---|---|---|---|---|
| A | 7606 | 7606 | 2644 | 2644 | 34.76% | 34.76% | 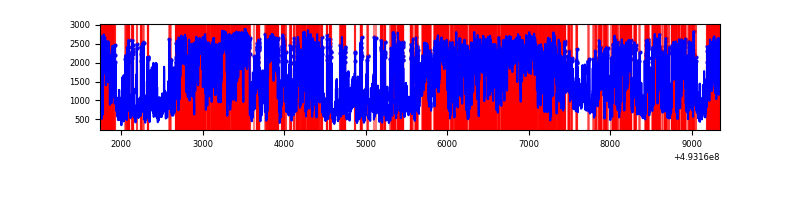 |
| B | 7607 | 7607 | 3191 | 3191 | 41.95% | 41.95% | 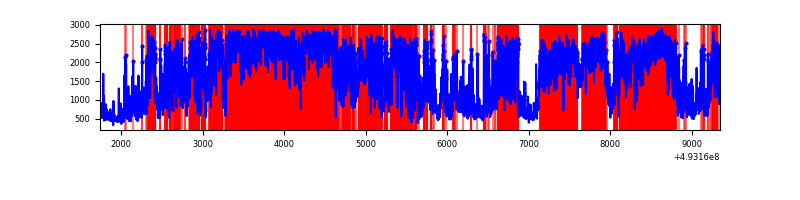 |
| C | 7607 | 7607 | 6266 | 6266 | 82.37% | 82.37% | 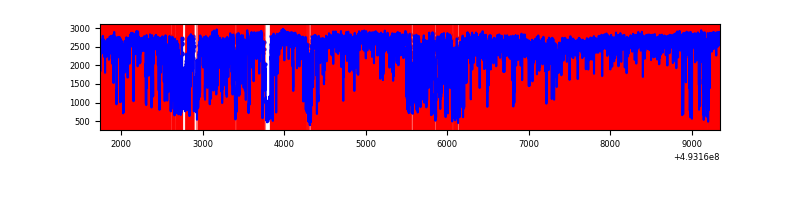 |
| D | 7608 | 7608 | 53 | 53 | 0.70% | 0.70% | 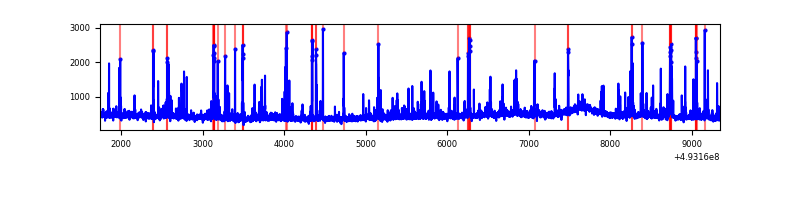 |
Top three noisy pixels from each quadrant. If the there are fewer than three noisy pixels in the level2.evt file, extra rows are filled as -1
| Pixel properties | Quadrant properties | ||||||
|---|---|---|---|---|---|---|---|
| Quadrant | DetID | PixID | Counts | Sigma | Mean | Median | Sigma |
| A | 3 | 63 | 4914248 | 27617.51 | 716 | 699 | 177.9 |
| A | 3 | 62 | 3068819 | 17244.93 | 716 | 699 | 177.9 |
| A | 15 | 174 | 701391 | 3938.37 | 716 | 699 | 177.9 |
| B | 2 | 249 | 6374984 | 44933.49 | 664 | 641 | 141.9 |
| B | 10 | 254 | 3140551 | 22133.59 | 664 | 641 | 141.9 |
| B | 4 | 171 | 173821 | 1220.77 | 664 | 641 | 141.9 |
| C | 7 | 64 | 12830203 | 123446.74 | 376 | 373 | 103.9 |
| C | 15 | 224 | 1706253 | 16413.73 | 376 | 373 | 103.9 |
| C | 1 | 241 | 903349 | 8688.3 | 376 | 373 | 103.9 |
| D | 1 | 0 | 185419 | 824.51 | 794 | 759 | 224.0 |
| D | 3 | 12 | 97633 | 432.54 | 794 | 759 | 224.0 |
| D | 7 | 70 | 76092 | 336.36 | 794 | 759 | 224.0 |
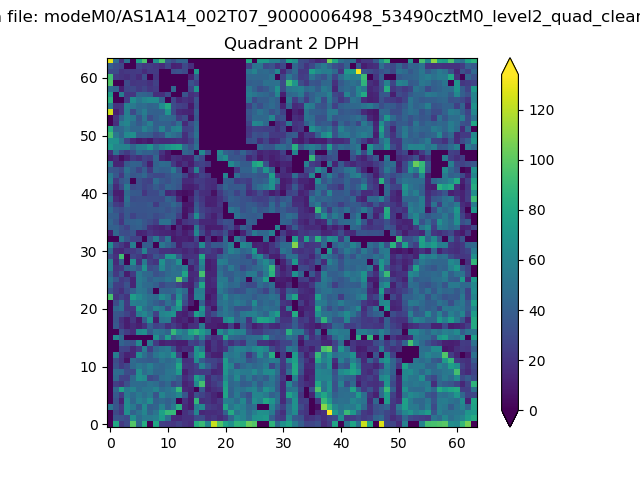
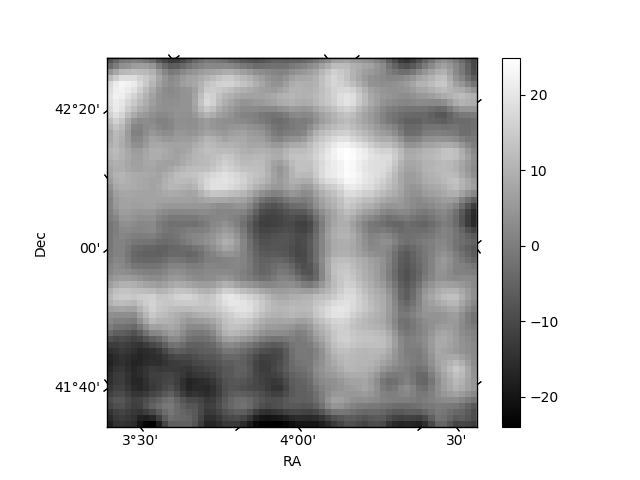
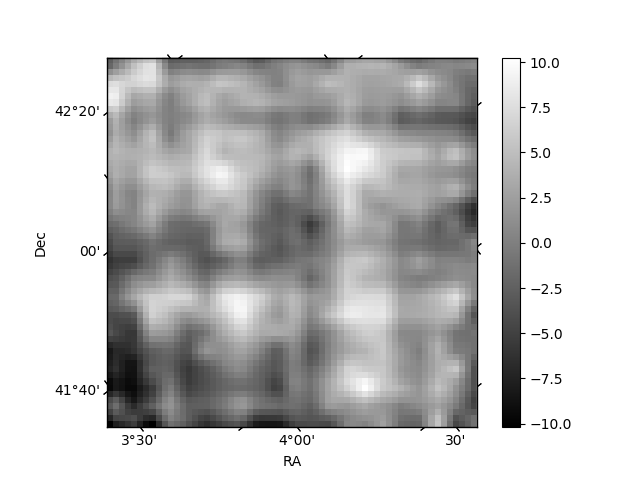
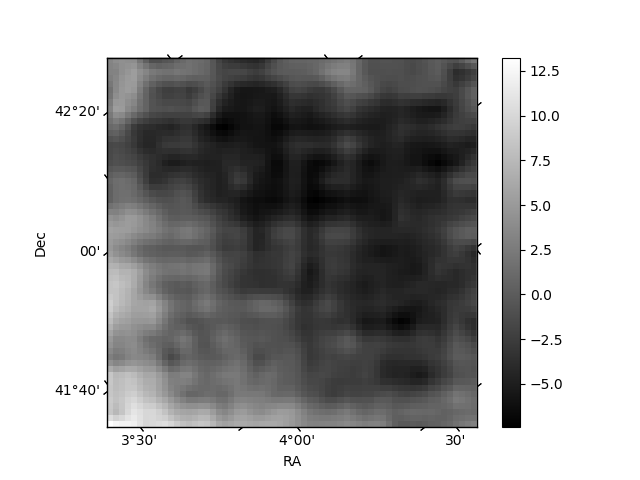
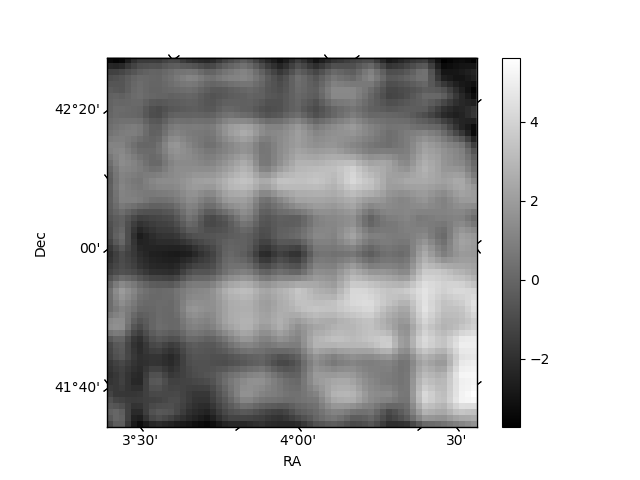
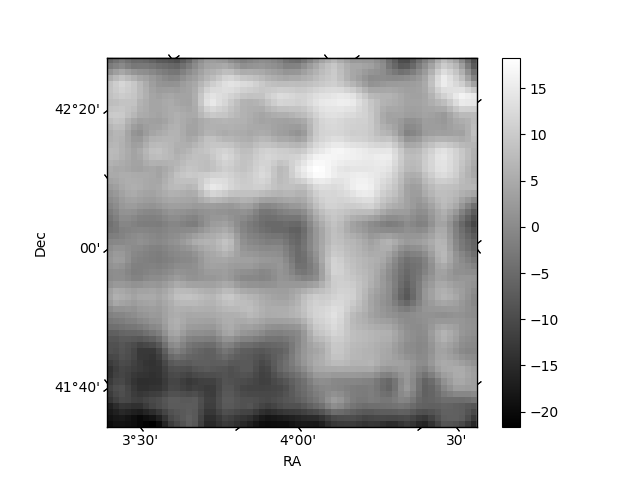
Histogram calculated using DETX and DETY for each event in the final _common_clean file
| Quadrant A | 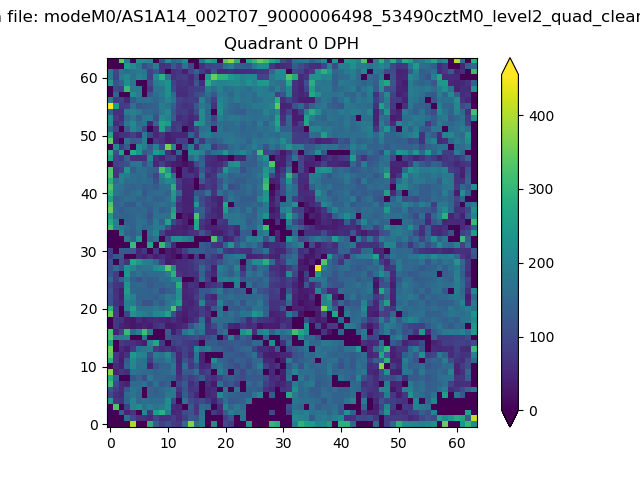 |
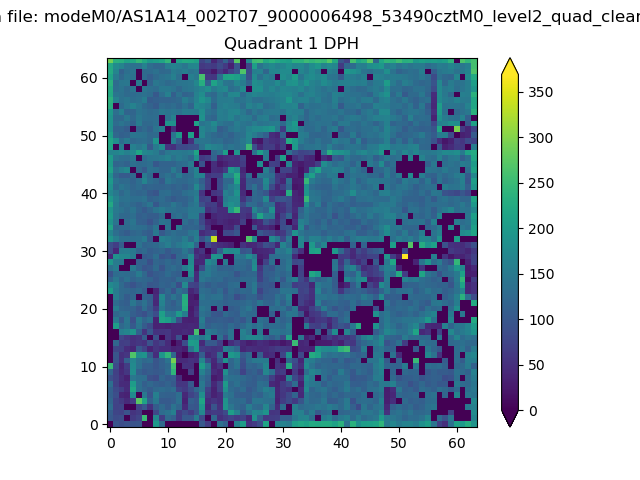 |
Quadrant B |
|---|---|---|---|
| Quadrant D | 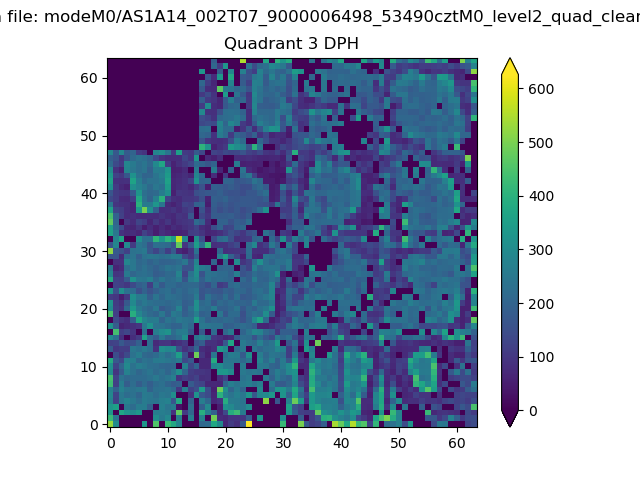 |
 |
Quadrant C |
| Plot type | Count rate plots | Images |
|---|---|---|
| Comparison with Poisson distribution Blue bars denote a histogram of data divided into 1 sec bins. Red curve is a Poisson curve with rate = median count rate of data. |
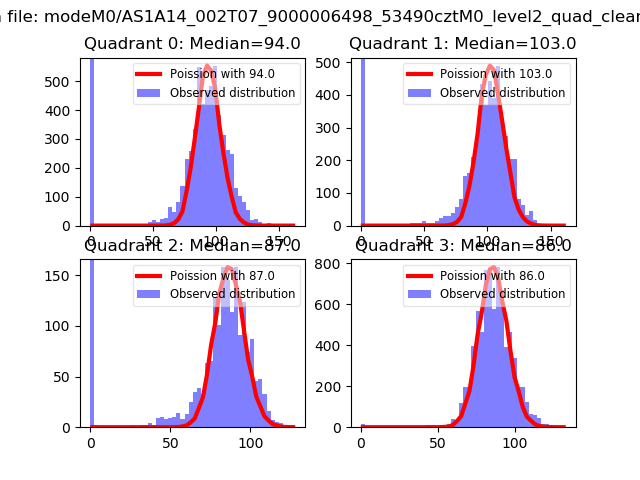 |
 |
| Quadrant-wise count rates Data is divided into 100 sec bins |
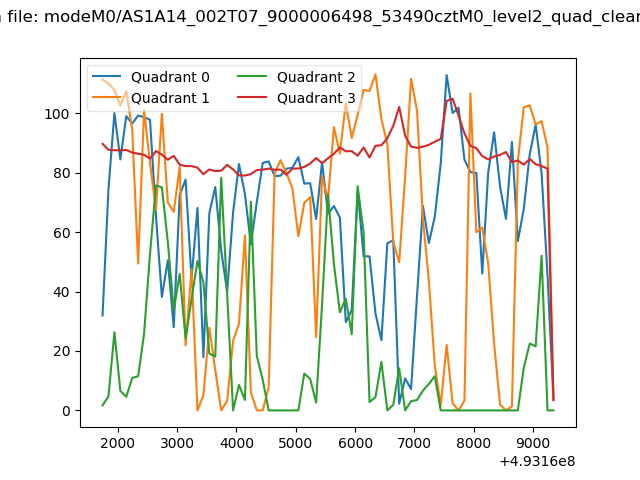 |
|
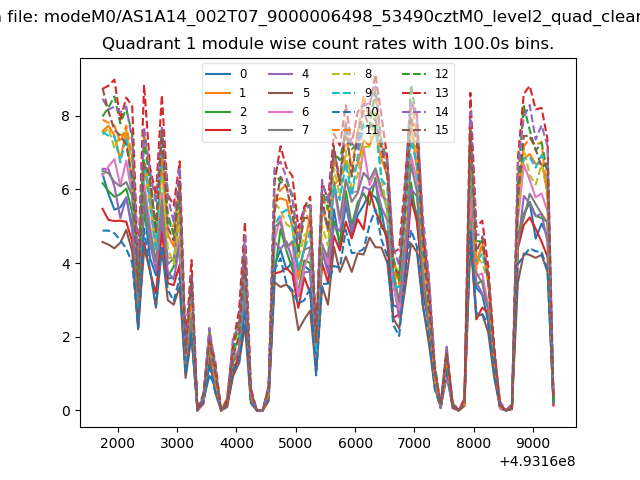
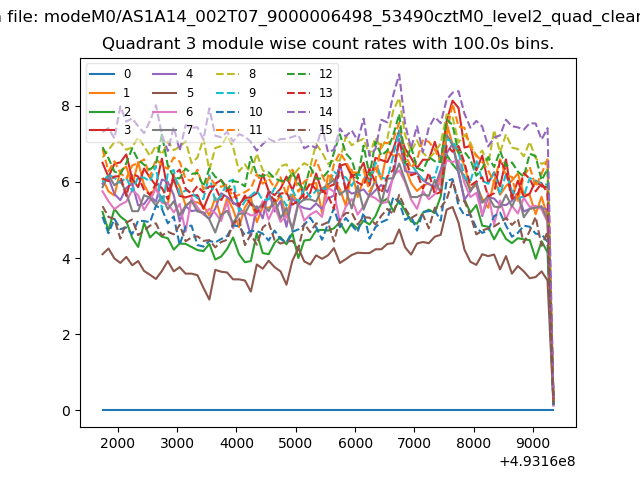
| Module-wise count rates for Quadrant A Data is divided into 100 sec bins |
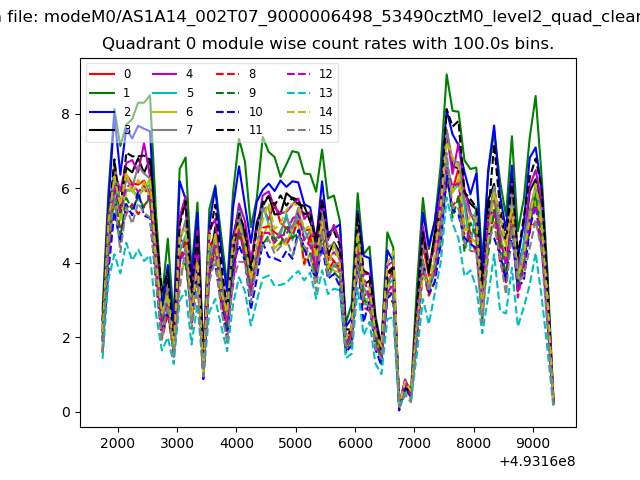 |
 |
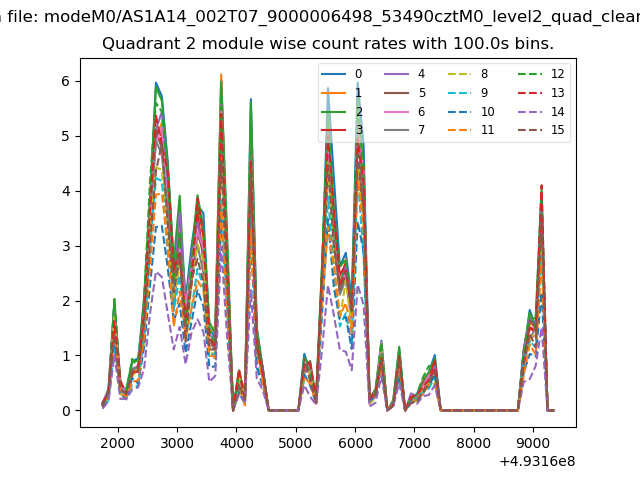
| Module-wise count rates for Quadrant B Data is divided into 100 sec bins |
 |
 |
| Module-wise count rates for Quadrant C Data is divided into 100 sec bins |
 |
 |
| Module-wise count rates for Quadrant D Data is divided into 100 sec bins |
 |
 |
| Parameter | Plot |
|---|---|
| CZT HV Monitor |  |
| D_VDD | 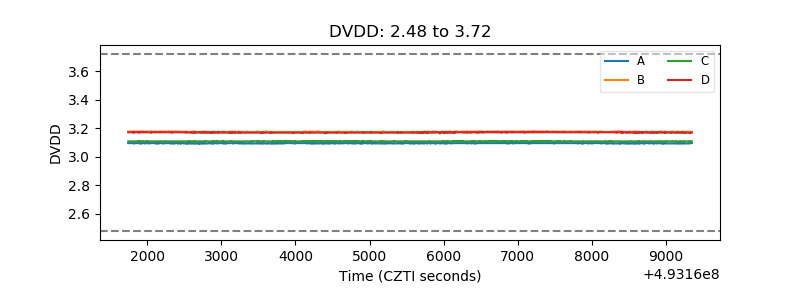 |
| Temperature 1 | 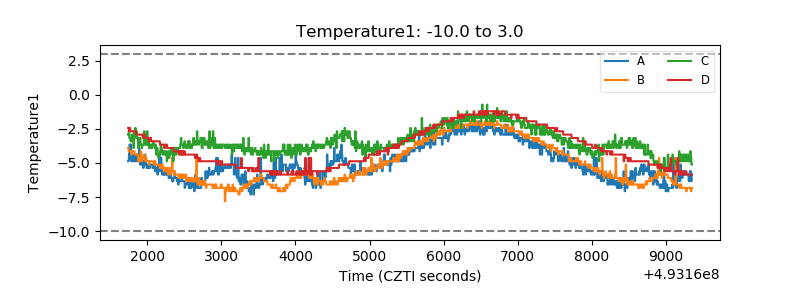 |
| Veto HV Monitor |  |
| Veto LLD | 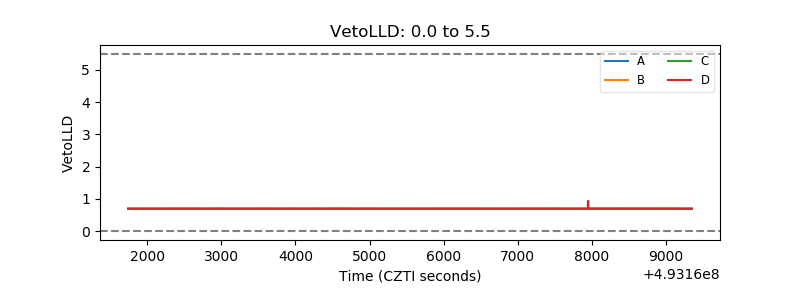 |
| Alpha Counter | 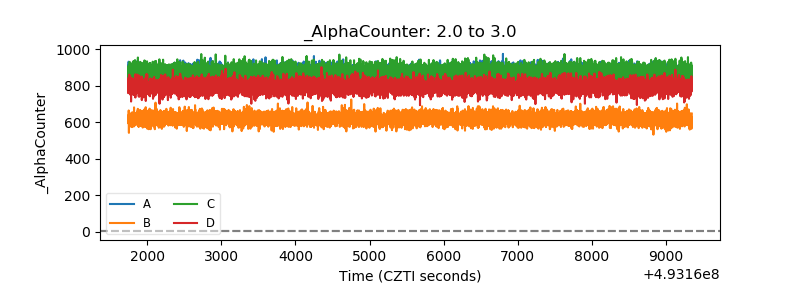 |
| _CPM_Rate | 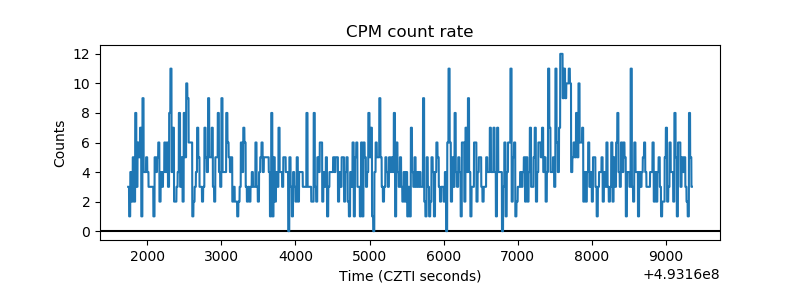 |
| CZT Counter | 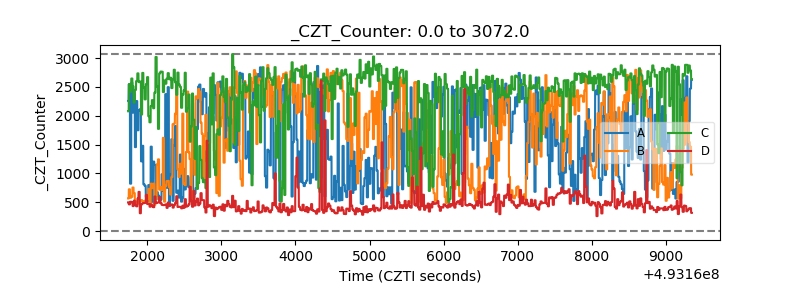 |
| +2.5 Volts monitor | 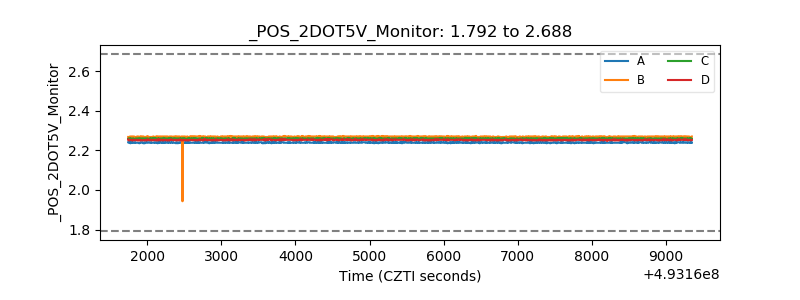 |
| +5 Volts monitor | 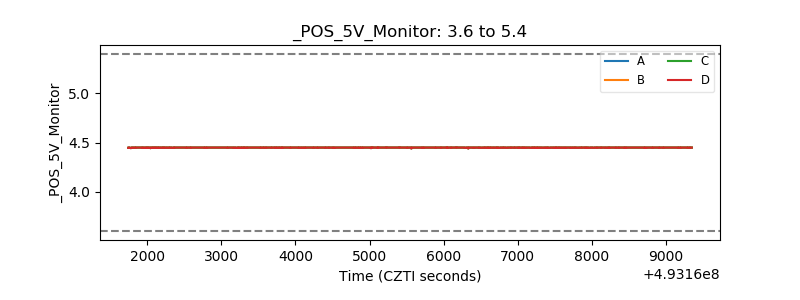 |
| _ROLL_ROT | 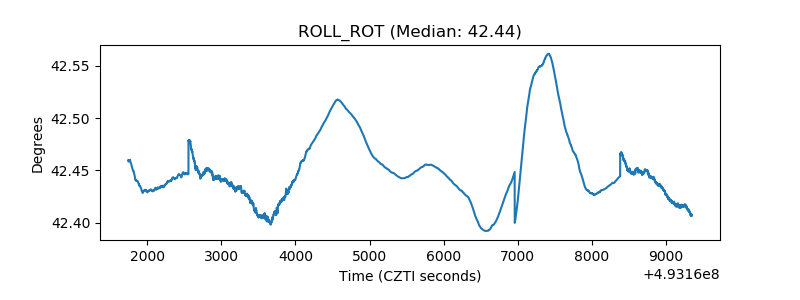 |
| _Roll_DEC | 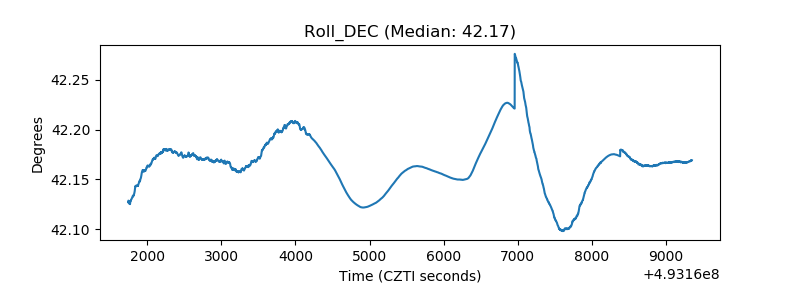 |
| _Roll_RA | 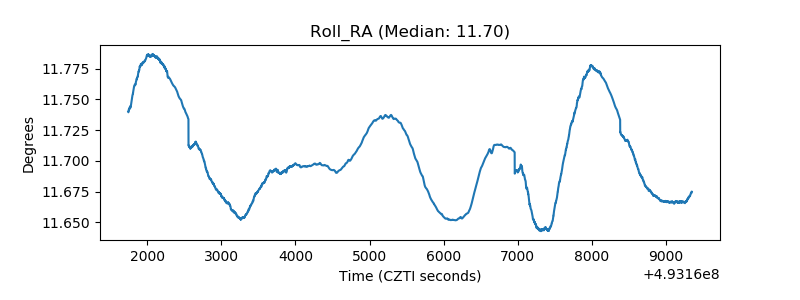 |
| Veto Counter | 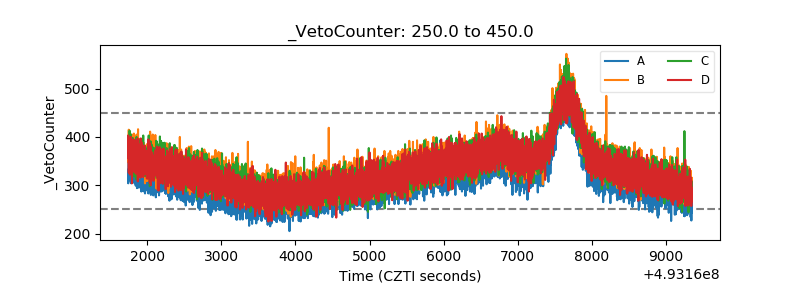 |