| Param | Original file | Final file |
|---|---|---|
| Filename | modeM0/AS1A14_002T07_9000006498_53493cztM0_level2.fits | modeM0/AS1A14_002T07_9000006498_53493cztM0_level2_quad_clean.evt |
| Size (bytes) | 1,794,677,760 | 165,490,560 |
| Size | 1.7 GB | 157.8 MB |
| Events in quadrant A | 19,332,261 | 990,865 |
| Events in quadrant B | 15,284,694 | 1,134,232 |
| Events in quadrant C | 23,023,335 | 762,764 |
| Events in quadrant D | 7,726,143 | 1,164,854 |
| Mode SS | |||
|---|---|---|---|
| Quadrant | BADHDUFLAG | Total packets | Discarded packets |
| A | 0 | 278 | 0 |
| B | 0 | 278 | 0 |
| C | 0 | 278 | 0 |
| D | 0 | 278 | 0 |
| Mode M9 | |||
|---|---|---|---|
| Quadrant | BADHDUFLAG | Total packets | Discarded packets |
| A | 0 | 5 | 0 |
| B | 0 | 5 | 0 |
| C | 0 | 5 | 0 |
| D | 0 | 5 | 0 |
| Mode M0 | |||
|---|---|---|---|
| Quadrant | BADHDUFLAG | Total packets | Discarded packets |
| A | 0 | 67161 | 2 |
| B | 0 | 55096 | 2 |
| C | 0 | 78142 | 2 |
| D | 0 | 33120 | 2 |
| Quadrant | Total seconds | Saturated seconds | Saturation percentage |
|---|---|---|---|
| A | 13859 | 3870 | 27.924093% |
| B | 13858 | 3178 | 22.932602% |
| C | 13858 | 5745 | 41.456199% |
| D | 13858 | 213 | 1.537018% |
Noise dominated data is calculated using 1-second bins in cleaned event files. If a bin has >2000 counts, and if more than 50% of those come from <1% of pixels, then it is considered to be noise-dominated and hence unusable.
| Quadrant | # 1 sec bins | Bins with >0 counts | Bins with >2000 counts | High rate bins dominated by noise | Noise dominated (total time) | Noise dominated (detector-on time) | Marked lightcurve |
|---|---|---|---|---|---|---|---|
| A | 14308 | 13859 | 3502 | 3502 | 24.48% | 25.27% | 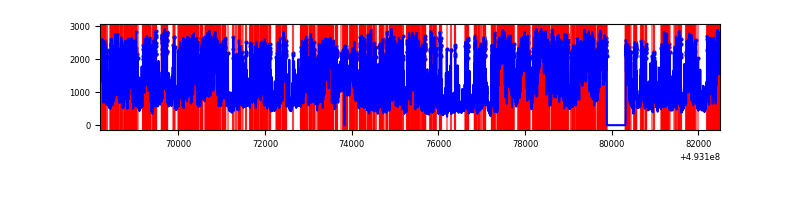 |
| B | 14307 | 13858 | 2625 | 2625 | 18.35% | 18.94% | 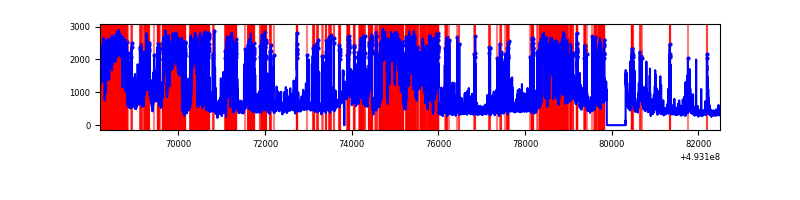 |
| C | 14307 | 13858 | 5807 | 5807 | 40.59% | 41.90% | 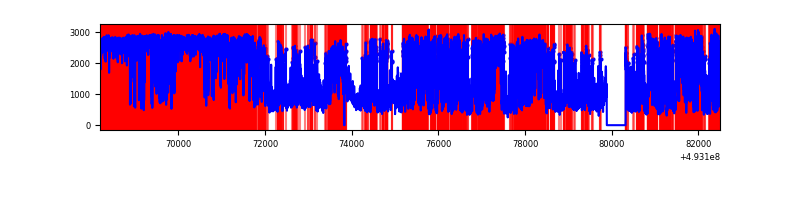 |
| D | 14307 | 13858 | 233 | 233 | 1.63% | 1.68% | 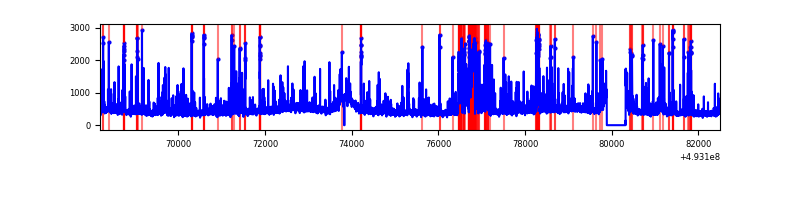 |
Top three noisy pixels from each quadrant. If the there are fewer than three noisy pixels in the level2.evt file, extra rows are filled as -1
| Pixel properties | Quadrant properties | ||||||
|---|---|---|---|---|---|---|---|
| Quadrant | DetID | PixID | Counts | Sigma | Mean | Median | Sigma |
| A | 3 | 63 | 6899923 | 21276.39 | 1321 | 1292 | 324.2 |
| A | 3 | 62 | 4724389 | 14566.73 | 1321 | 1292 | 324.2 |
| A | 15 | 174 | 1870587 | 5765.18 | 1321 | 1292 | 324.2 |
| B | 2 | 249 | 7955081 | 27748.34 | 1342 | 1294 | 286.6 |
| B | 4 | 171 | 609869 | 2123.13 | 1342 | 1294 | 286.6 |
| B | 10 | 254 | 400299 | 1392.01 | 1342 | 1294 | 286.6 |
| C | 7 | 64 | 12656169 | 40012.41 | 1148 | 1137 | 316.3 |
| C | 15 | 224 | 2360237 | 7458.95 | 1148 | 1137 | 316.3 |
| C | 15 | 178 | 1088981 | 3439.52 | 1148 | 1137 | 316.3 |
| D | 2 | 16 | 698146 | 1727.79 | 1434 | 1371 | 403.3 |
| D | 3 | 12 | 361568 | 893.18 | 1434 | 1371 | 403.3 |
| D | 1 | 0 | 263256 | 649.39 | 1434 | 1371 | 403.3 |
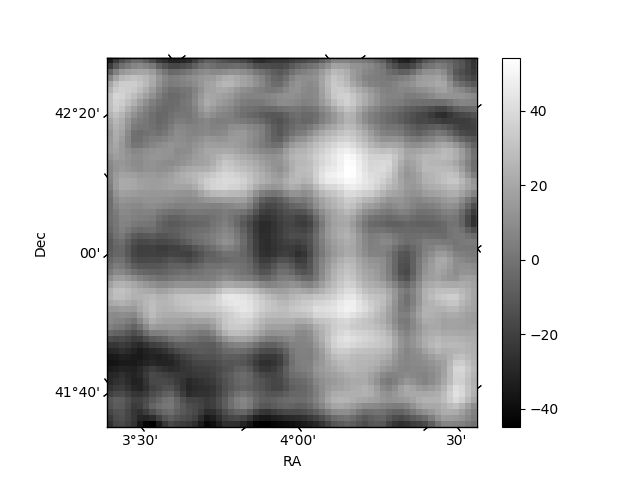
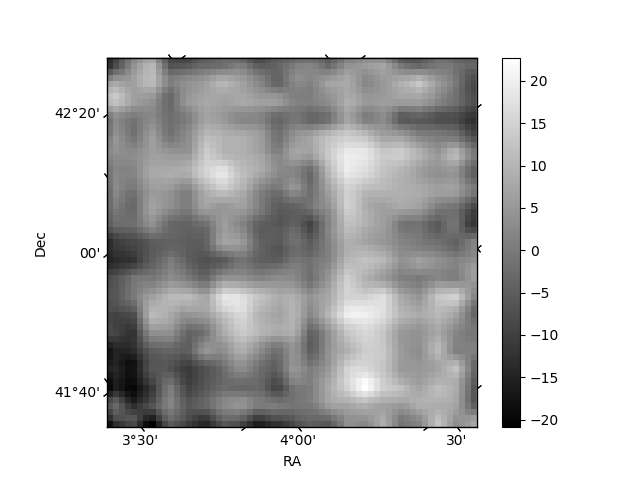
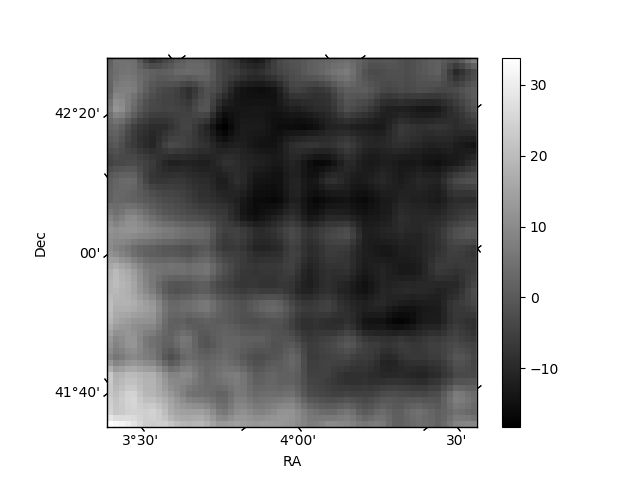
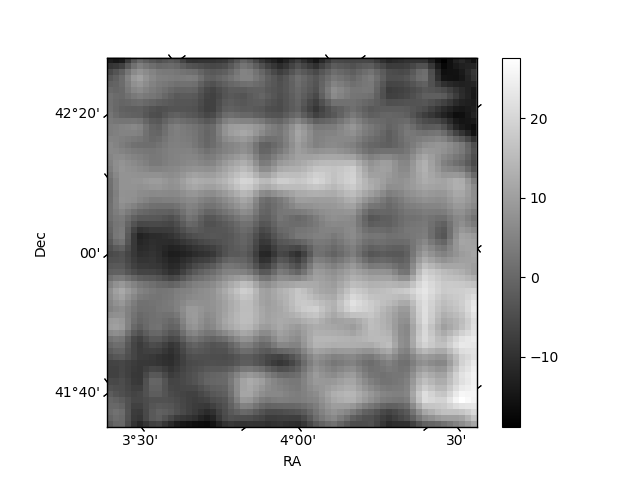
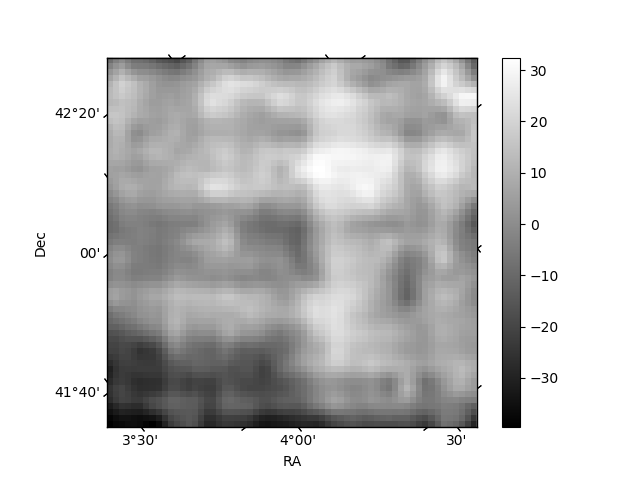
Histogram calculated using DETX and DETY for each event in the final _common_clean file
| Quadrant A | 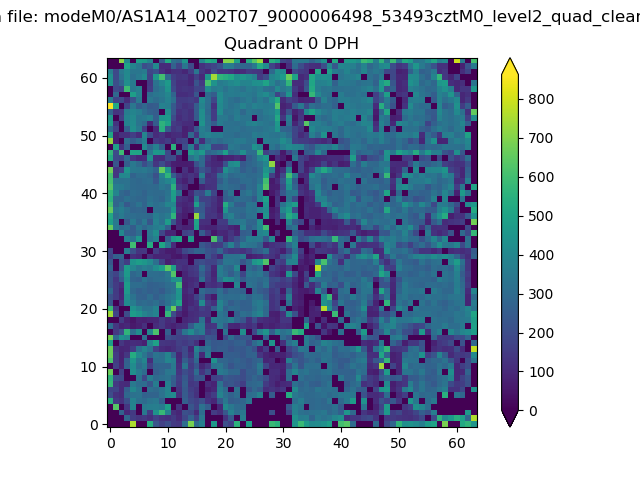 |
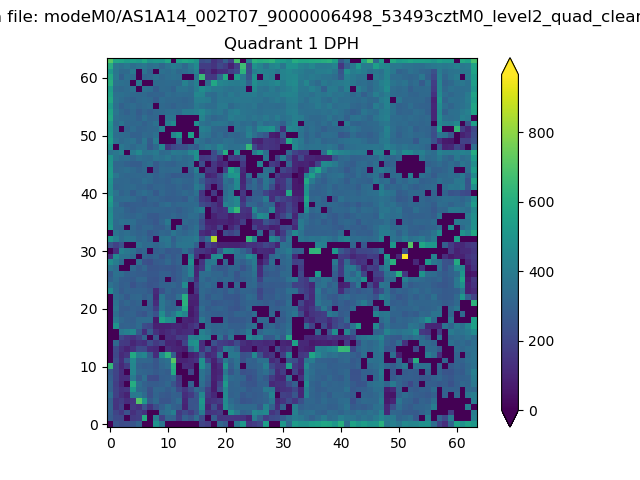 |
Quadrant B |
|---|---|---|---|
| Quadrant D | 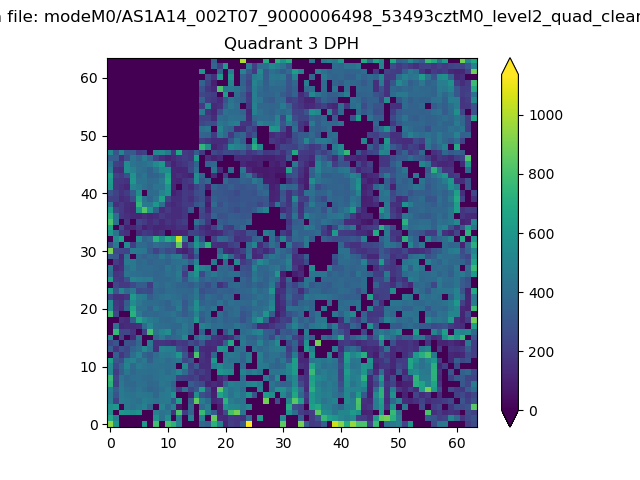 |
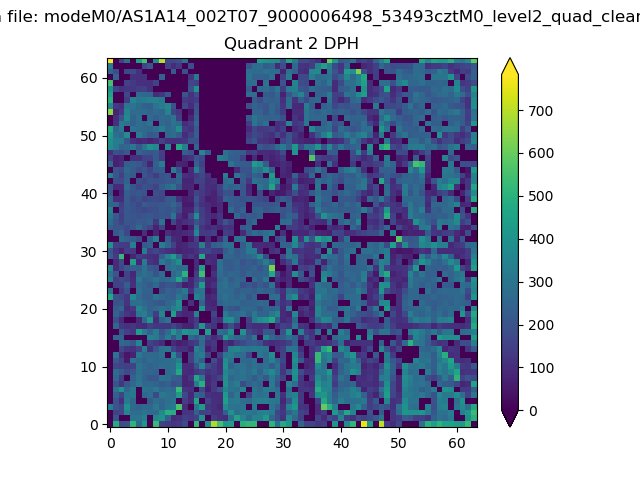 |
Quadrant C |
| Plot type | Count rate plots | Images |
|---|---|---|
| Comparison with Poisson distribution Blue bars denote a histogram of data divided into 1 sec bins. Red curve is a Poisson curve with rate = median count rate of data. |
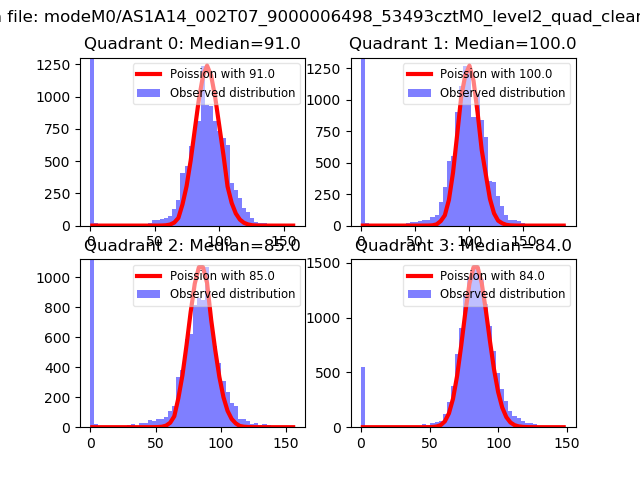 |
 |
| Quadrant-wise count rates Data is divided into 100 sec bins |
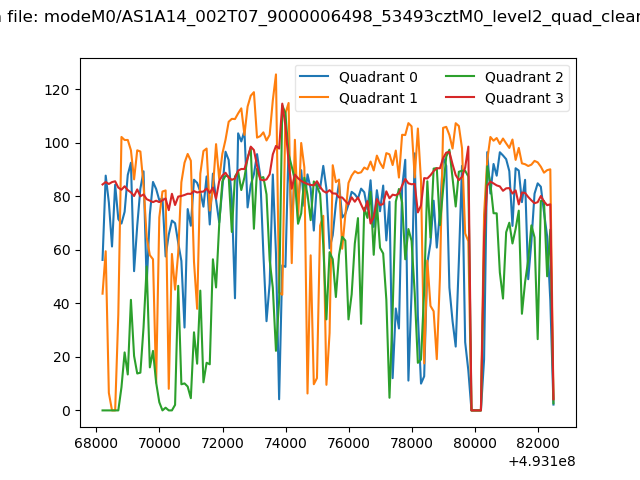 |
|
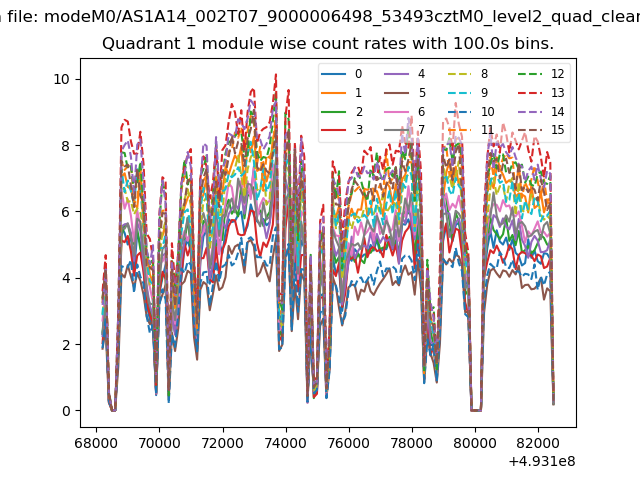
| Module-wise count rates for Quadrant A Data is divided into 100 sec bins |
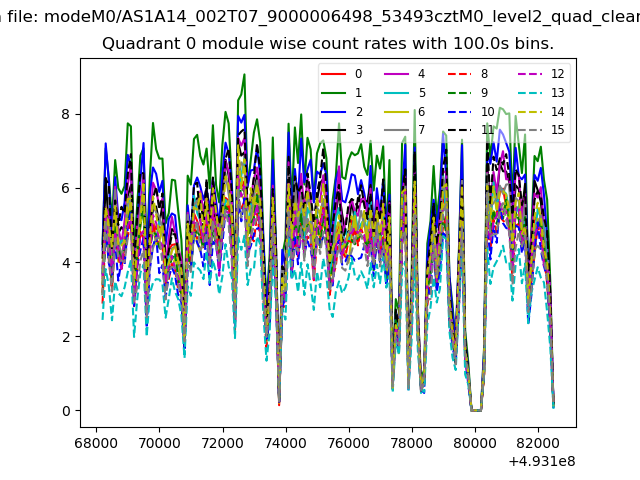 |
 |
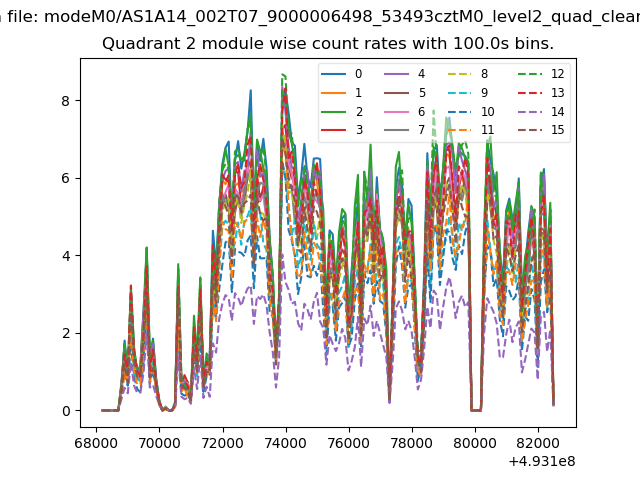
| Module-wise count rates for Quadrant B Data is divided into 100 sec bins |
 |
 |
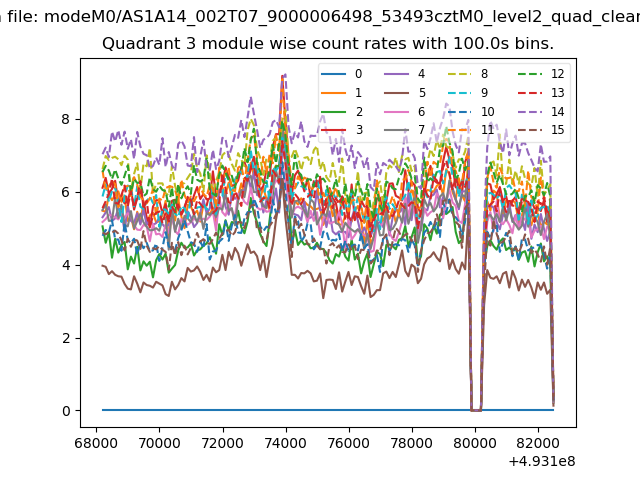
| Module-wise count rates for Quadrant C Data is divided into 100 sec bins |
 |
 |
| Module-wise count rates for Quadrant D Data is divided into 100 sec bins |
 |
 |
| Parameter | Plot |
|---|---|
| CZT HV Monitor | 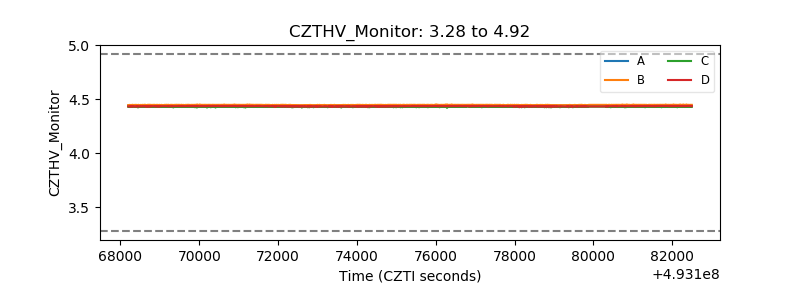 |
| D_VDD | 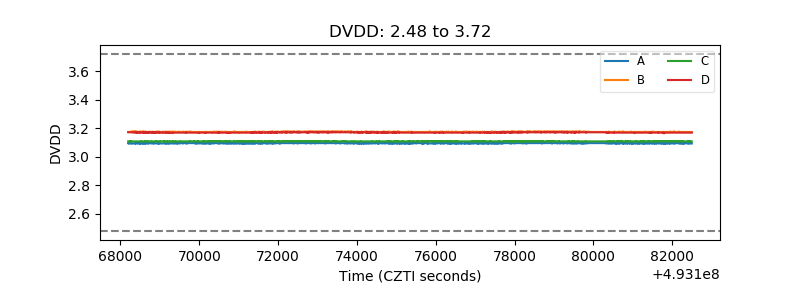 |
| Temperature 1 | 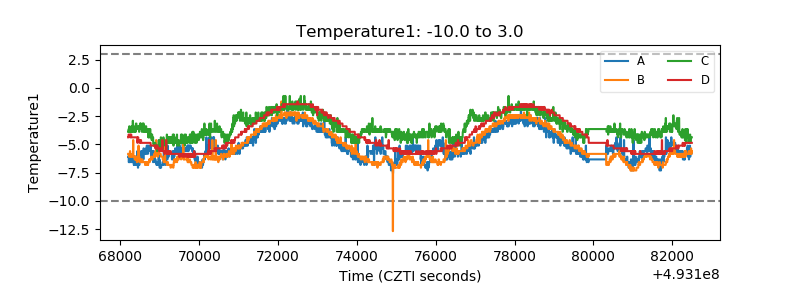 |
| Veto HV Monitor | 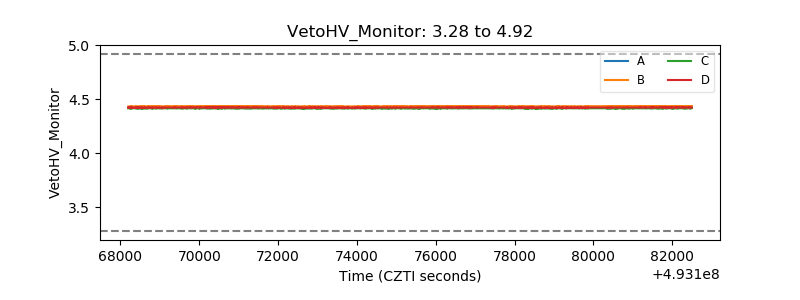 |
| Veto LLD | 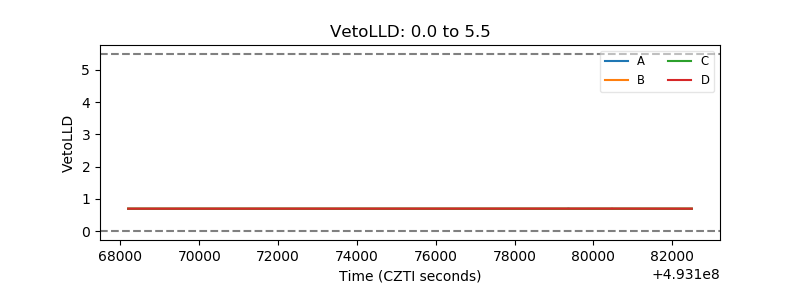 |
| Alpha Counter | 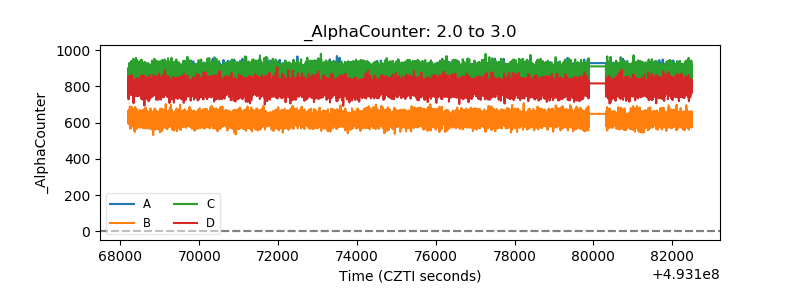 |
| _CPM_Rate | 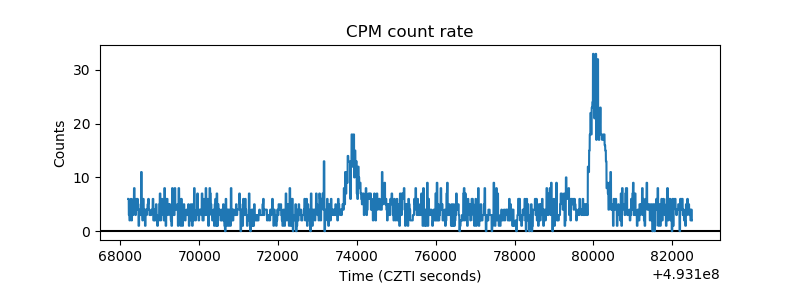 |
| CZT Counter |  |
| +2.5 Volts monitor | 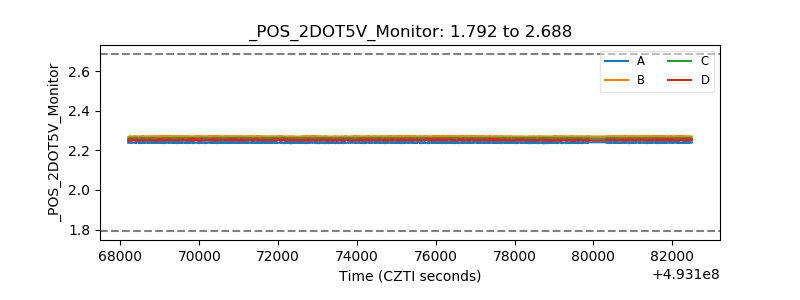 |
| +5 Volts monitor | 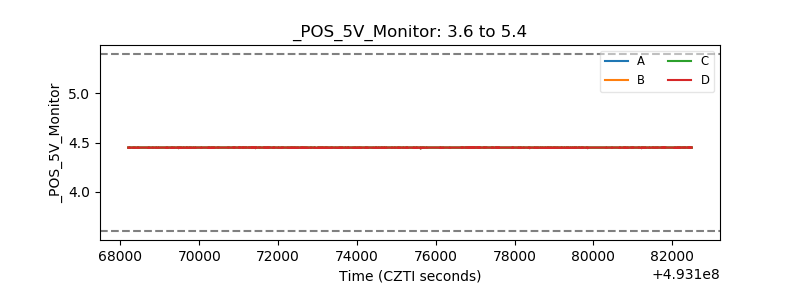 |
| _ROLL_ROT | 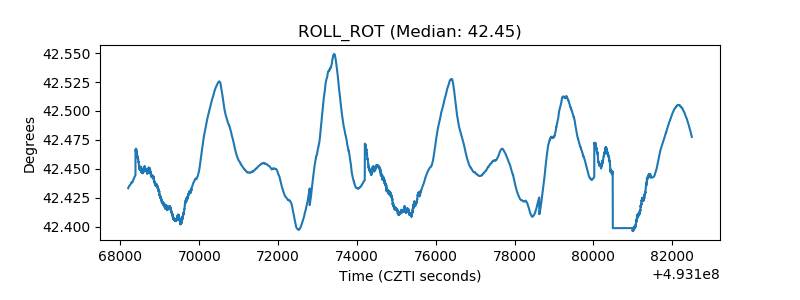 |
| _Roll_DEC | 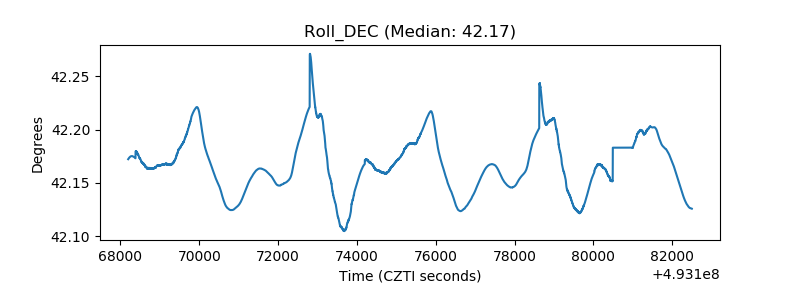 |
| _Roll_RA | 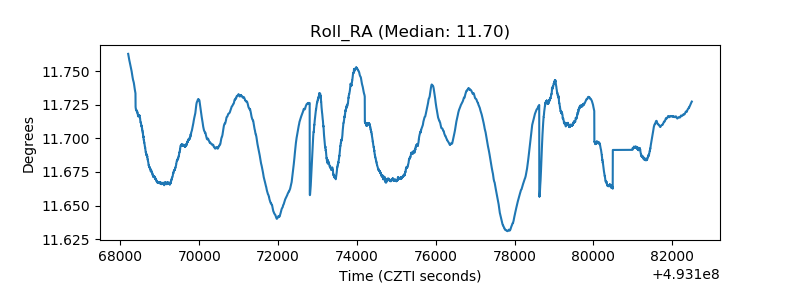 |
| Veto Counter | 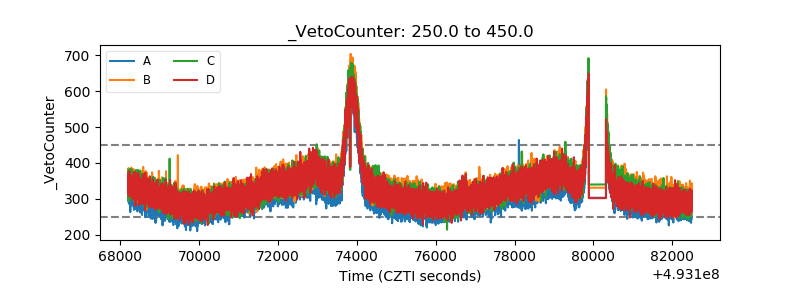 |