| Param | Original file | Final file |
|---|---|---|
| Filename | modeM0/AS1A14_002T07_9000006498_53494cztM0_level2.fits | modeM0/AS1A14_002T07_9000006498_53494cztM0_level2_quad_clean.evt |
| Size (bytes) | 1,718,668,800 | 113,094,720 |
| Size | 1.6 GB | 107.9 MB |
| Events in quadrant A | 19,978,559 | 586,570 |
| Events in quadrant B | 15,262,149 | 679,887 |
| Events in quadrant C | 21,718,728 | 455,666 |
| Events in quadrant D | 5,800,348 | 928,749 |
| Mode SS | |||
|---|---|---|---|
| Quadrant | BADHDUFLAG | Total packets | Discarded packets |
| A | 0 | 226 | 0 |
| B | 0 | 226 | 0 |
| C | 0 | 226 | 0 |
| D | 0 | 226 | 0 |
| Mode M9 | |||
|---|---|---|---|
| Quadrant | BADHDUFLAG | Total packets | Discarded packets |
| A | 0 | 14 | 0 |
| B | 0 | 14 | 0 |
| C | 0 | 14 | 0 |
| D | 0 | 14 | 0 |
| Mode M0 | |||
|---|---|---|---|
| Quadrant | BADHDUFLAG | Total packets | Discarded packets |
| A | 0 | 67108 | 5 |
| B | 0 | 53130 | 2 |
| C | 0 | 71965 | 2 |
| D | 0 | 25513 | 2 |
| Quadrant | Total seconds | Saturated seconds | Saturation percentage |
|---|---|---|---|
| A | 11165 | 5461 | 48.911778% |
| B | 11166 | 4800 | 42.987641% |
| C | 11166 | 6461 | 57.863156% |
| D | 11166 | 184 | 1.647860% |
Noise dominated data is calculated using 1-second bins in cleaned event files. If a bin has >2000 counts, and if more than 50% of those come from <1% of pixels, then it is considered to be noise-dominated and hence unusable.
| Quadrant | # 1 sec bins | Bins with >0 counts | Bins with >2000 counts | High rate bins dominated by noise | Noise dominated (total time) | Noise dominated (detector-on time) | Marked lightcurve |
|---|---|---|---|---|---|---|---|
| A | 12540 | 11167 | 5271 | 5271 | 42.03% | 47.20% | 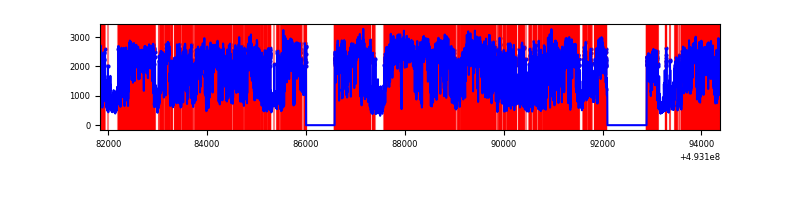 |
| B | 12541 | 11168 | 4235 | 4235 | 33.77% | 37.92% | 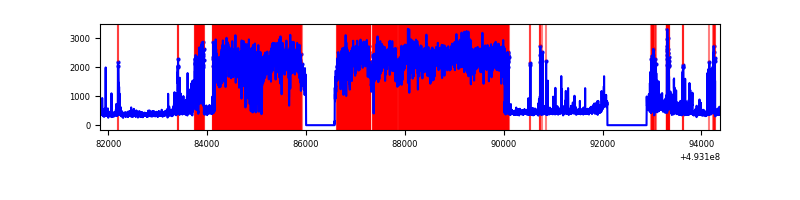 |
| C | 12541 | 11168 | 6404 | 6404 | 51.06% | 57.34% | 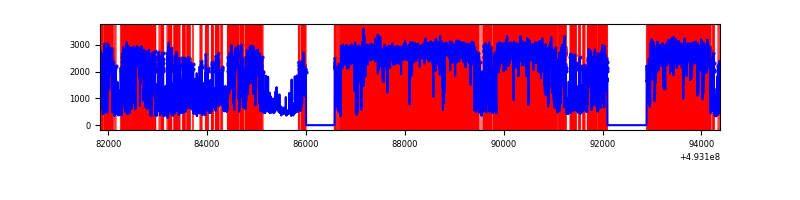 |
| D | 12541 | 11168 | 111 | 111 | 0.89% | 0.99% | 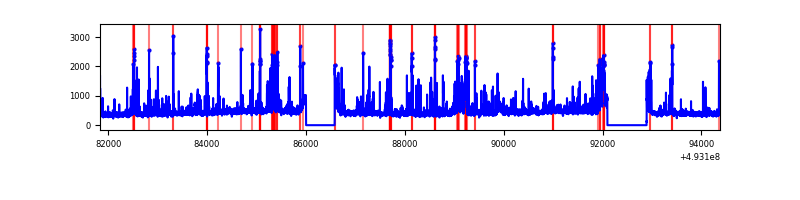 |
Top three noisy pixels from each quadrant. If the there are fewer than three noisy pixels in the level2.evt file, extra rows are filled as -1
| Pixel properties | Quadrant properties | ||||||
|---|---|---|---|---|---|---|---|
| Quadrant | DetID | PixID | Counts | Sigma | Mean | Median | Sigma |
| A | 3 | 63 | 8586803 | 36761.3 | 951 | 929 | 233.6 |
| A | 3 | 62 | 4911544 | 21025.3 | 951 | 929 | 233.6 |
| A | 15 | 174 | 2590243 | 11086.41 | 951 | 929 | 233.6 |
| B | 2 | 249 | 10272564 | 47576.01 | 1004 | 968 | 215.9 |
| B | 13 | 245 | 188611 | 869.13 | 1004 | 968 | 215.9 |
| B | 0 | 213 | 167631 | 771.95 | 1004 | 968 | 215.9 |
| C | 1 | 241 | 12184832 | 57804.9 | 771 | 765 | 210.8 |
| C | 7 | 64 | 3280751 | 15561.25 | 771 | 765 | 210.8 |
| C | 15 | 224 | 1568662 | 7438.58 | 771 | 765 | 210.8 |
| D | 2 | 120 | 336463 | 1033.36 | 1157 | 1105 | 324.5 |
| D | 2 | 16 | 303012 | 930.29 | 1157 | 1105 | 324.5 |
| D | 3 | 12 | 143264 | 438.04 | 1157 | 1105 | 324.5 |
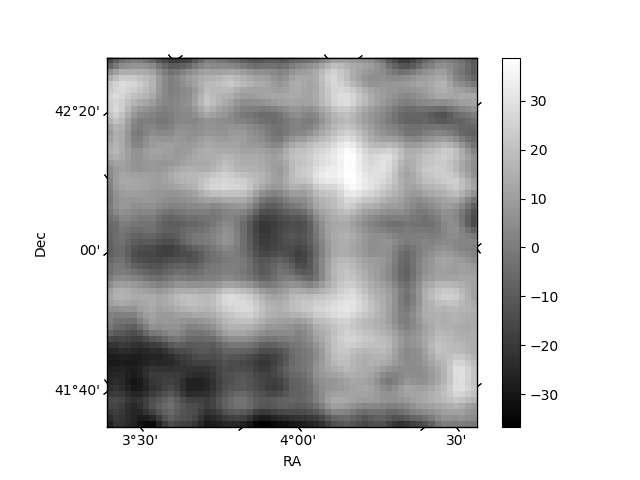
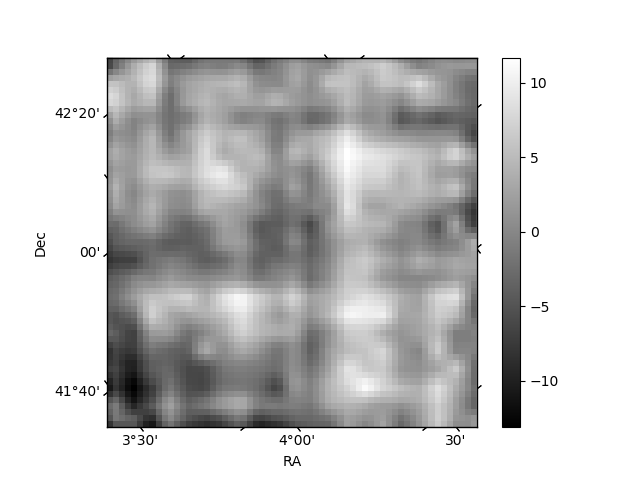
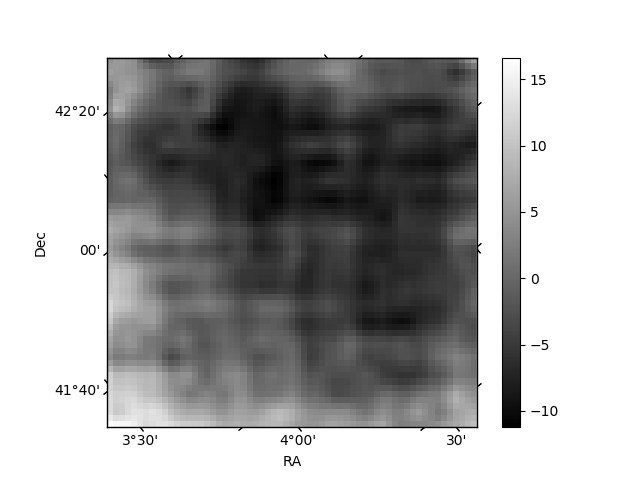
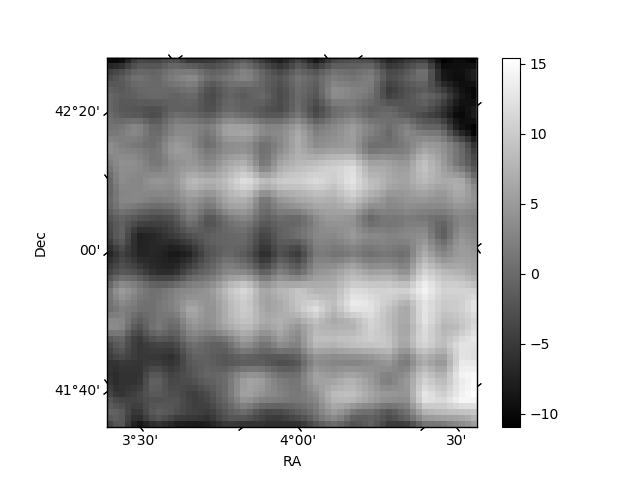
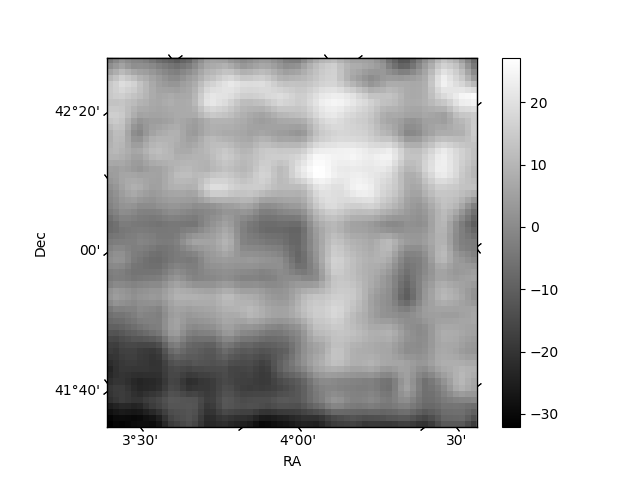
Histogram calculated using DETX and DETY for each event in the final _common_clean file
| Quadrant A | 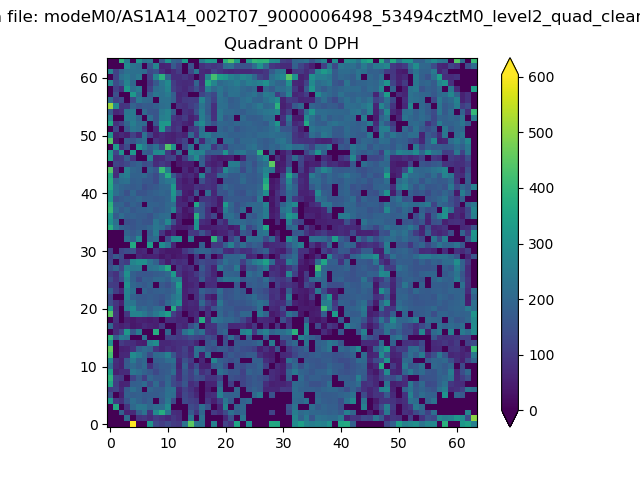 |
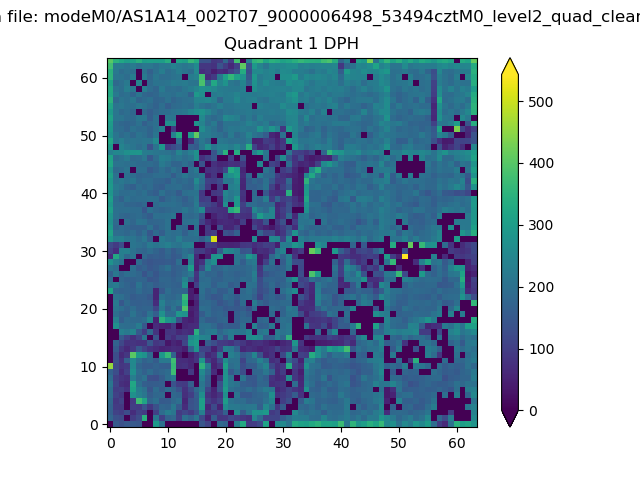 |
Quadrant B |
|---|---|---|---|
| Quadrant D | 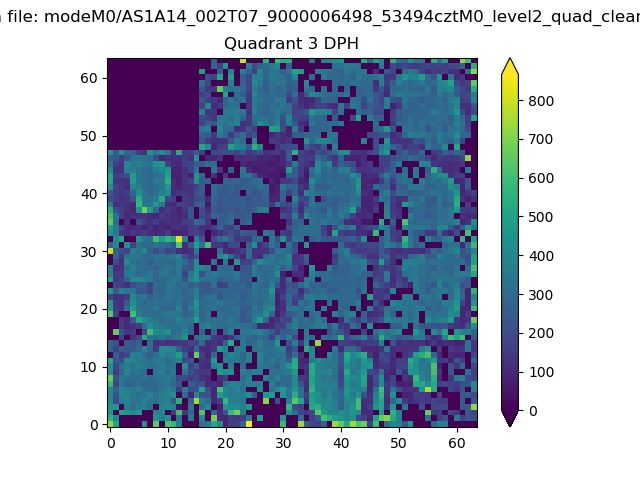 |
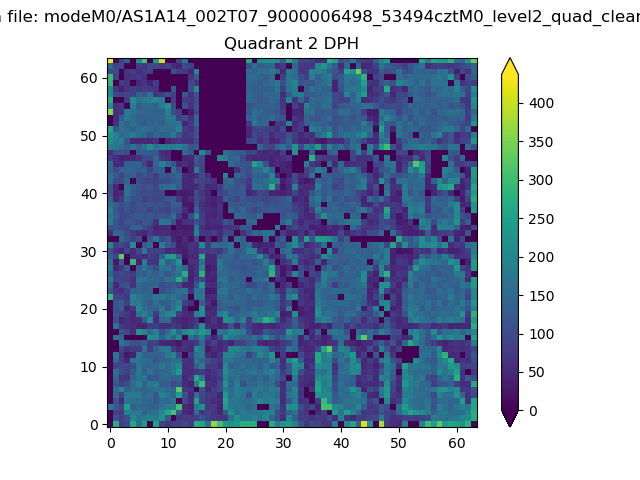 |
Quadrant C |
| Plot type | Count rate plots | Images |
|---|---|---|
| Comparison with Poisson distribution Blue bars denote a histogram of data divided into 1 sec bins. Red curve is a Poisson curve with rate = median count rate of data. |
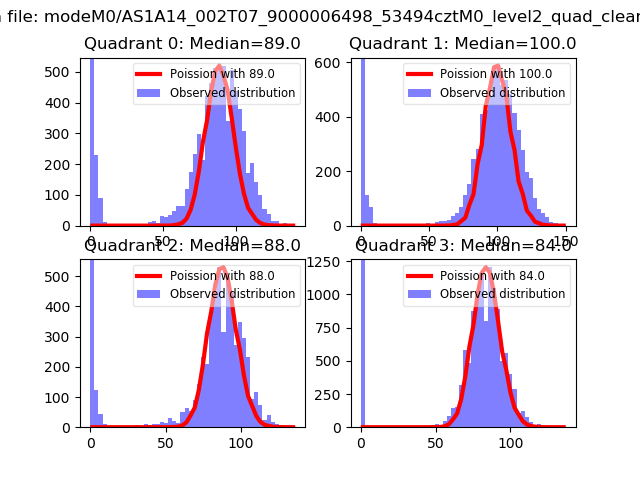 |
 |
| Quadrant-wise count rates Data is divided into 100 sec bins |
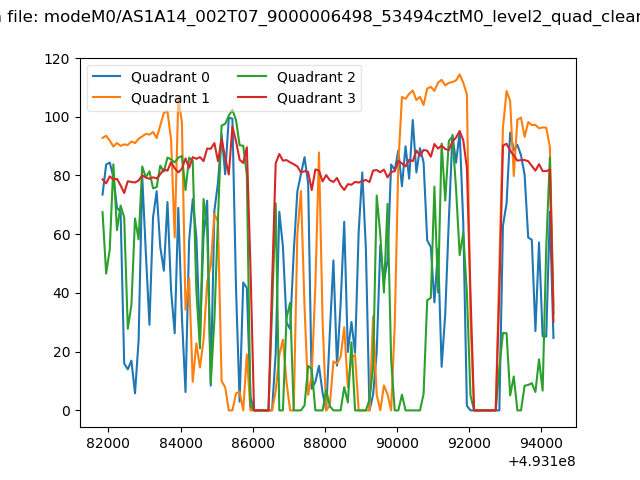 |
|
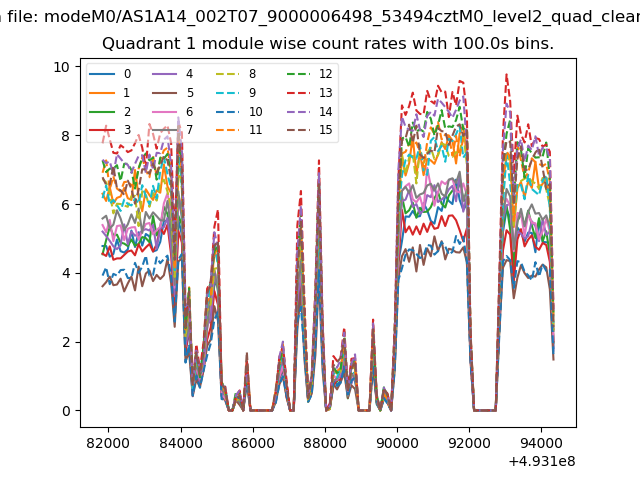
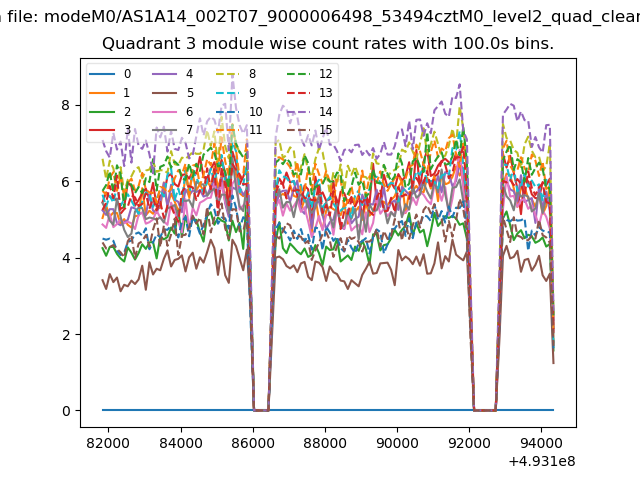
| Module-wise count rates for Quadrant A Data is divided into 100 sec bins |
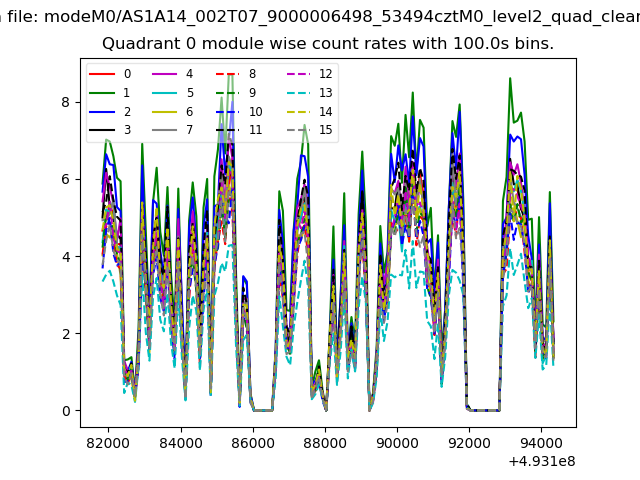 |
 |
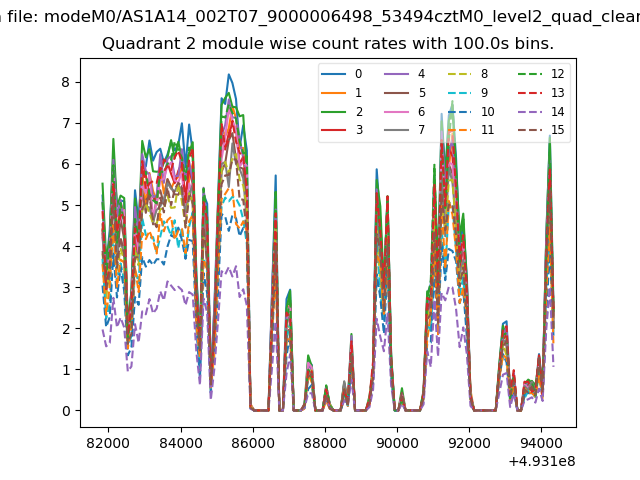
| Module-wise count rates for Quadrant B Data is divided into 100 sec bins |
 |
 |
| Module-wise count rates for Quadrant C Data is divided into 100 sec bins |
 |
 |
| Module-wise count rates for Quadrant D Data is divided into 100 sec bins |
 |
 |
| Parameter | Plot |
|---|---|
| CZT HV Monitor | 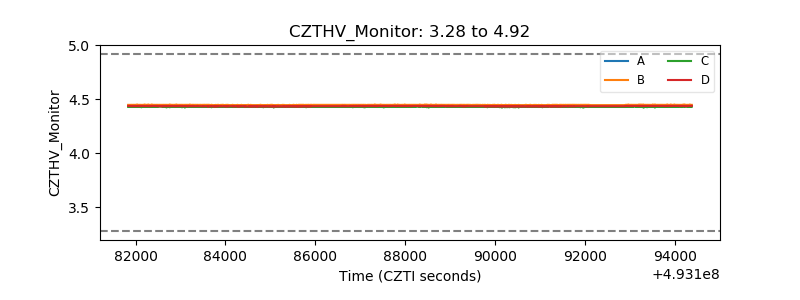 |
| D_VDD | 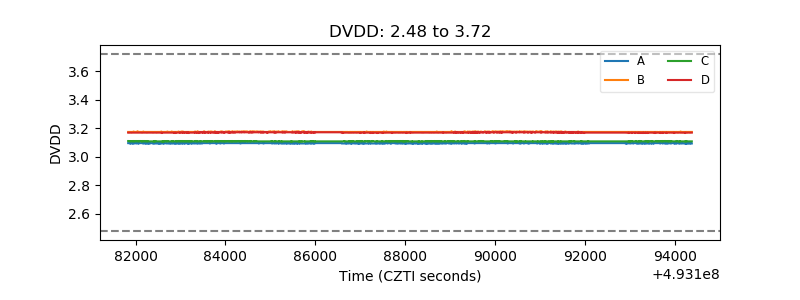 |
| Temperature 1 | 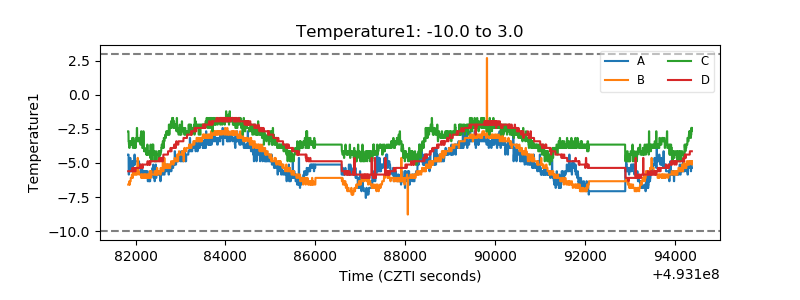 |
| Veto HV Monitor | 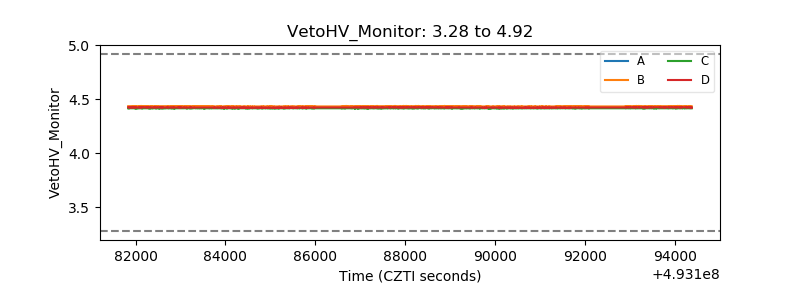 |
| Veto LLD | 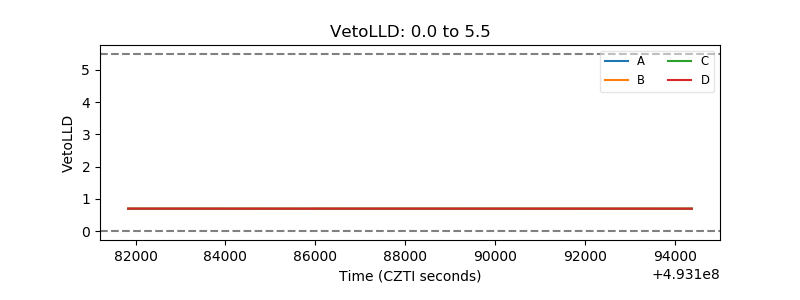 |
| Alpha Counter | 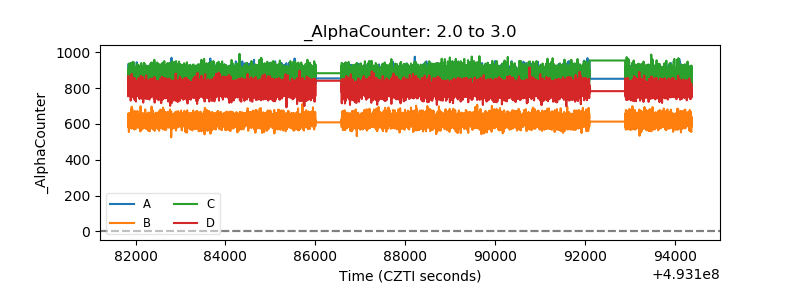 |
| _CPM_Rate | 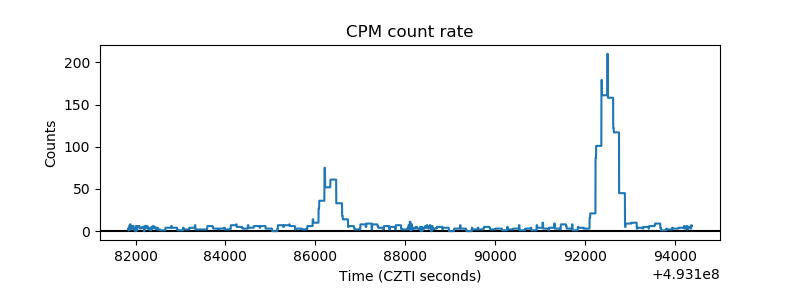 |
| CZT Counter | 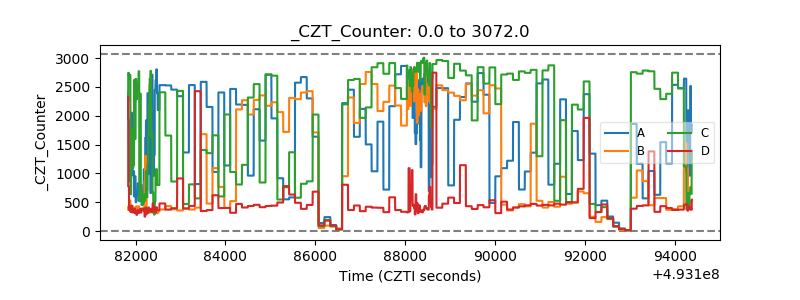 |
| +2.5 Volts monitor | 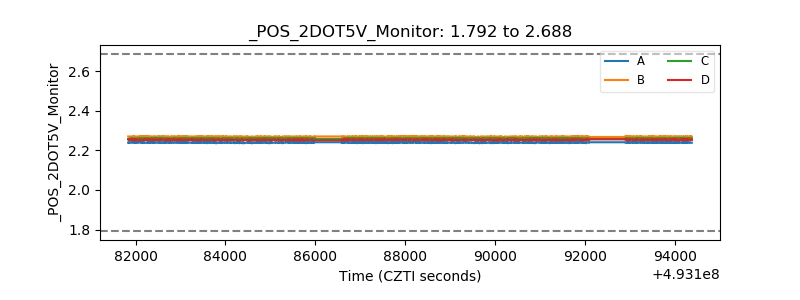 |
| +5 Volts monitor | 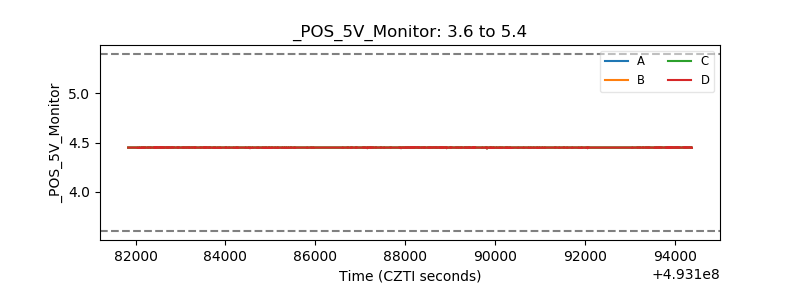 |
| _ROLL_ROT | 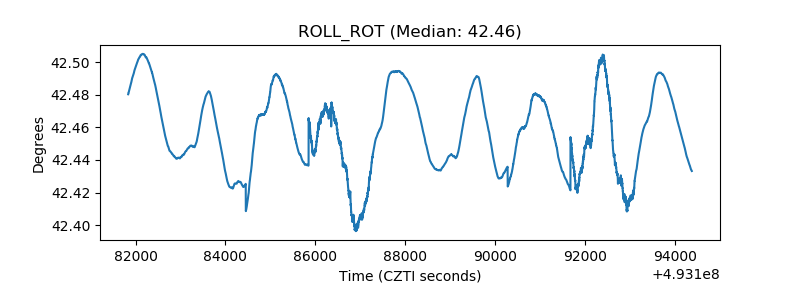 |
| _Roll_DEC | 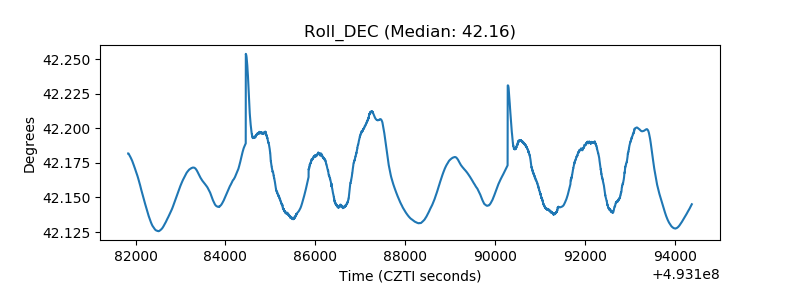 |
| _Roll_RA | 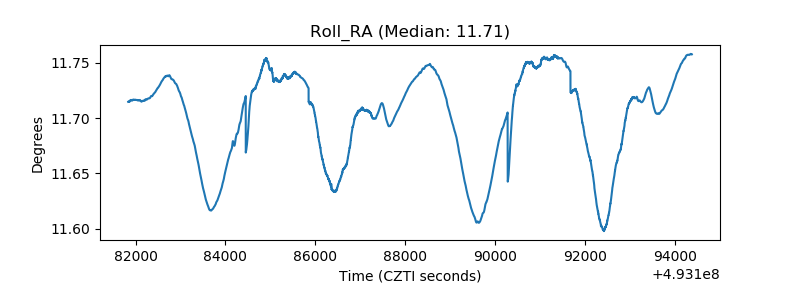 |
| Veto Counter | 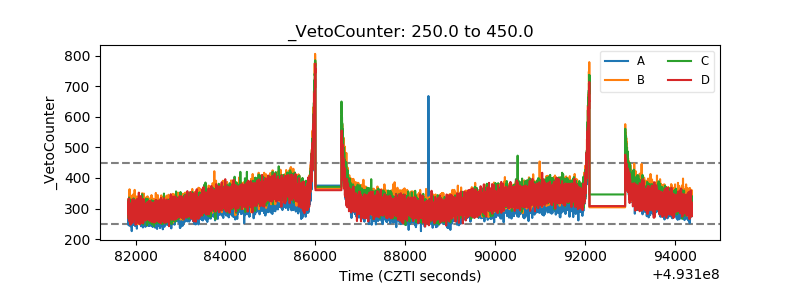 |