| Param | Original file | Final file |
|---|---|---|
| Filename | modeM0/AS1A14_002T07_9000006498_53495cztM0_level2.fits | modeM0/AS1A14_002T07_9000006498_53495cztM0_level2_quad_clean.evt |
| Size (bytes) | 840,576,960 | 77,209,920 |
| Size | 801.6 MB | 73.6 MB |
| Events in quadrant A | 12,417,606 | 307,772 |
| Events in quadrant B | 3,660,525 | 669,545 |
| Events in quadrant C | 11,043,128 | 347,335 |
| Events in quadrant D | 3,489,445 | 558,902 |
| Mode SS | |||
|---|---|---|---|
| Quadrant | BADHDUFLAG | Total packets | Discarded packets |
| A | 0 | 130 | 0 |
| B | 0 | 130 | 0 |
| C | 0 | 130 | 0 |
| D | 0 | 130 | 0 |
| Mode M9 | |||
|---|---|---|---|
| Quadrant | BADHDUFLAG | Total packets | Discarded packets |
| A | 0 | 10 | 0 |
| B | 0 | 10 | 0 |
| C | 0 | 10 | 0 |
| D | 0 | 10 | 0 |
| Mode M0 | |||
|---|---|---|---|
| Quadrant | BADHDUFLAG | Total packets | Discarded packets |
| A | 0 | 41391 | 1 |
| B | 0 | 15336 | 1 |
| C | 0 | 37190 | 5 |
| D | 0 | 15184 | 1 |
| Quadrant | Total seconds | Saturated seconds | Saturation percentage |
|---|---|---|---|
| A | 6517 | 3582 | 54.963940% |
| B | 6518 | 160 | 2.454741% |
| C | 6517 | 2971 | 45.588461% |
| D | 6517 | 74 | 1.135492% |
Noise dominated data is calculated using 1-second bins in cleaned event files. If a bin has >2000 counts, and if more than 50% of those come from <1% of pixels, then it is considered to be noise-dominated and hence unusable.
| Quadrant | # 1 sec bins | Bins with >0 counts | Bins with >2000 counts | High rate bins dominated by noise | Noise dominated (total time) | Noise dominated (detector-on time) | Marked lightcurve |
|---|---|---|---|---|---|---|---|
| A | 7482 | 6518 | 3435 | 3435 | 45.91% | 52.70% | 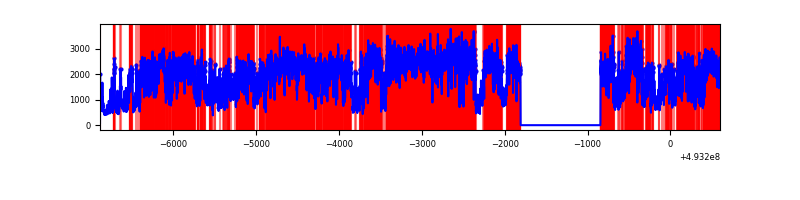 |
| B | 7483 | 6519 | 67 | 67 | 0.90% | 1.03% | 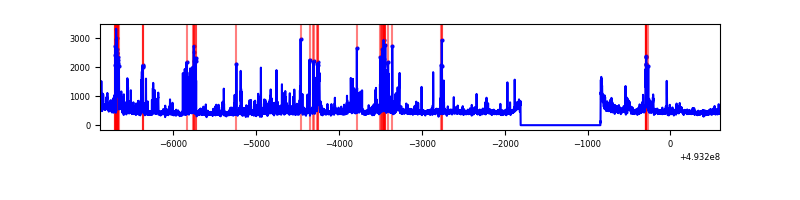 |
| C | 7482 | 6518 | 2985 | 2985 | 39.90% | 45.80% | 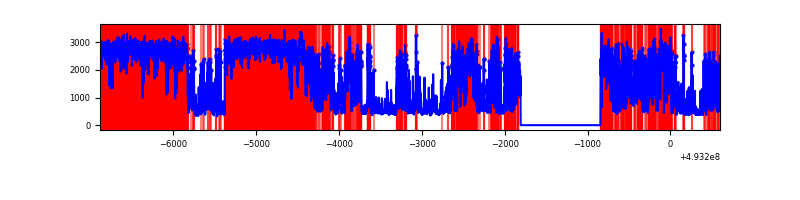 |
| D | 7482 | 6518 | 31 | 31 | 0.41% | 0.48% | 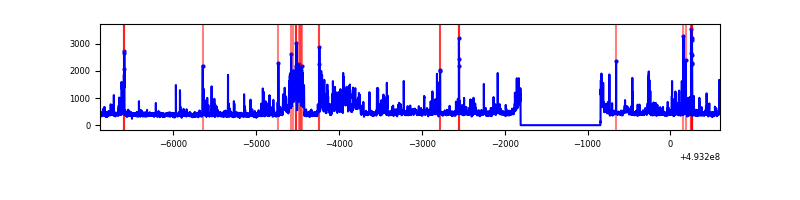 |
Top three noisy pixels from each quadrant. If the there are fewer than three noisy pixels in the level2.evt file, extra rows are filled as -1
| Pixel properties | Quadrant properties | ||||||
|---|---|---|---|---|---|---|---|
| Quadrant | DetID | PixID | Counts | Sigma | Mean | Median | Sigma |
| A | 3 | 63 | 4236916 | 33624.99 | 512 | 500 | 126.0 |
| A | 15 | 174 | 3176208 | 25206.01 | 512 | 500 | 126.0 |
| A | 3 | 62 | 2945649 | 23376.04 | 512 | 500 | 126.0 |
| B | 5 | 185 | 186233 | 1232.7 | 693 | 666 | 150.5 |
| B | 4 | 170 | 163100 | 1079.03 | 693 | 666 | 150.5 |
| B | 2 | 249 | 129948 | 858.81 | 693 | 666 | 150.5 |
| C | 1 | 241 | 5367112 | 38228.31 | 513 | 507 | 140.4 |
| C | 7 | 64 | 2499008 | 17797.75 | 513 | 507 | 140.4 |
| C | 15 | 224 | 851133 | 6059.32 | 513 | 507 | 140.4 |
| D | 2 | 120 | 441168 | 2275.6 | 679 | 647 | 193.6 |
| D | 1 | 0 | 128446 | 660.17 | 679 | 647 | 193.6 |
| D | 3 | 12 | 74452 | 381.25 | 679 | 647 | 193.6 |
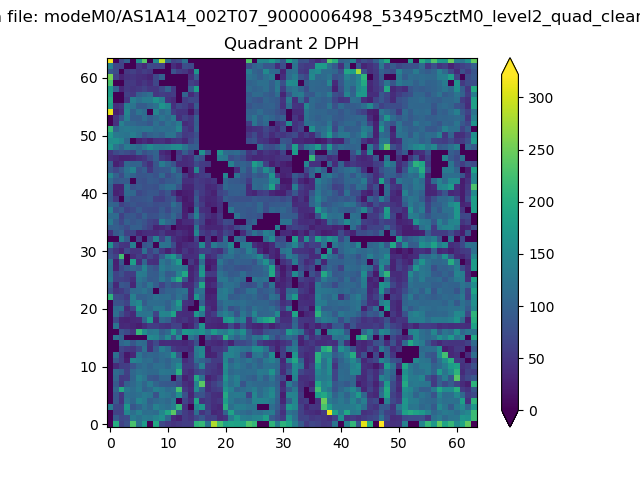
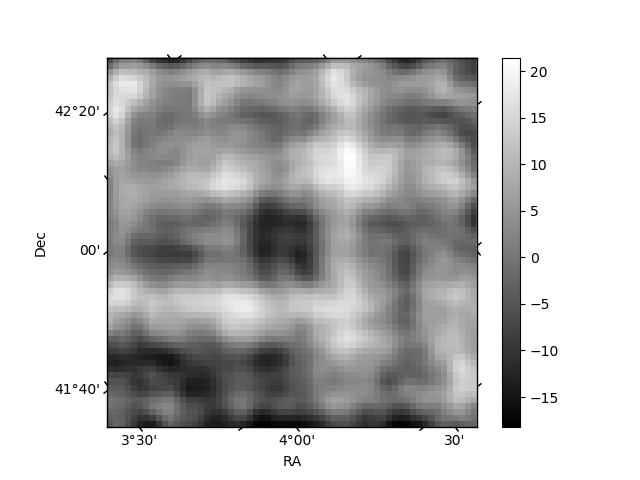
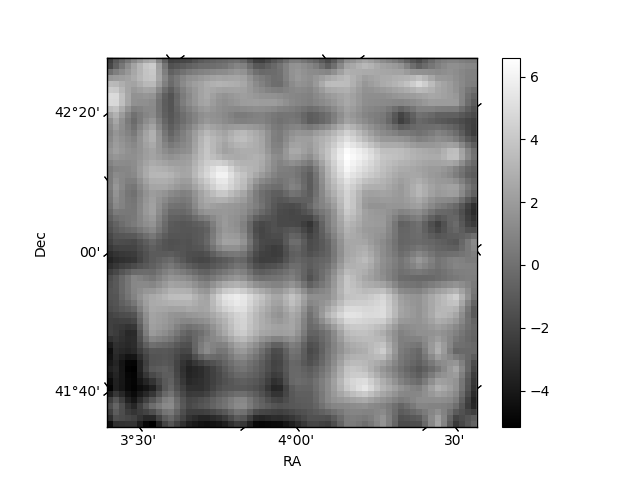
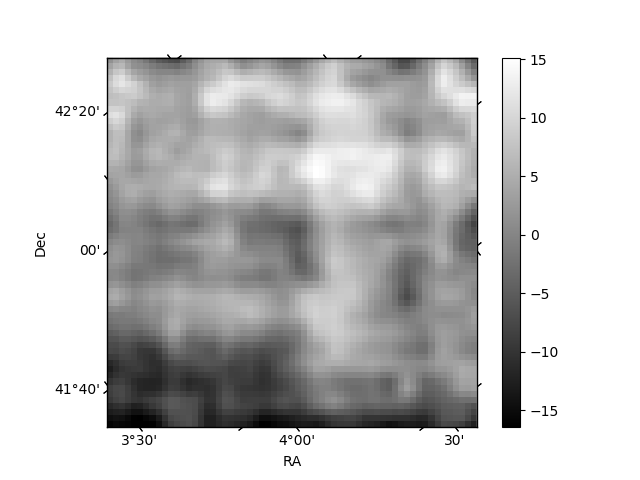
Histogram calculated using DETX and DETY for each event in the final _common_clean file
| Quadrant A | 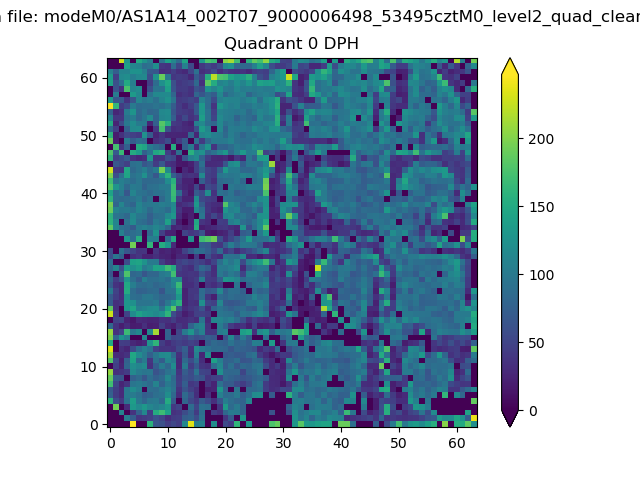 |
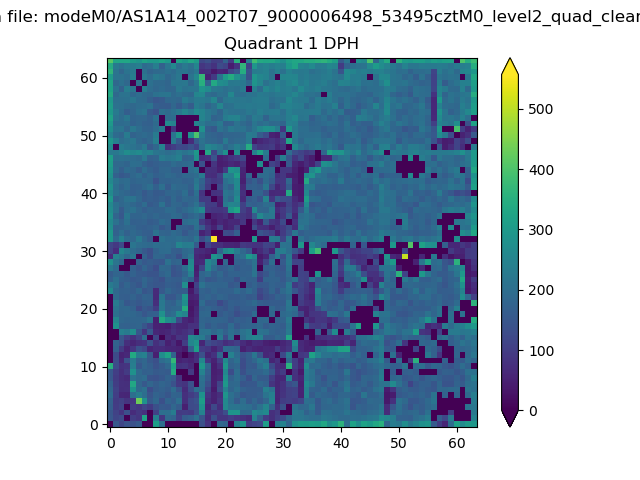 |
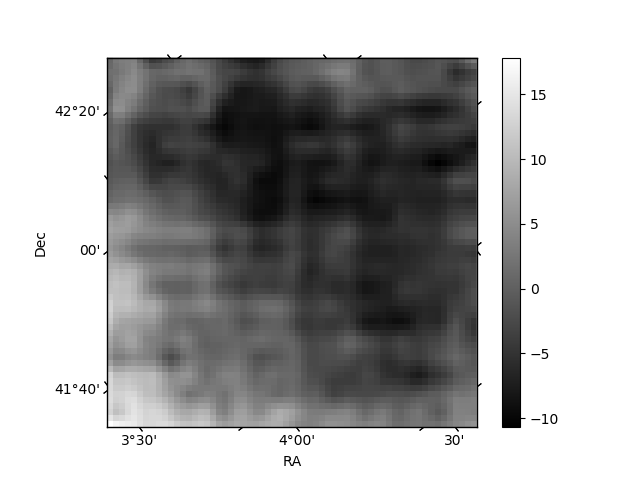
Quadrant B |
|---|---|---|---|
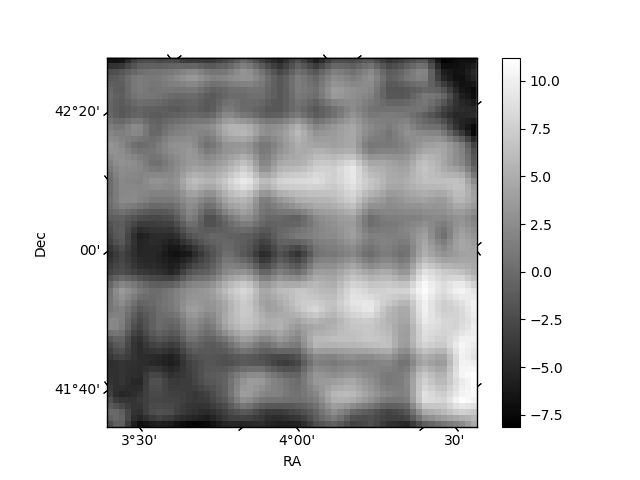
| Quadrant D | 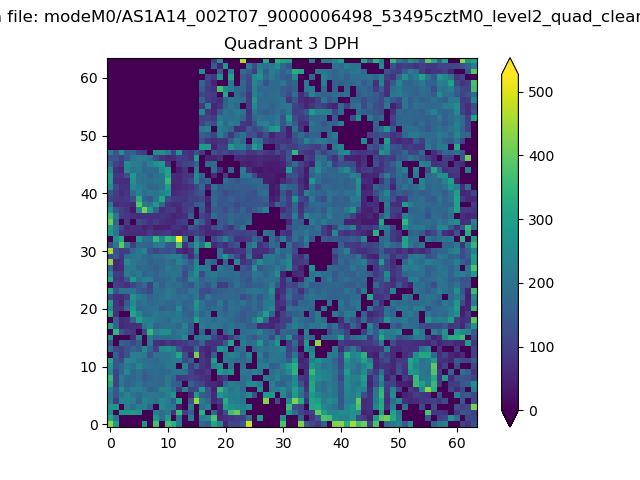 |
 |
Quadrant C |
| Plot type | Count rate plots | Images |
|---|---|---|
| Comparison with Poisson distribution Blue bars denote a histogram of data divided into 1 sec bins. Red curve is a Poisson curve with rate = median count rate of data. |
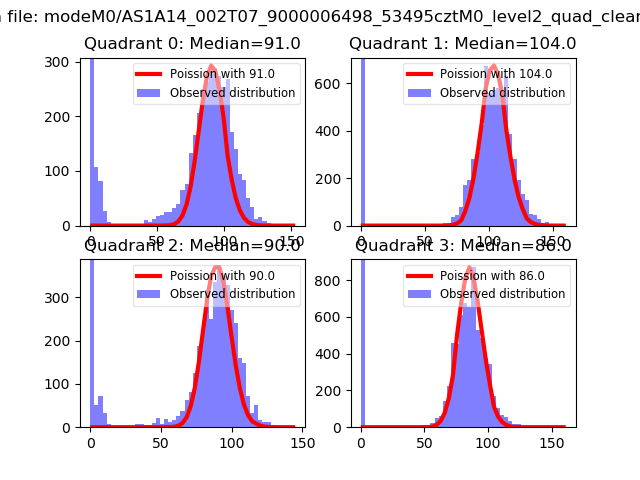 |
 |
| Quadrant-wise count rates Data is divided into 100 sec bins |
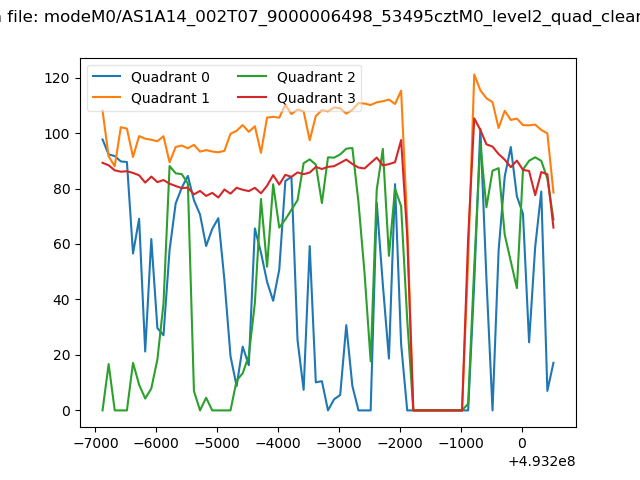 |
|
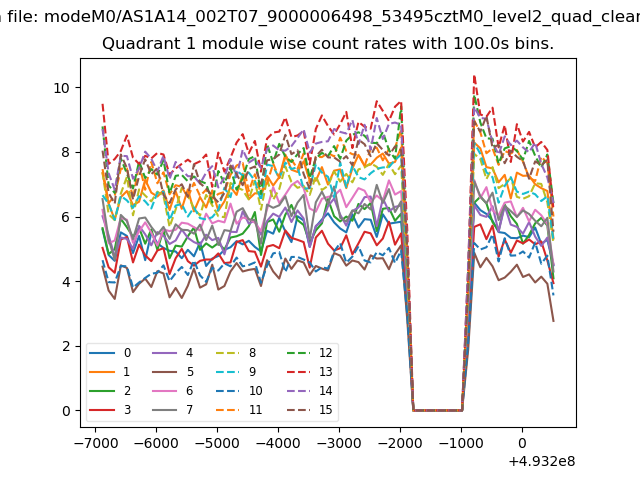
| Module-wise count rates for Quadrant A Data is divided into 100 sec bins |
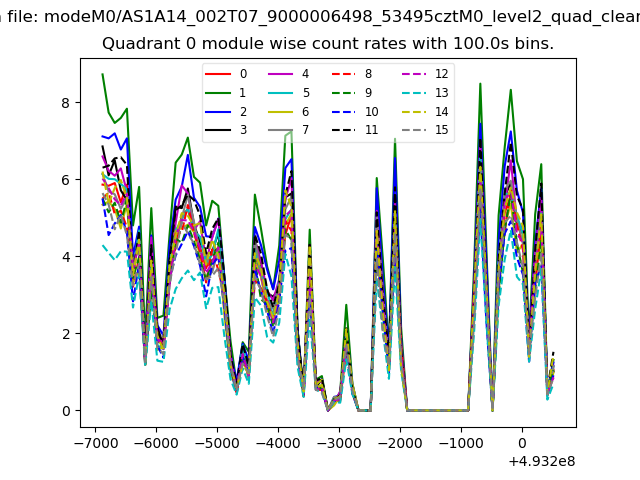 |
 |
| Module-wise count rates for Quadrant B Data is divided into 100 sec bins |
 |
 |
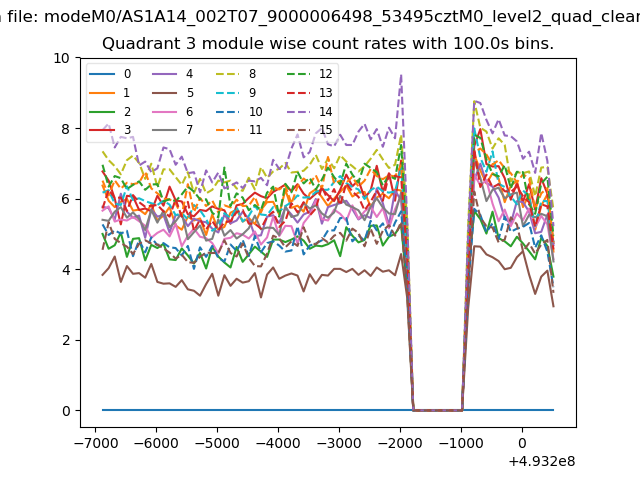
| Module-wise count rates for Quadrant C Data is divided into 100 sec bins |
 |
 |
| Module-wise count rates for Quadrant D Data is divided into 100 sec bins |
 |
 |
| Parameter | Plot |
|---|---|
| CZT HV Monitor |  |
| D_VDD | 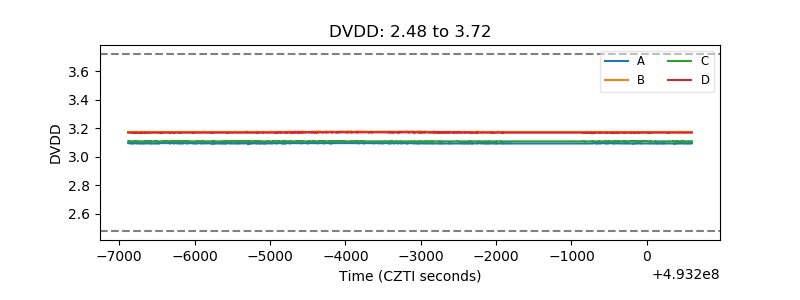 |
| Temperature 1 | 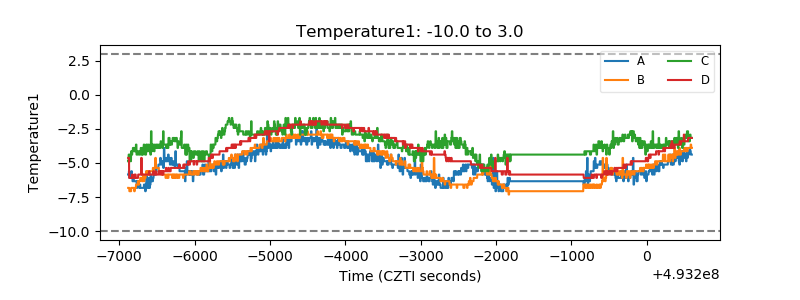 |
| Veto HV Monitor | 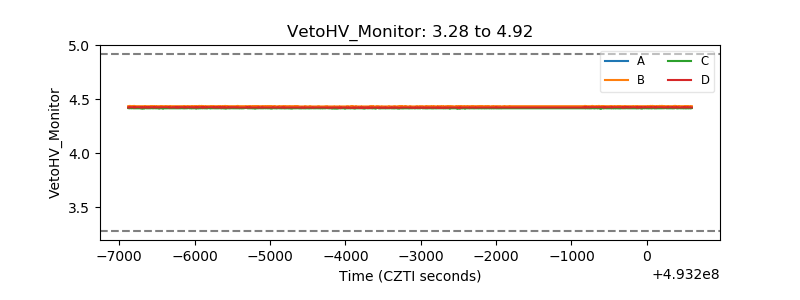 |
| Veto LLD | 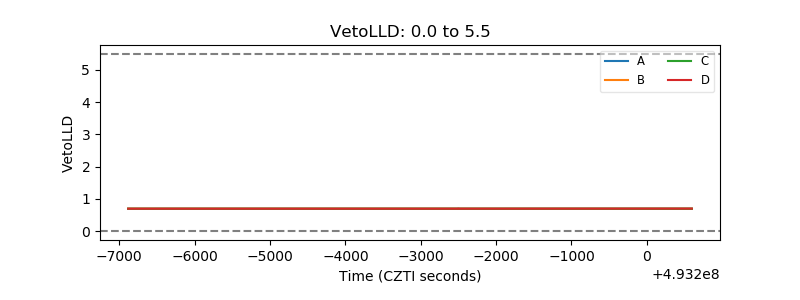 |
| Alpha Counter | 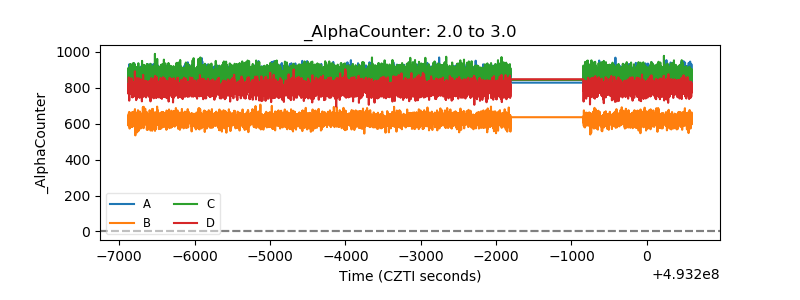 |
| _CPM_Rate | 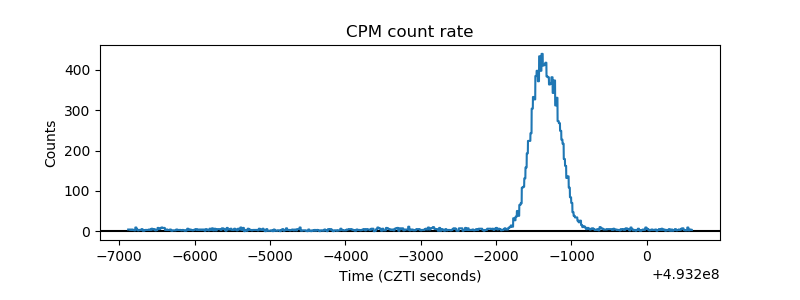 |
| CZT Counter | 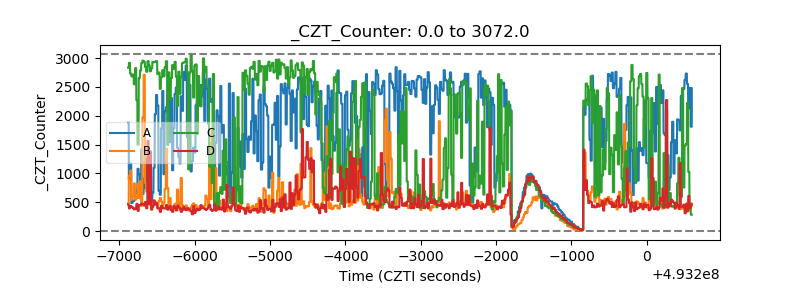 |
| +2.5 Volts monitor | 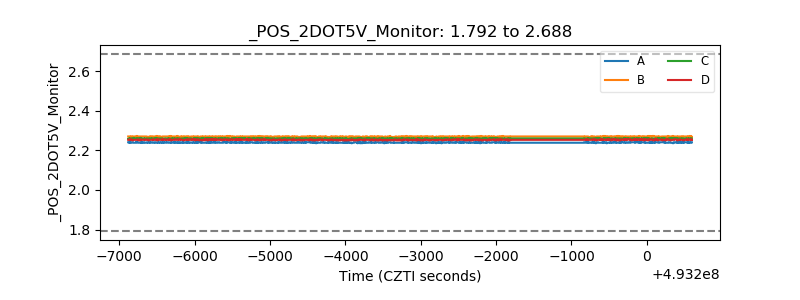 |
| +5 Volts monitor | 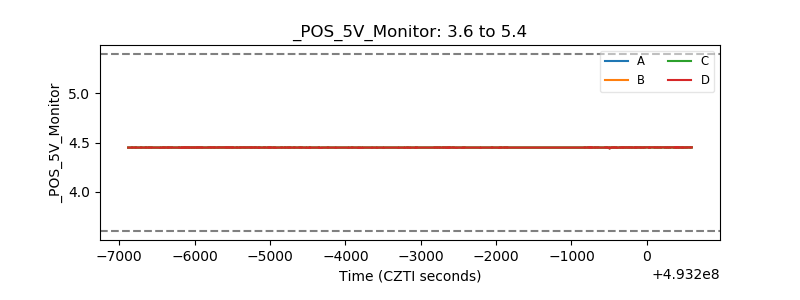 |
| _ROLL_ROT | 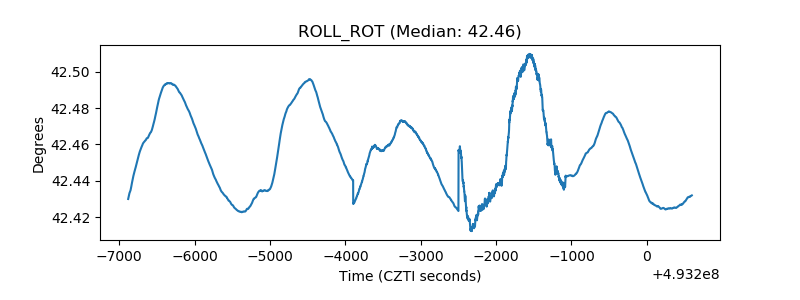 |
| _Roll_DEC | 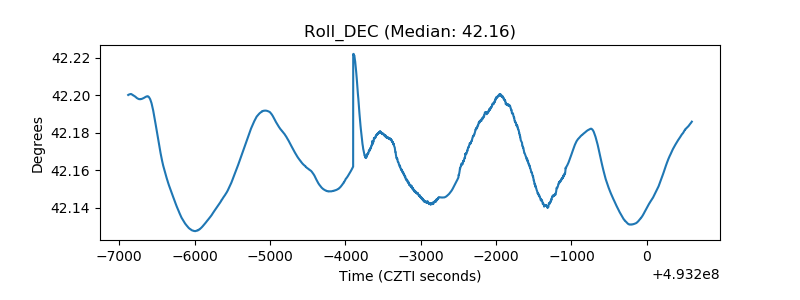 |
| _Roll_RA | 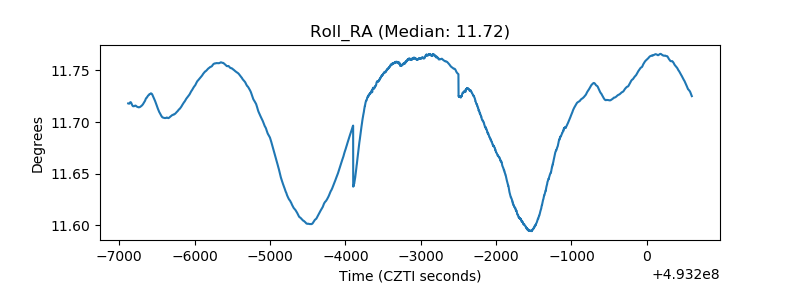 |
| Veto Counter | 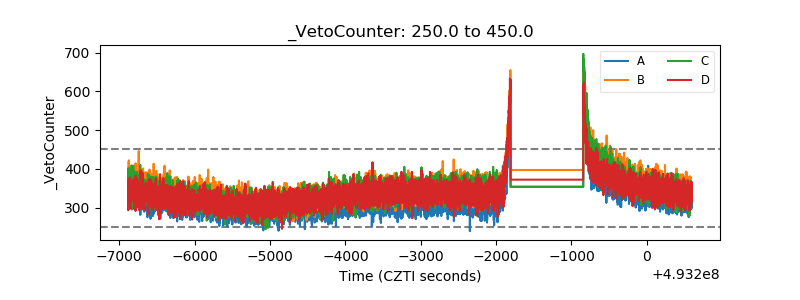 |