| Param | Original file | Final file |
|---|---|---|
| Filename | modeM0/AS1A14_002T07_9000006498_53497cztM0_level2.fits | modeM0/AS1A14_002T07_9000006498_53497cztM0_level2_quad_clean.evt |
| Size (bytes) | 813,320,640 | 79,266,240 |
| Size | 775.6 MB | 75.6 MB |
| Events in quadrant A | 11,848,879 | 333,227 |
| Events in quadrant B | 3,767,442 | 687,996 |
| Events in quadrant C | 10,651,898 | 354,531 |
| Events in quadrant D | 3,333,960 | 570,300 |
| Mode SS | |||
|---|---|---|---|
| Quadrant | BADHDUFLAG | Total packets | Discarded packets |
| A | 0 | 132 | 0 |
| B | 0 | 132 | 0 |
| C | 0 | 132 | 0 |
| D | 0 | 132 | 0 |
| Mode M9 | |||
|---|---|---|---|
| Quadrant | BADHDUFLAG | Total packets | Discarded packets |
| A | 0 | 10 | 0 |
| B | 0 | 10 | 0 |
| C | 0 | 10 | 0 |
| D | 0 | 10 | 0 |
| Mode M0 | |||
|---|---|---|---|
| Quadrant | BADHDUFLAG | Total packets | Discarded packets |
| A | 0 | 39734 | 1 |
| B | 0 | 15553 | 1 |
| C | 0 | 36054 | 1 |
| D | 0 | 14505 | 1 |
| Quadrant | Total seconds | Saturated seconds | Saturation percentage |
|---|---|---|---|
| A | 6506 | 3535 | 54.334460% |
| B | 6506 | 220 | 3.381494% |
| C | 6506 | 2839 | 43.636643% |
| D | 6506 | 136 | 2.090378% |
Noise dominated data is calculated using 1-second bins in cleaned event files. If a bin has >2000 counts, and if more than 50% of those come from <1% of pixels, then it is considered to be noise-dominated and hence unusable.
| Quadrant | # 1 sec bins | Bins with >0 counts | Bins with >2000 counts | High rate bins dominated by noise | Noise dominated (total time) | Noise dominated (detector-on time) | Marked lightcurve |
|---|---|---|---|---|---|---|---|
| A | 7541 | 6507 | 3256 | 3256 | 43.18% | 50.04% | 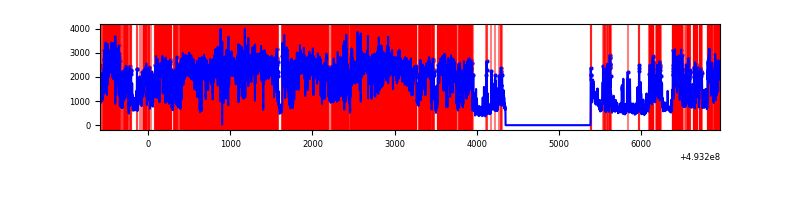 |
| B | 7541 | 6507 | 80 | 80 | 1.06% | 1.23% | 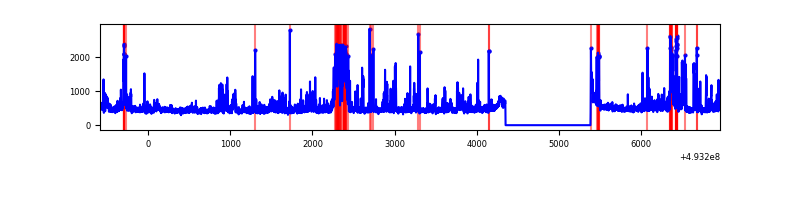 |
| C | 7541 | 6507 | 2750 | 2750 | 36.47% | 42.26% | 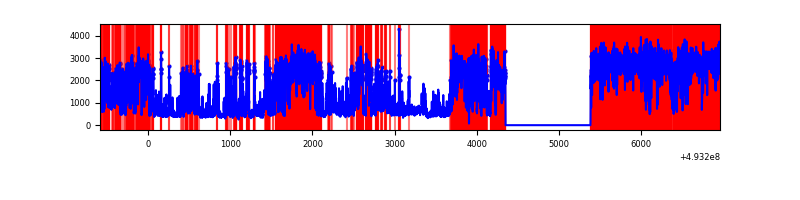 |
| D | 7541 | 6507 | 61 | 61 | 0.81% | 0.94% | 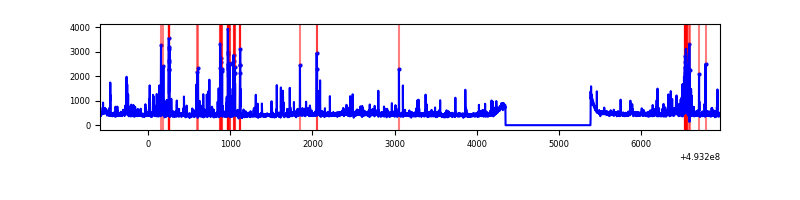 |
Top three noisy pixels from each quadrant. If the there are fewer than three noisy pixels in the level2.evt file, extra rows are filled as -1
| Pixel properties | Quadrant properties | ||||||
|---|---|---|---|---|---|---|---|
| Quadrant | DetID | PixID | Counts | Sigma | Mean | Median | Sigma |
| A | 3 | 63 | 3345378 | 25354.33 | 538 | 527 | 131.9 |
| A | 3 | 62 | 3143587 | 23824.73 | 538 | 527 | 131.9 |
| A | 15 | 174 | 3118347 | 23633.41 | 538 | 527 | 131.9 |
| B | 0 | 171 | 453498 | 2971.01 | 712 | 687 | 152.4 |
| B | 10 | 28 | 145134 | 947.75 | 712 | 687 | 152.4 |
| B | 7 | 252 | 74041 | 481.29 | 712 | 687 | 152.4 |
| C | 7 | 64 | 3890711 | 27868.08 | 510 | 506 | 139.6 |
| C | 1 | 241 | 3333152 | 23873.92 | 510 | 506 | 139.6 |
| C | 15 | 224 | 666317 | 4769.64 | 510 | 506 | 139.6 |
| D | 1 | 0 | 206522 | 1028.92 | 701 | 669 | 200.1 |
| D | 3 | 12 | 198865 | 990.65 | 701 | 669 | 200.1 |
| D | 5 | 173 | 44491 | 219.04 | 701 | 669 | 200.1 |
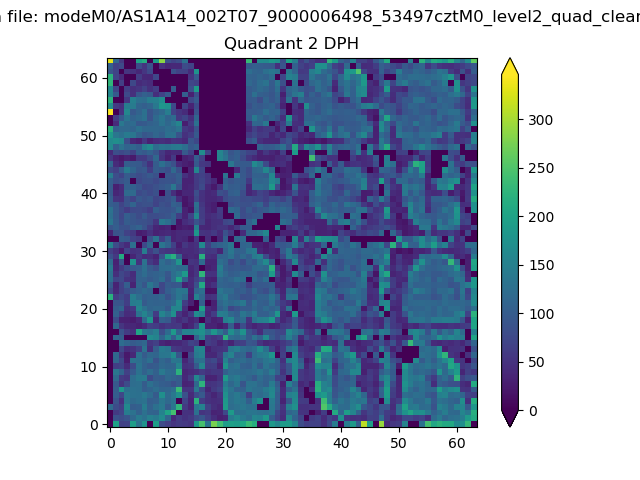
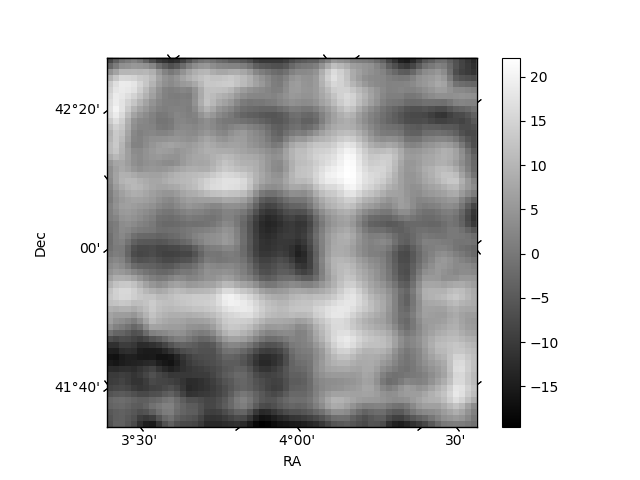
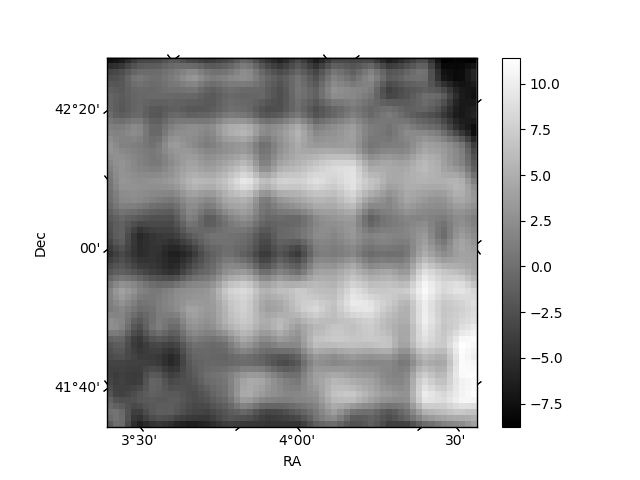
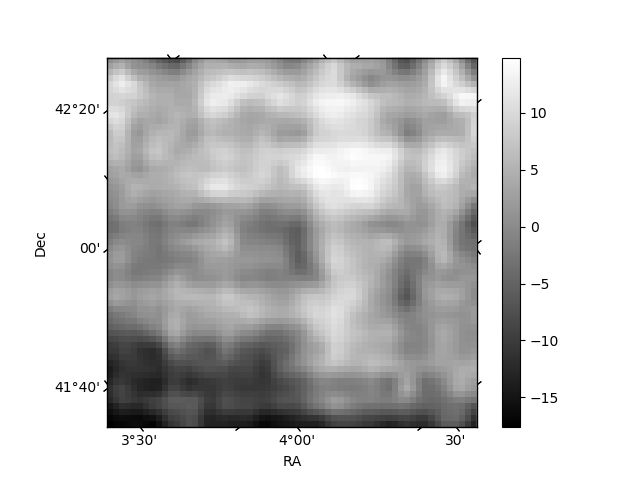
Histogram calculated using DETX and DETY for each event in the final _common_clean file
| Quadrant A | 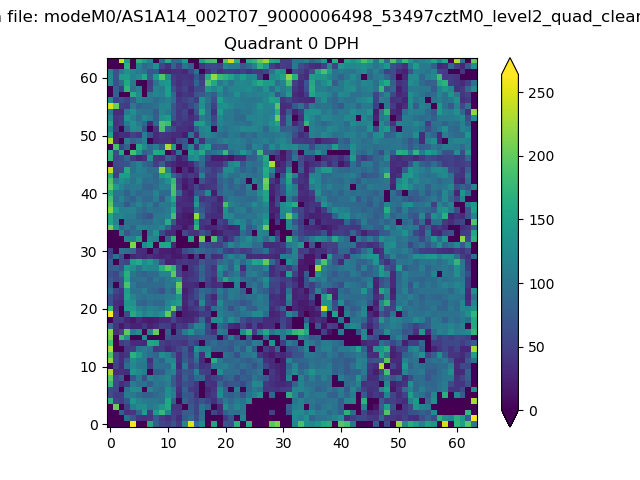 |
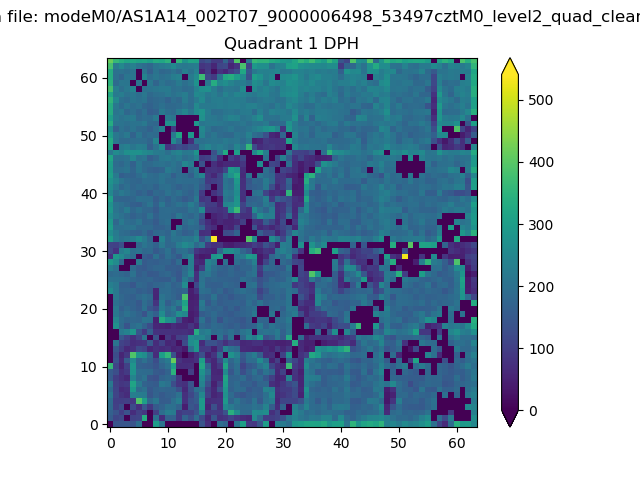 |
Quadrant B |
|---|---|---|---|
| Quadrant D | 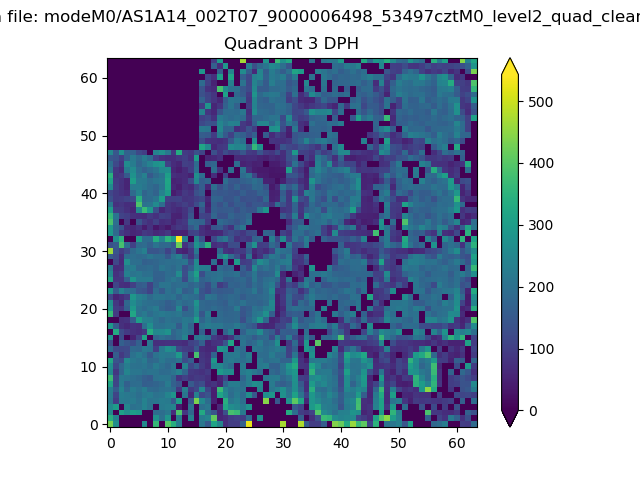 |
 |
Quadrant C |
| Plot type | Count rate plots | Images |
|---|---|---|
| Comparison with Poisson distribution Blue bars denote a histogram of data divided into 1 sec bins. Red curve is a Poisson curve with rate = median count rate of data. |
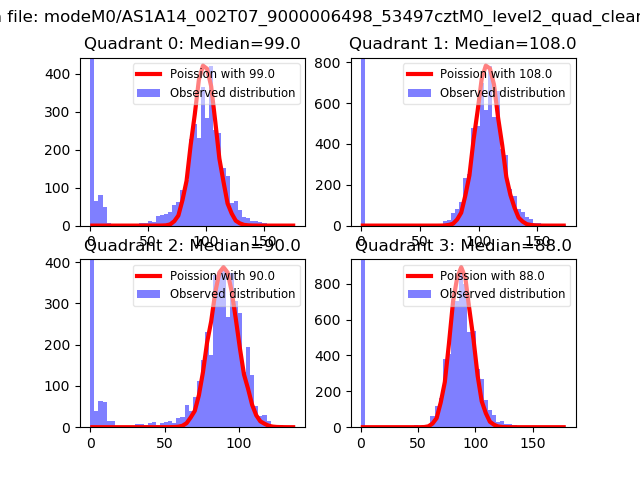 |
 |
| Quadrant-wise count rates Data is divided into 100 sec bins |
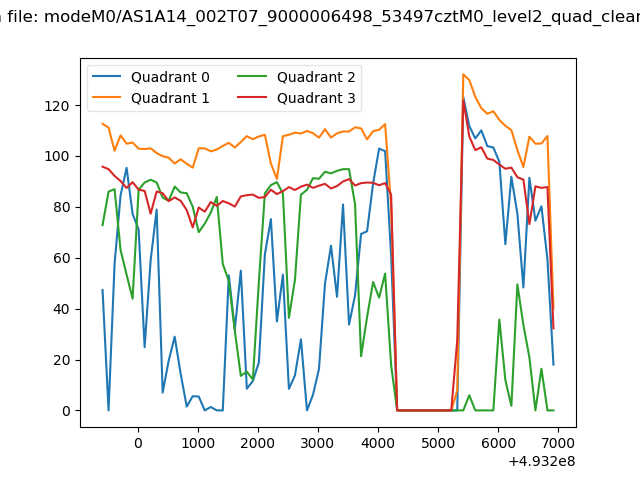 |
|
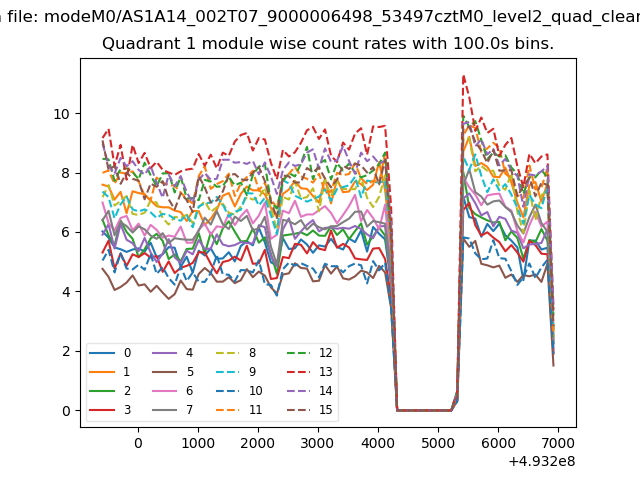
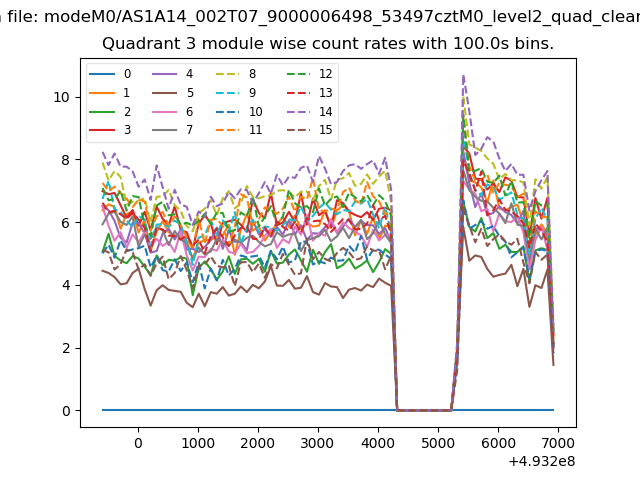
| Module-wise count rates for Quadrant A Data is divided into 100 sec bins |
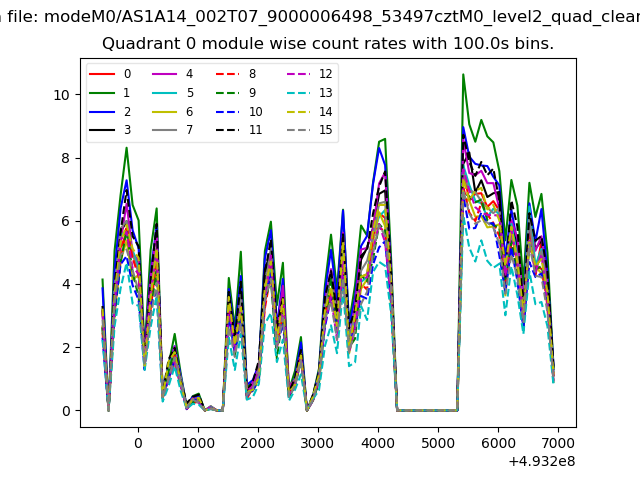 |
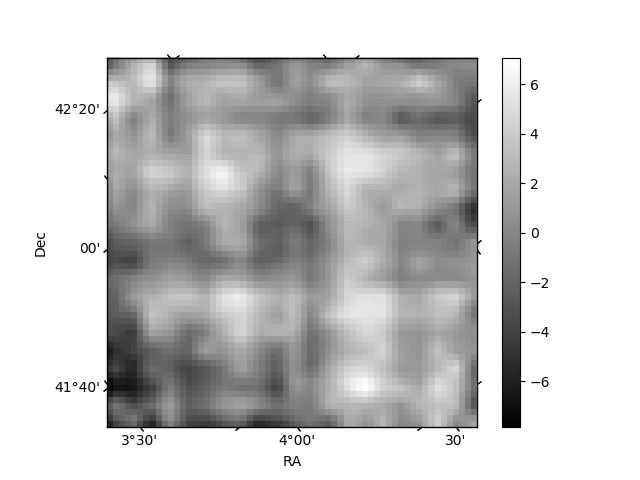 |
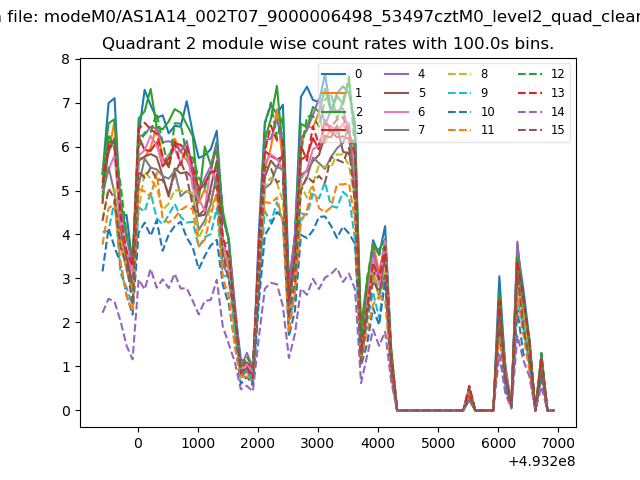
| Module-wise count rates for Quadrant B Data is divided into 100 sec bins |
 |
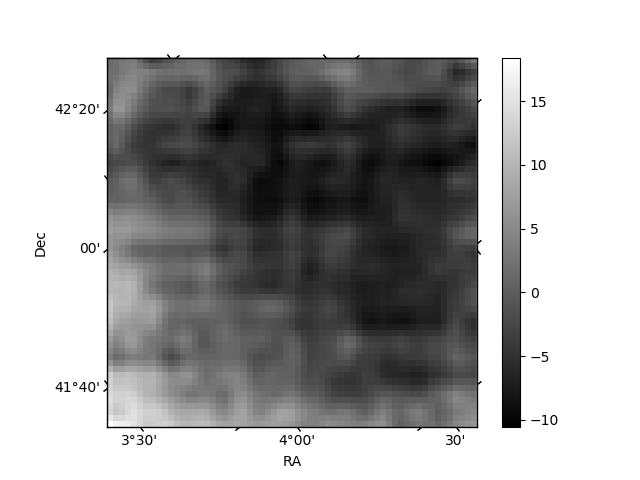 |
| Module-wise count rates for Quadrant C Data is divided into 100 sec bins |
 |
 |
| Module-wise count rates for Quadrant D Data is divided into 100 sec bins |
 |
 |
| Parameter | Plot |
|---|---|
| CZT HV Monitor | 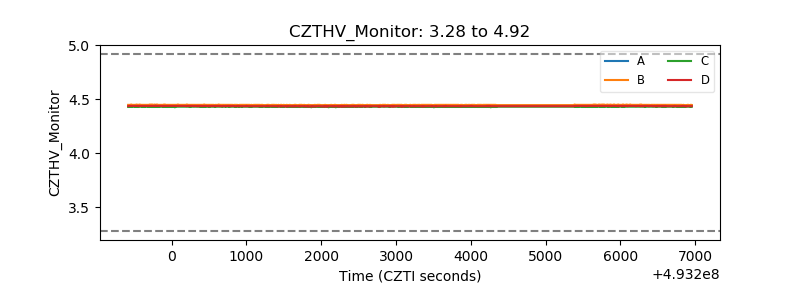 |
| D_VDD | 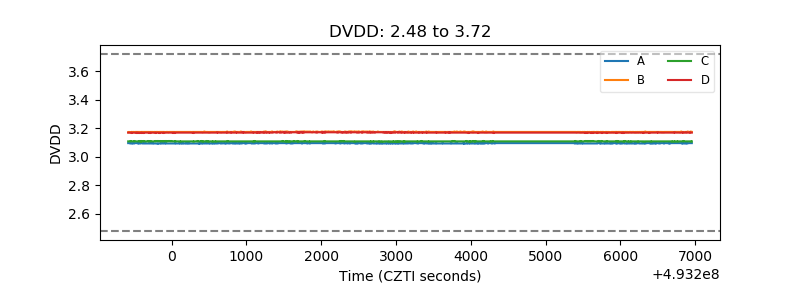 |
| Temperature 1 | 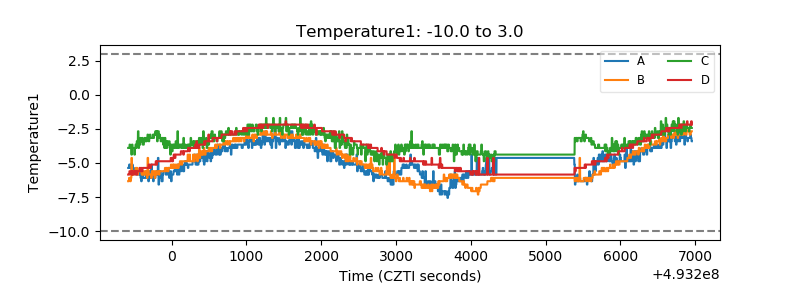 |
| Veto HV Monitor | 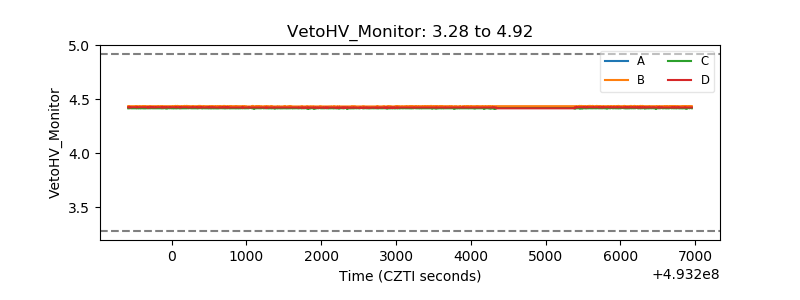 |
| Veto LLD | 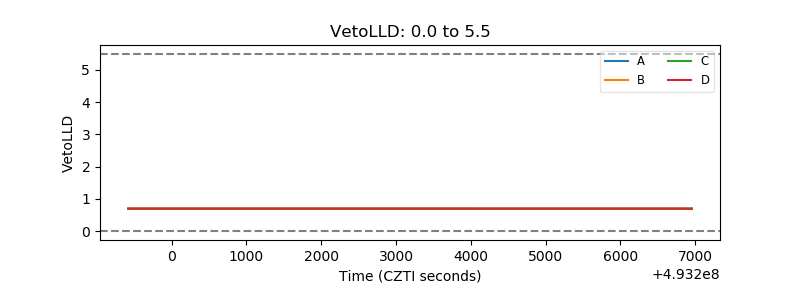 |
| Alpha Counter | 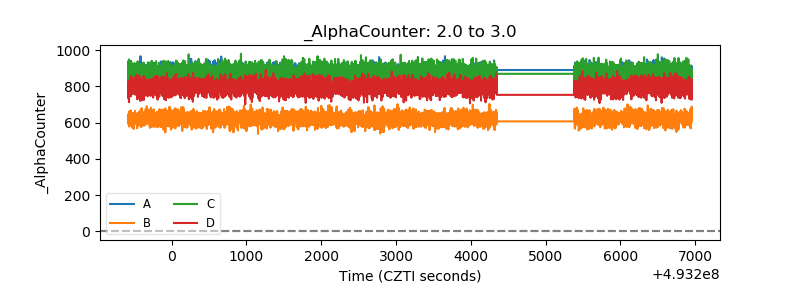 |
| _CPM_Rate | 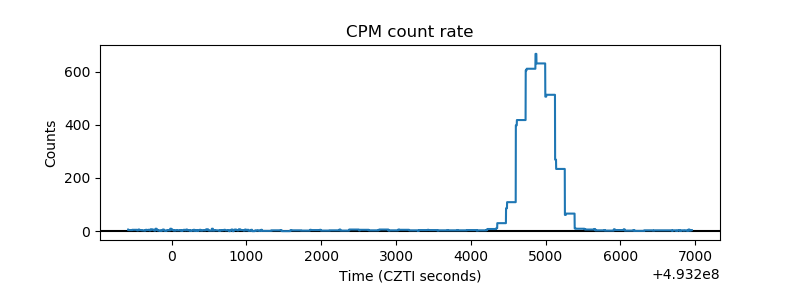 |
| CZT Counter | 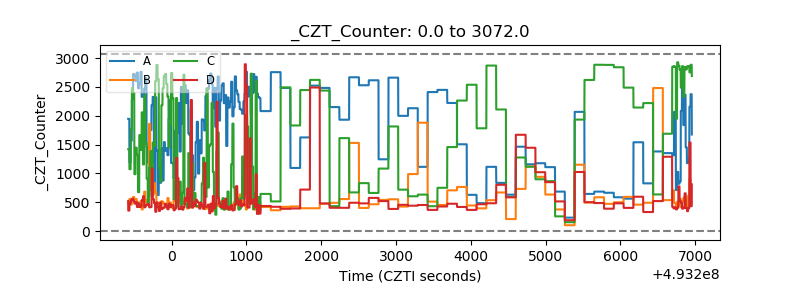 |
| +2.5 Volts monitor |  |
| +5 Volts monitor |  |
| _ROLL_ROT | 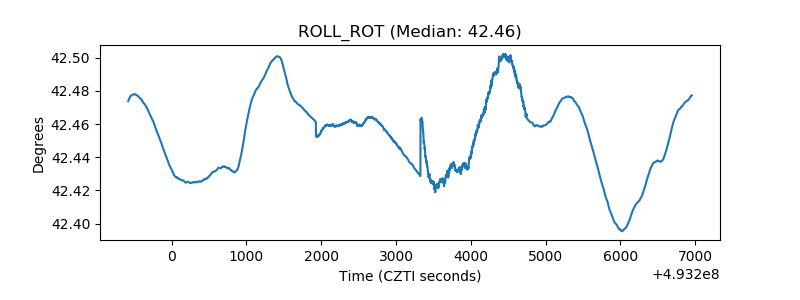 |
| _Roll_DEC | 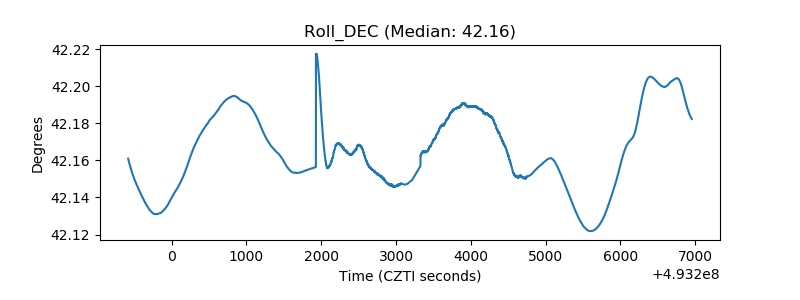 |
| _Roll_RA | 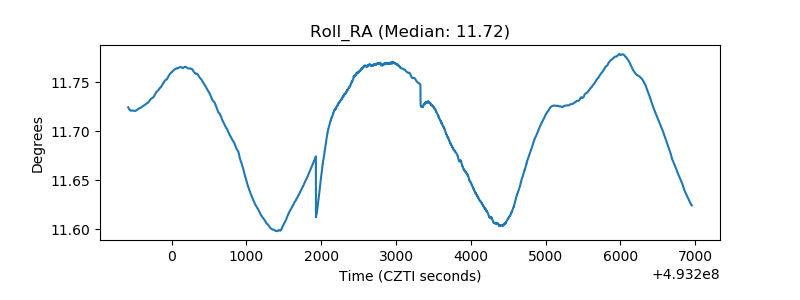 |
| Veto Counter | 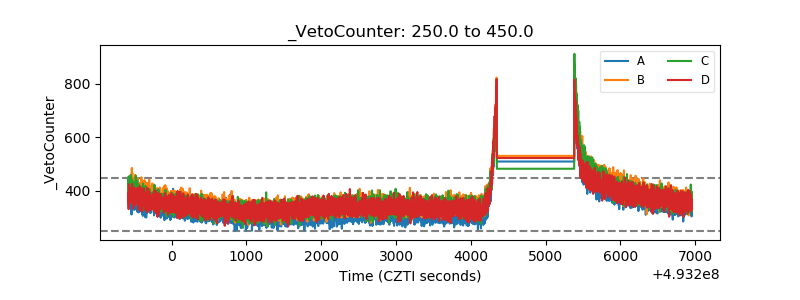 |