| Param | Original file | Final file |
|---|---|---|
| Filename | modeM0/AS1A14_002T07_9000006498_53498cztM0_level2.fits | modeM0/AS1A14_002T07_9000006498_53498cztM0_level2_quad_clean.evt |
| Size (bytes) | 897,471,360 | 83,684,160 |
| Size | 855.9 MB | 79.8 MB |
| Events in quadrant A | 11,282,279 | 440,143 |
| Events in quadrant B | 4,924,835 | 704,612 |
| Events in quadrant C | 12,940,500 | 309,751 |
| Events in quadrant D | 3,556,240 | 613,195 |
| Mode SS | |||
|---|---|---|---|
| Quadrant | BADHDUFLAG | Total packets | Discarded packets |
| A | 0 | 134 | 0 |
| B | 0 | 134 | 0 |
| C | 0 | 134 | 0 |
| D | 0 | 134 | 0 |
| Mode M9 | |||
|---|---|---|---|
| Quadrant | BADHDUFLAG | Total packets | Discarded packets |
| A | 0 | 13 | 0 |
| B | 0 | 13 | 0 |
| C | 0 | 14 | 0 |
| D | 0 | 14 | 0 |
| Mode M0 | |||
|---|---|---|---|
| Quadrant | BADHDUFLAG | Total packets | Discarded packets |
| A | 0 | 38161 | 2 |
| B | 0 | 19014 | 2 |
| C | 0 | 42997 | 2 |
| D | 0 | 15039 | 2 |
| Quadrant | Total seconds | Saturated seconds | Saturation percentage |
|---|---|---|---|
| A | 6689 | 2917 | 43.608910% |
| B | 6689 | 641 | 9.582897% |
| C | 6689 | 3815 | 57.033936% |
| D | 6689 | 128 | 1.913589% |
Noise dominated data is calculated using 1-second bins in cleaned event files. If a bin has >2000 counts, and if more than 50% of those come from <1% of pixels, then it is considered to be noise-dominated and hence unusable.
| Quadrant | # 1 sec bins | Bins with >0 counts | Bins with >2000 counts | High rate bins dominated by noise | Noise dominated (total time) | Noise dominated (detector-on time) | Marked lightcurve |
|---|---|---|---|---|---|---|---|
| A | 7819 | 6690 | 2611 | 2611 | 33.39% | 39.03% | 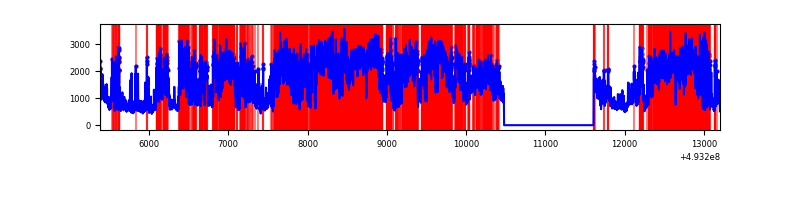 |
| B | 7819 | 6690 | 425 | 425 | 5.44% | 6.35% | 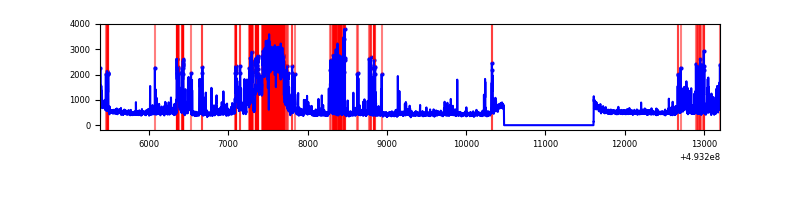 |
| C | 7819 | 6690 | 3699 | 3699 | 47.31% | 55.29% | 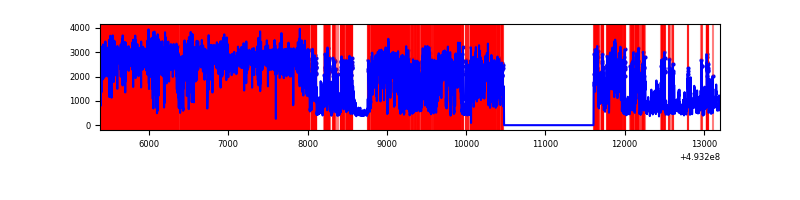 |
| D | 7819 | 6690 | 40 | 40 | 0.51% | 0.60% | 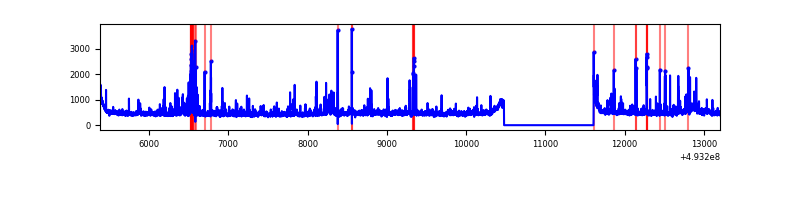 |
Top three noisy pixels from each quadrant. If the there are fewer than three noisy pixels in the level2.evt file, extra rows are filled as -1
| Pixel properties | Quadrant properties | ||||||
|---|---|---|---|---|---|---|---|
| Quadrant | DetID | PixID | Counts | Sigma | Mean | Median | Sigma |
| A | 3 | 63 | 5067036 | 31494.49 | 657 | 640 | 160.9 |
| A | 3 | 62 | 2920772 | 18152.56 | 657 | 640 | 160.9 |
| A | 15 | 174 | 555924 | 3451.84 | 657 | 640 | 160.9 |
| B | 0 | 171 | 1553120 | 9709.42 | 744 | 718 | 159.9 |
| B | 4 | 206 | 165627 | 1031.41 | 744 | 718 | 159.9 |
| B | 4 | 170 | 75272 | 466.29 | 744 | 718 | 159.9 |
| C | 1 | 241 | 5323421 | 39266.8 | 495 | 491 | 135.6 |
| C | 7 | 64 | 3985892 | 29399.96 | 495 | 491 | 135.6 |
| C | 14 | 246 | 759332 | 5597.91 | 495 | 491 | 135.6 |
| D | 1 | 0 | 186080 | 871.04 | 749 | 715 | 212.8 |
| D | 2 | 120 | 156470 | 731.9 | 749 | 715 | 212.8 |
| D | 3 | 12 | 88183 | 411.02 | 749 | 715 | 212.8 |
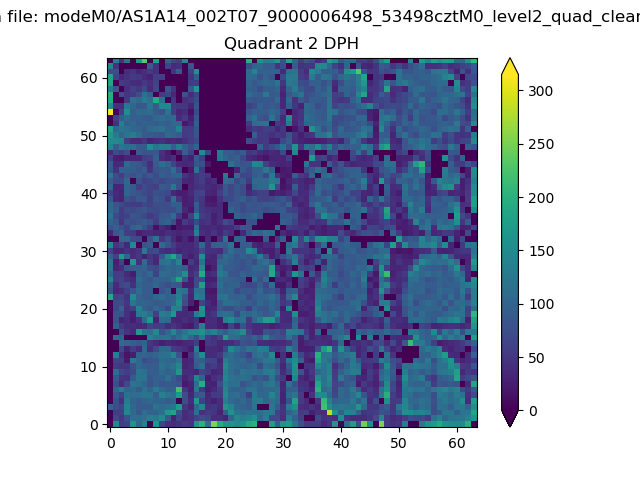
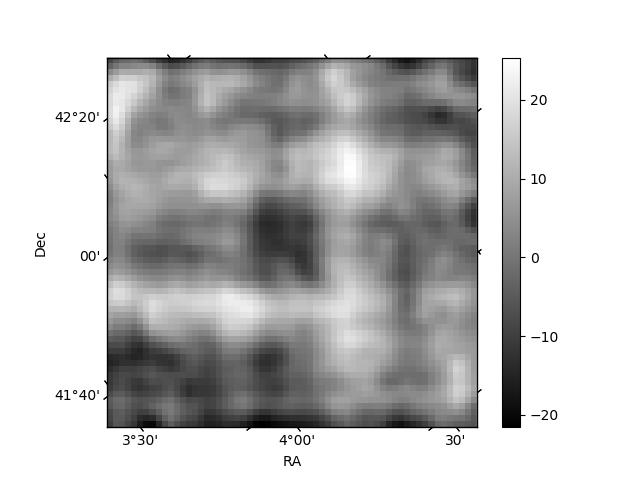
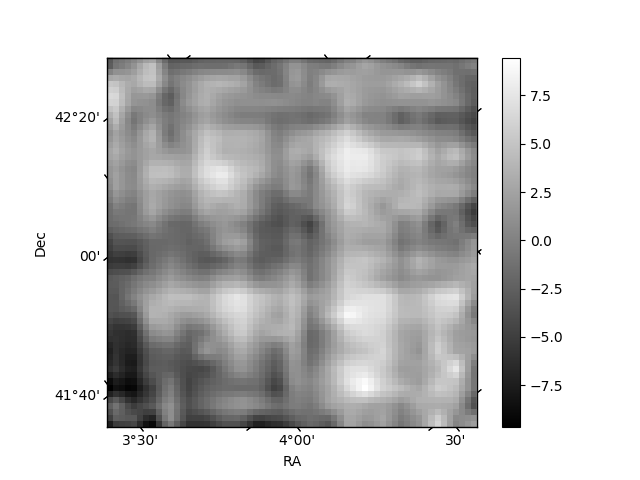
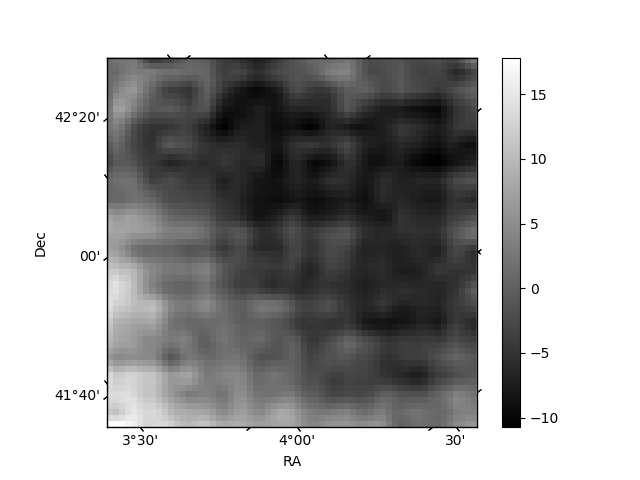
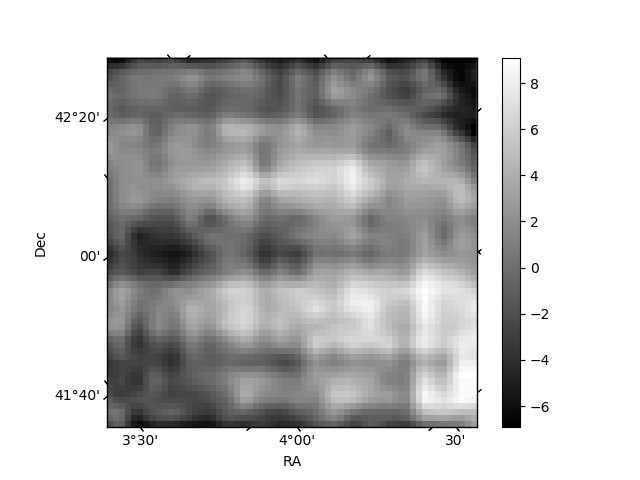
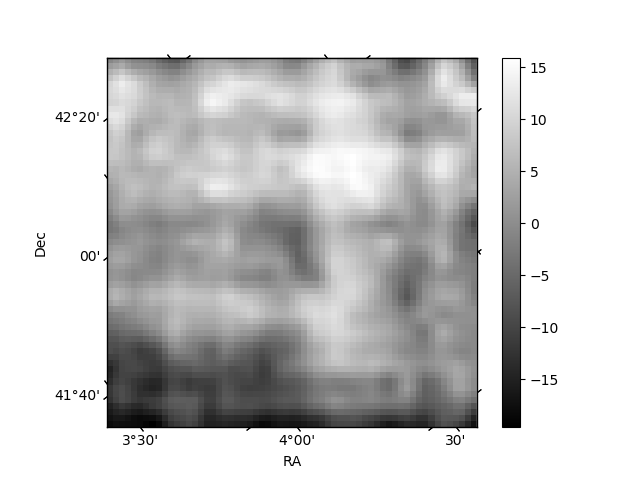
Histogram calculated using DETX and DETY for each event in the final _common_clean file
| Quadrant A | 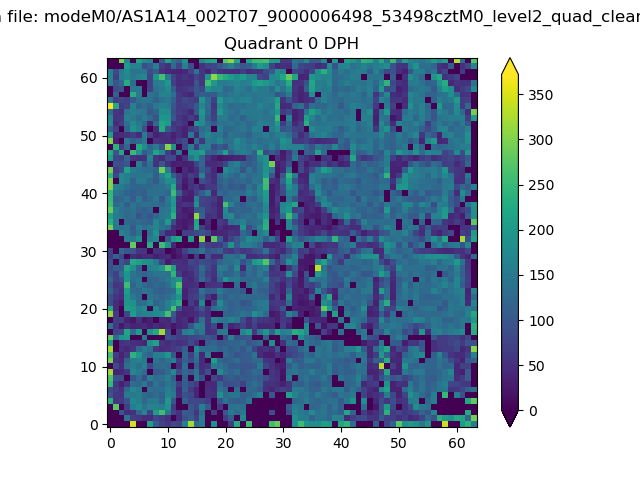 |
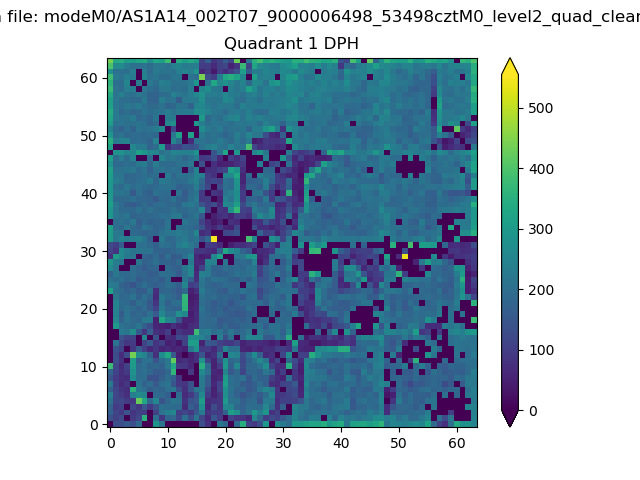 |
Quadrant B |
|---|---|---|---|
| Quadrant D | 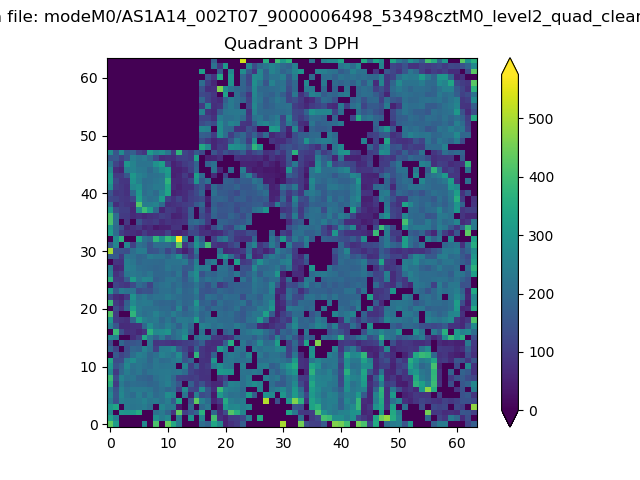 |
 |
Quadrant C |
| Plot type | Count rate plots | Images |
|---|---|---|
| Comparison with Poisson distribution Blue bars denote a histogram of data divided into 1 sec bins. Red curve is a Poisson curve with rate = median count rate of data. |
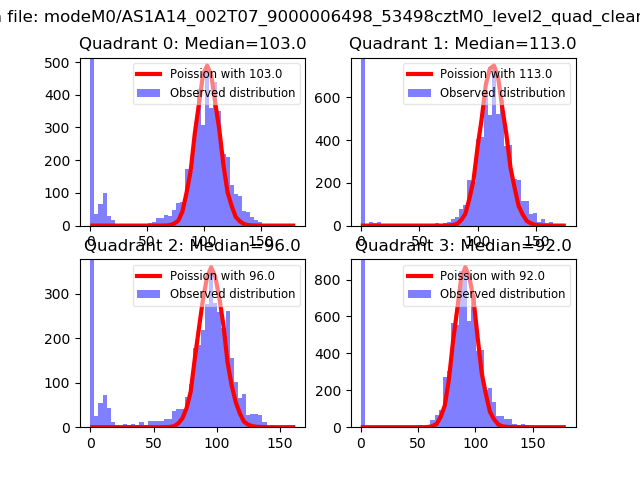 |
 |
| Quadrant-wise count rates Data is divided into 100 sec bins |
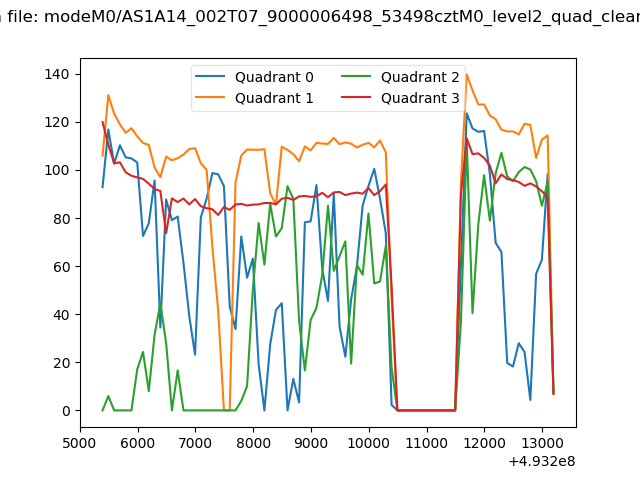 |
|
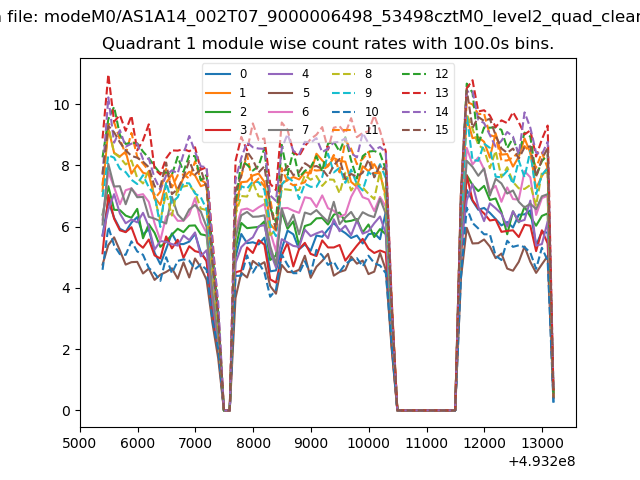
| Module-wise count rates for Quadrant A Data is divided into 100 sec bins |
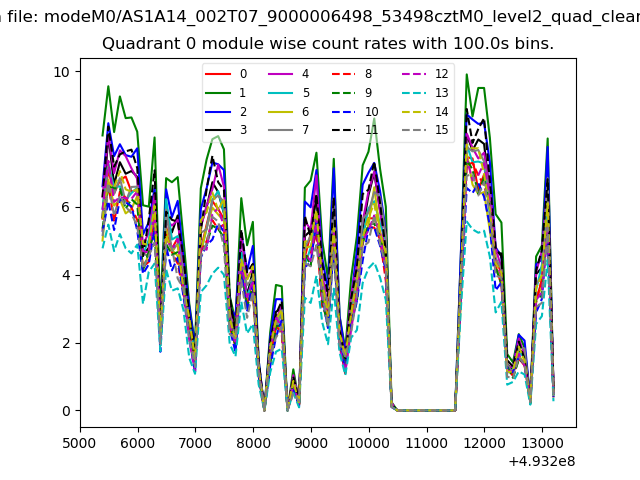 |
 |
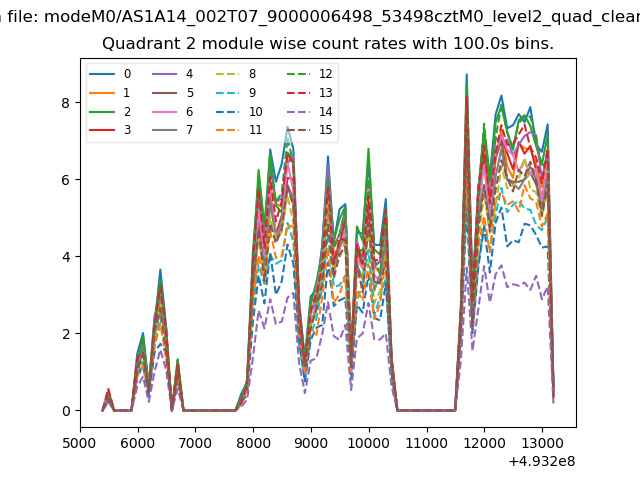
| Module-wise count rates for Quadrant B Data is divided into 100 sec bins |
 |
 |
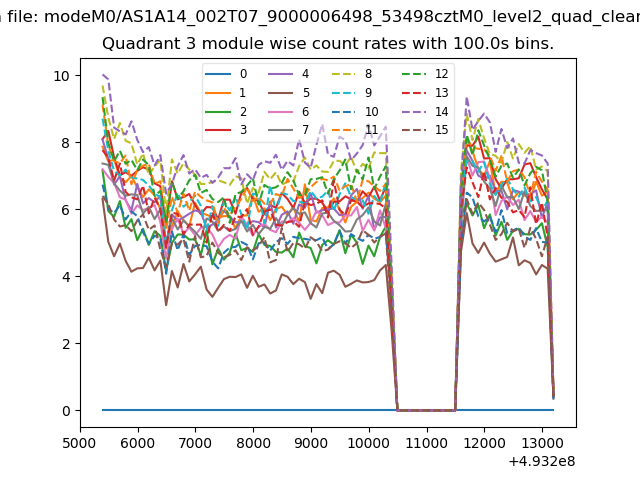
| Module-wise count rates for Quadrant C Data is divided into 100 sec bins |
 |
 |
| Module-wise count rates for Quadrant D Data is divided into 100 sec bins |
 |
 |
| Parameter | Plot |
|---|---|
| CZT HV Monitor | 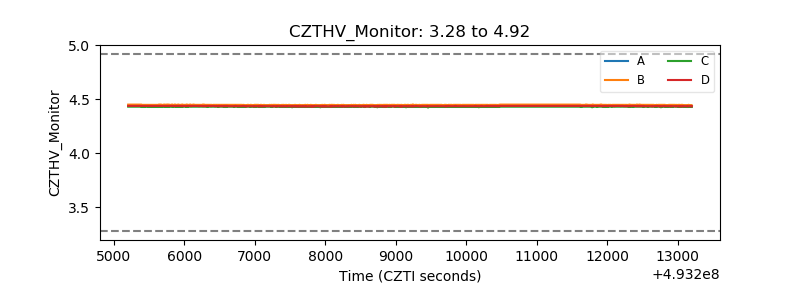 |
| D_VDD | 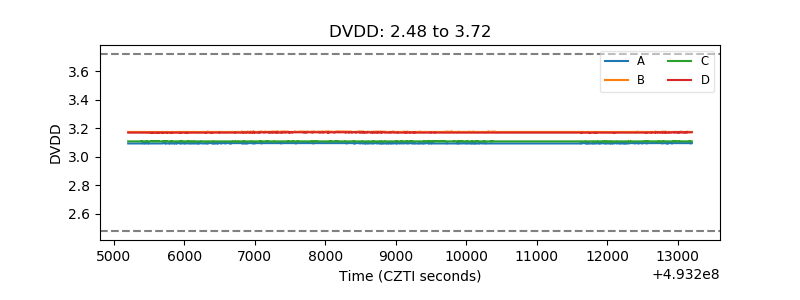 |
| Temperature 1 | 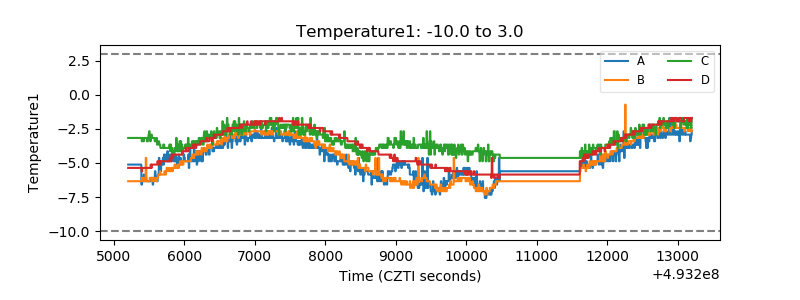 |
| Veto HV Monitor | 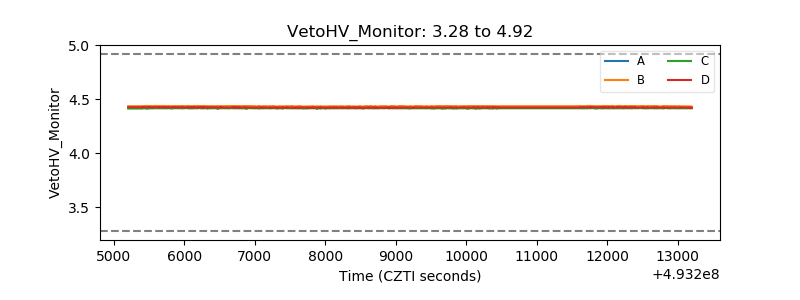 |
| Veto LLD | 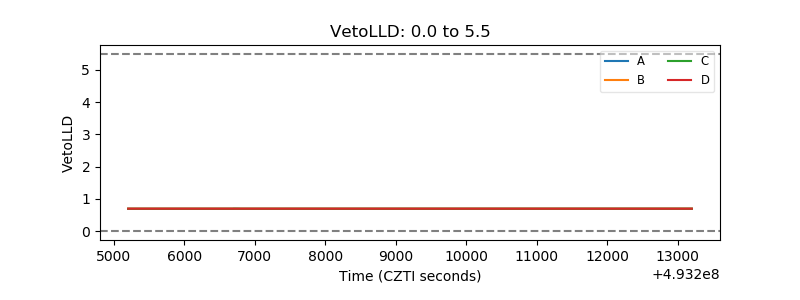 |
| Alpha Counter | 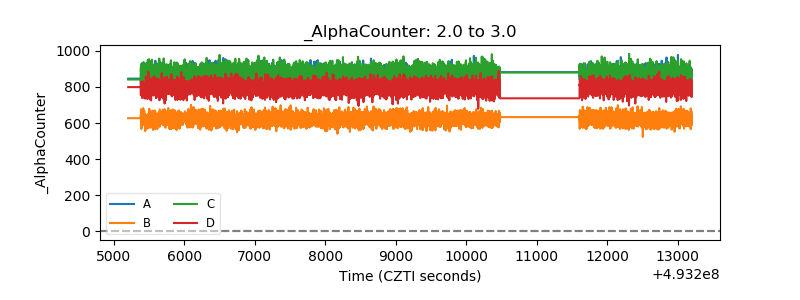 |
| _CPM_Rate | 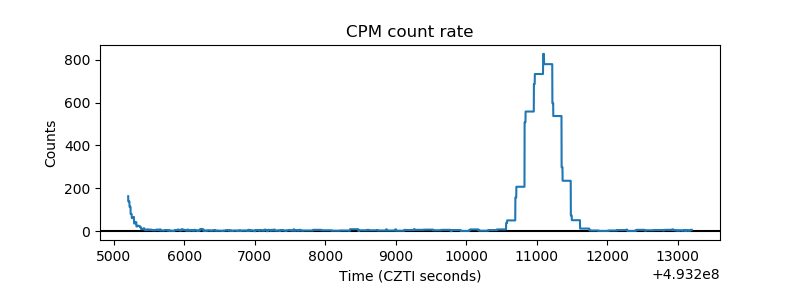 |
| CZT Counter | 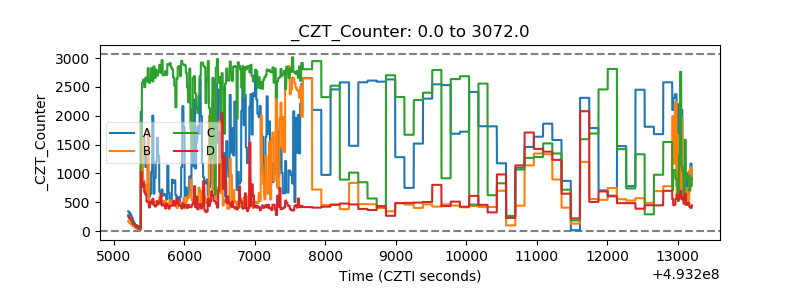 |
| +2.5 Volts monitor | 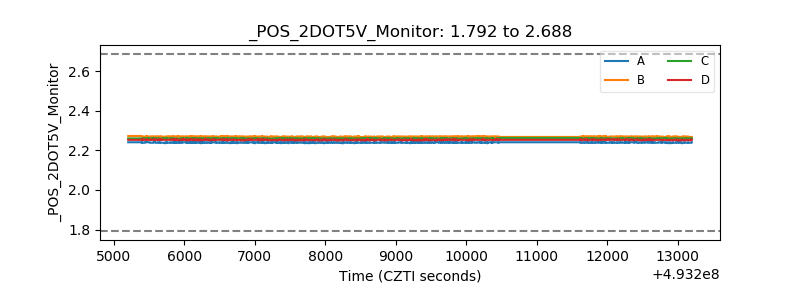 |
| +5 Volts monitor | 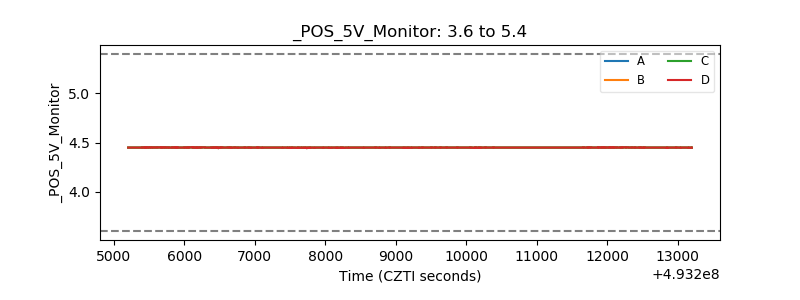 |
| _ROLL_ROT | 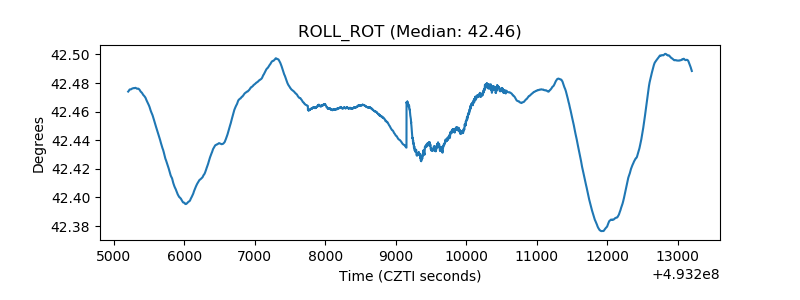 |
| _Roll_DEC | 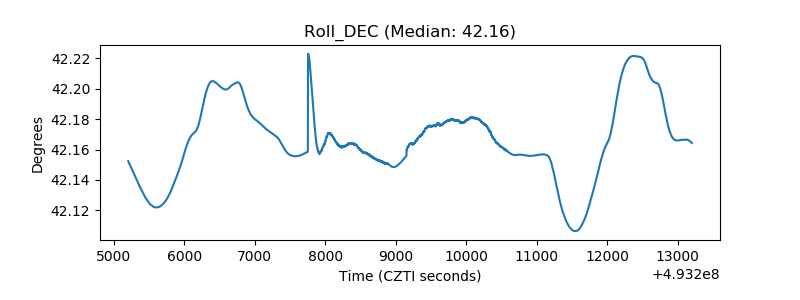 |
| _Roll_RA | 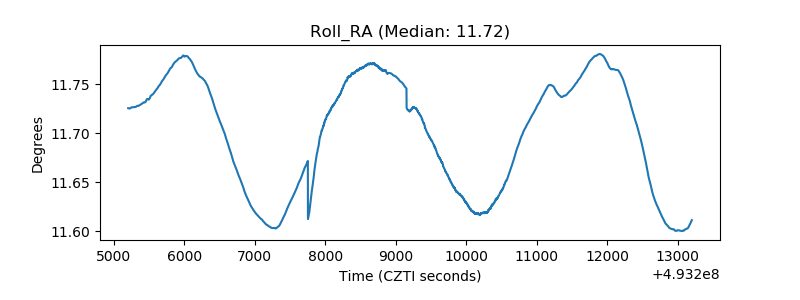 |
| Veto Counter | 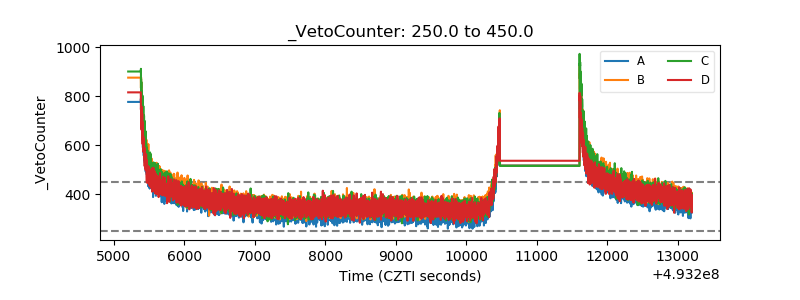 |