| Param | Original file | Final file |
|---|---|---|
| Filename | modeM0/AS1A14_002T07_9000006498_53500cztM0_level2.fits | modeM0/AS1A14_002T07_9000006498_53500cztM0_level2_quad_clean.evt |
| Size (bytes) | 888,073,920 | 87,045,120 |
| Size | 846.9 MB | 83.0 MB |
| Events in quadrant A | 8,411,007 | 598,344 |
| Events in quadrant B | 5,417,651 | 718,634 |
| Events in quadrant C | 13,719,308 | 260,758 |
| Events in quadrant D | 4,807,675 | 590,493 |
| Mode SS | |||
|---|---|---|---|
| Quadrant | BADHDUFLAG | Total packets | Discarded packets |
| A | 0 | 136 | 0 |
| B | 0 | 136 | 0 |
| C | 0 | 136 | 0 |
| D | 0 | 136 | 0 |
| Mode M9 | |||
|---|---|---|---|
| Quadrant | BADHDUFLAG | Total packets | Discarded packets |
| A | 0 | 13 | 0 |
| B | 0 | 13 | 0 |
| C | 0 | 14 | 0 |
| D | 0 | 14 | 0 |
| Mode M0 | |||
|---|---|---|---|
| Quadrant | BADHDUFLAG | Total packets | Discarded packets |
| A | 0 | 29751 | 2 |
| B | 0 | 20558 | 2 |
| C | 0 | 45388 | 5 |
| D | 0 | 18755 | 2 |
| Quadrant | Total seconds | Saturated seconds | Saturation percentage |
|---|---|---|---|
| A | 6701 | 1372 | 20.474556% |
| B | 6701 | 665 | 9.923892% |
| C | 6700 | 4392 | 65.552239% |
| D | 6700 | 466 | 6.955224% |
Noise dominated data is calculated using 1-second bins in cleaned event files. If a bin has >2000 counts, and if more than 50% of those come from <1% of pixels, then it is considered to be noise-dominated and hence unusable.
| Quadrant | # 1 sec bins | Bins with >0 counts | Bins with >2000 counts | High rate bins dominated by noise | Noise dominated (total time) | Noise dominated (detector-on time) | Marked lightcurve |
|---|---|---|---|---|---|---|---|
| A | 7831 | 6702 | 1059 | 1059 | 13.52% | 15.80% | 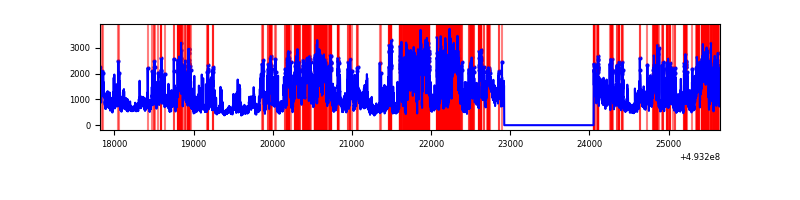 |
| B | 7831 | 6702 | 246 | 246 | 3.14% | 3.67% | 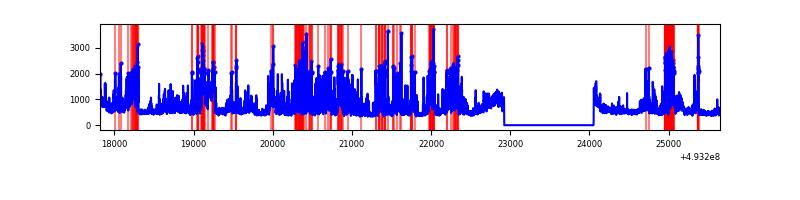 |
| C | 7830 | 6701 | 4006 | 4006 | 51.16% | 59.78% | 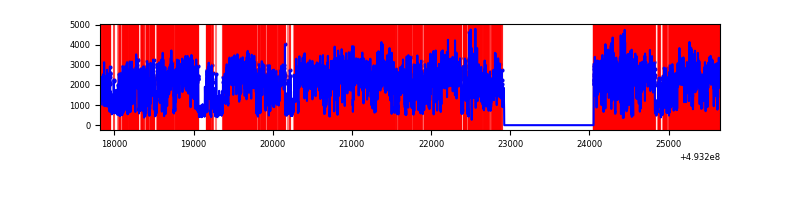 |
| D | 7830 | 6701 | 315 | 315 | 4.02% | 4.70% | 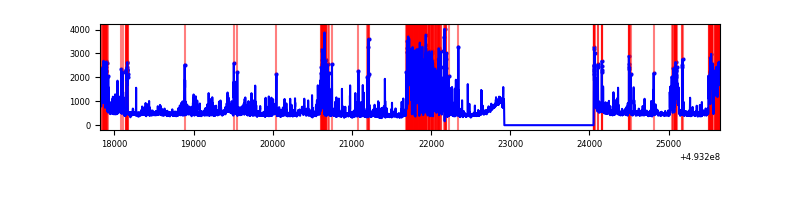 |
Top three noisy pixels from each quadrant. If the there are fewer than three noisy pixels in the level2.evt file, extra rows are filled as -1
| Pixel properties | Quadrant properties | ||||||
|---|---|---|---|---|---|---|---|
| Quadrant | DetID | PixID | Counts | Sigma | Mean | Median | Sigma |
| A | 3 | 63 | 3022348 | 16771.68 | 741 | 725 | 180.2 |
| A | 15 | 174 | 1636212 | 9077.86 | 741 | 725 | 180.2 |
| A | 3 | 62 | 703733 | 3902.08 | 741 | 725 | 180.2 |
| B | 4 | 206 | 1359867 | 8323.02 | 760 | 733 | 163.3 |
| B | 4 | 171 | 492076 | 3008.87 | 760 | 733 | 163.3 |
| B | 0 | 171 | 207987 | 1269.18 | 760 | 733 | 163.3 |
| C | 7 | 64 | 10218174 | 74330.4 | 502 | 500 | 137.5 |
| C | 1 | 241 | 930041 | 6762.12 | 502 | 500 | 137.5 |
| C | 15 | 224 | 160288 | 1162.41 | 502 | 500 | 137.5 |
| D | 7 | 110 | 832118 | 3910.95 | 750 | 718 | 212.6 |
| D | 9 | 49 | 328357 | 1541.23 | 750 | 718 | 212.6 |
| D | 3 | 12 | 178674 | 837.12 | 750 | 718 | 212.6 |
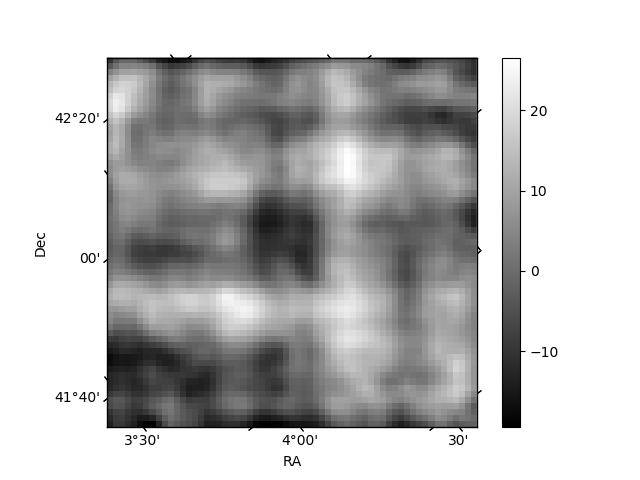
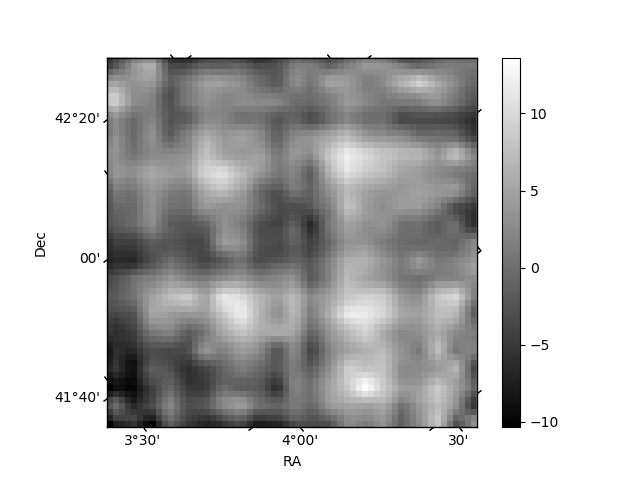
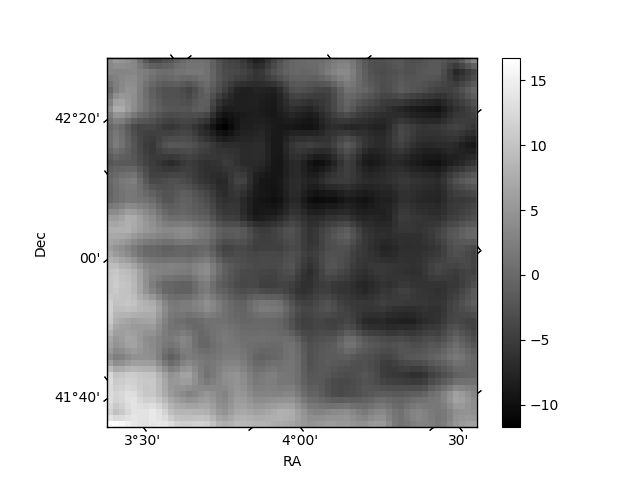
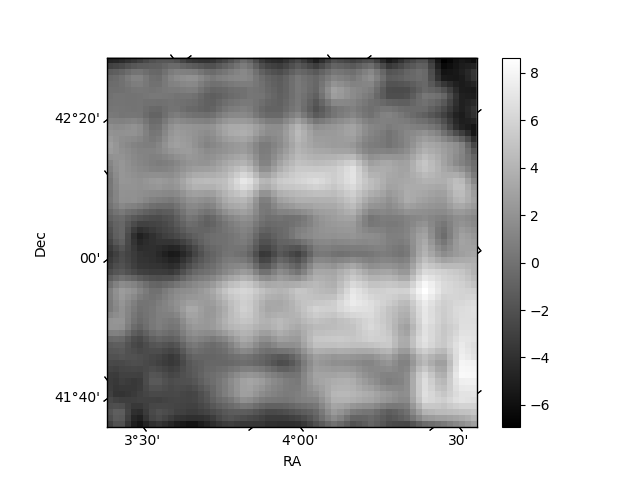
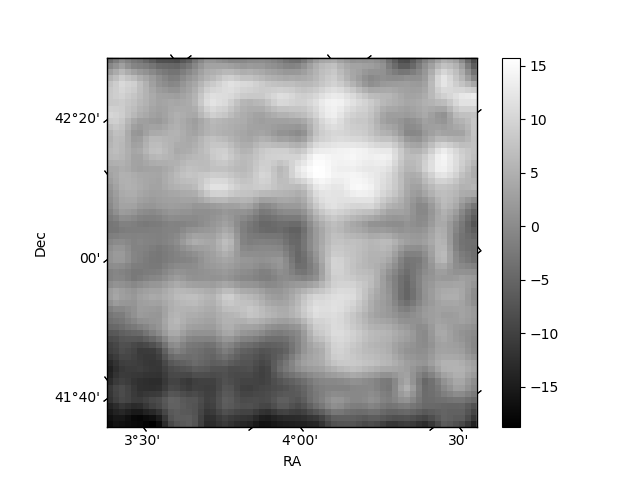
Histogram calculated using DETX and DETY for each event in the final _common_clean file
| Quadrant A | 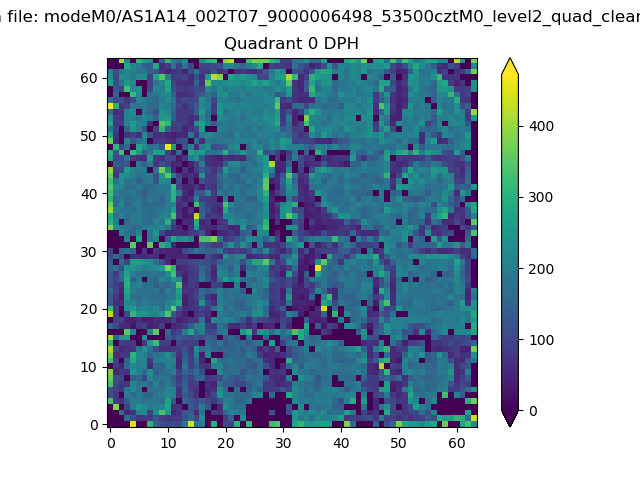 |
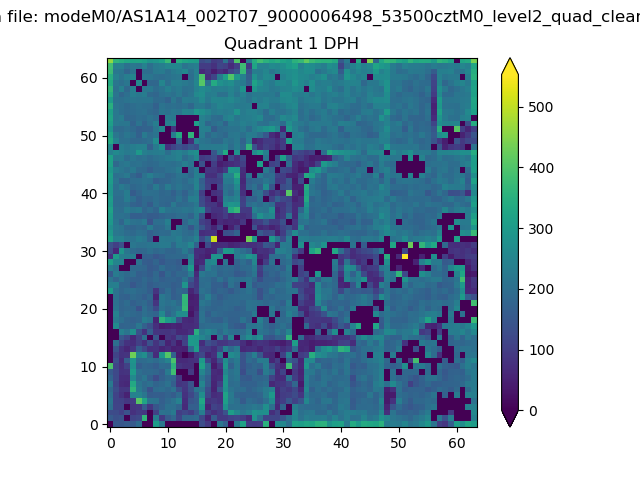 |
Quadrant B |
|---|---|---|---|
| Quadrant D | 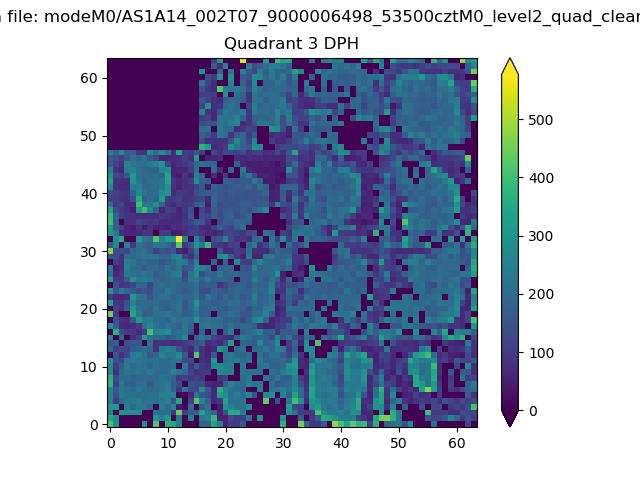 |
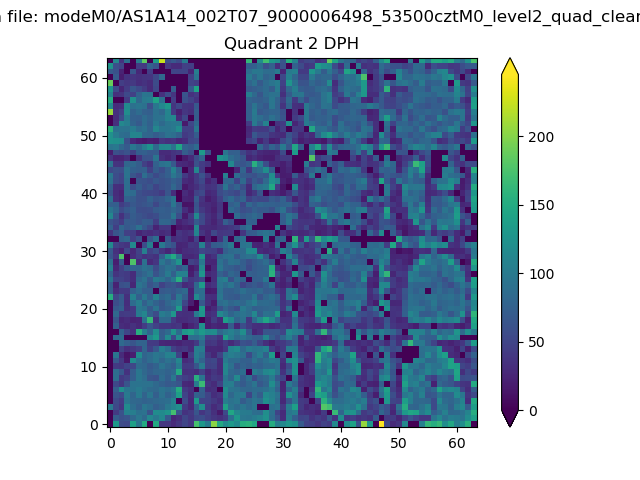 |
Quadrant C |
| Plot type | Count rate plots | Images |
|---|---|---|
| Comparison with Poisson distribution Blue bars denote a histogram of data divided into 1 sec bins. Red curve is a Poisson curve with rate = median count rate of data. |
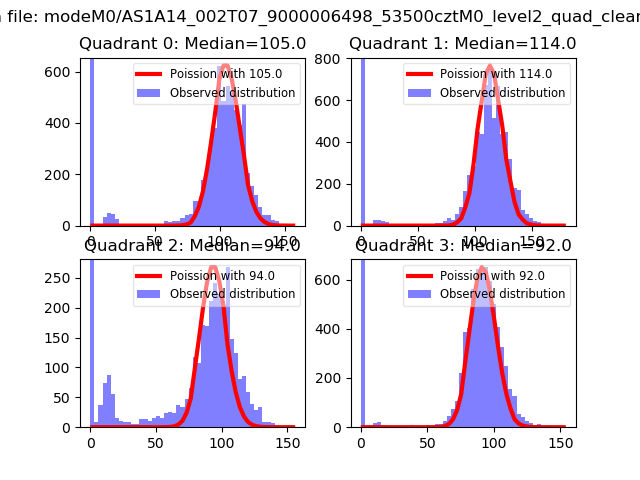 |
 |
| Quadrant-wise count rates Data is divided into 100 sec bins |
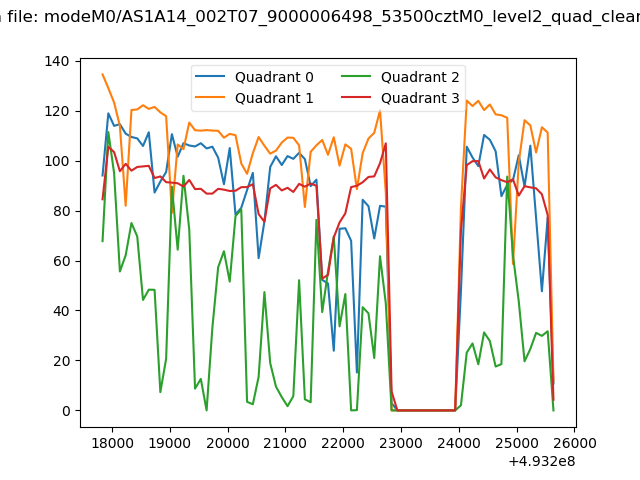 |
|
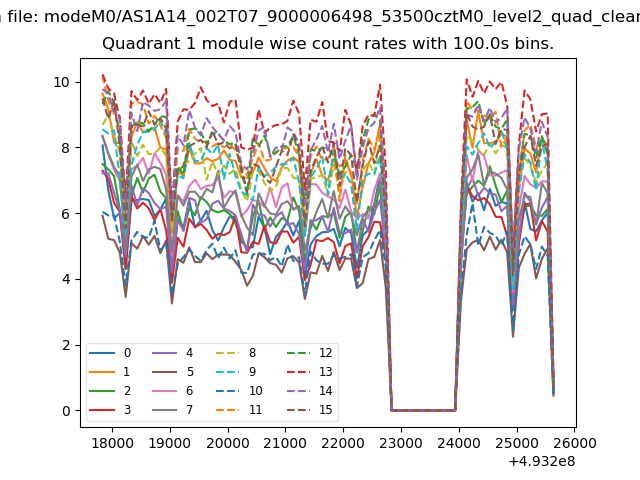
| Module-wise count rates for Quadrant A Data is divided into 100 sec bins |
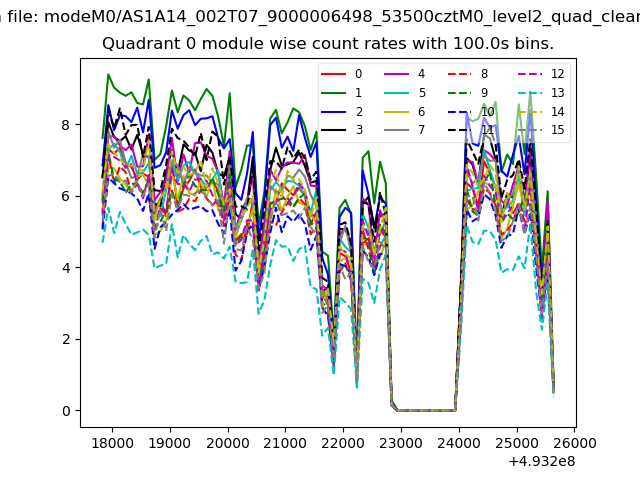 |
 |
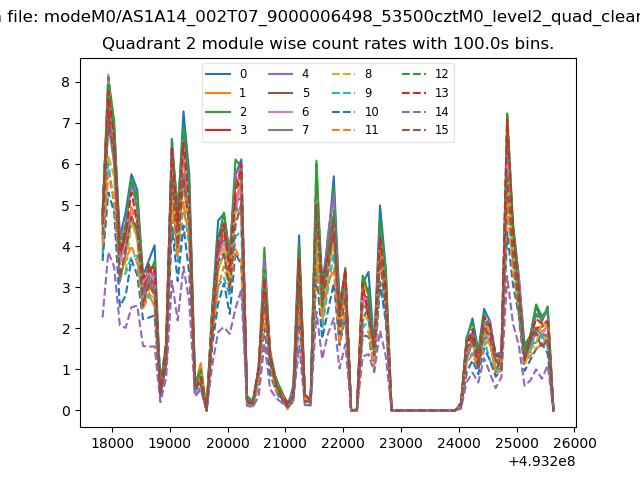
| Module-wise count rates for Quadrant B Data is divided into 100 sec bins |
 |
 |
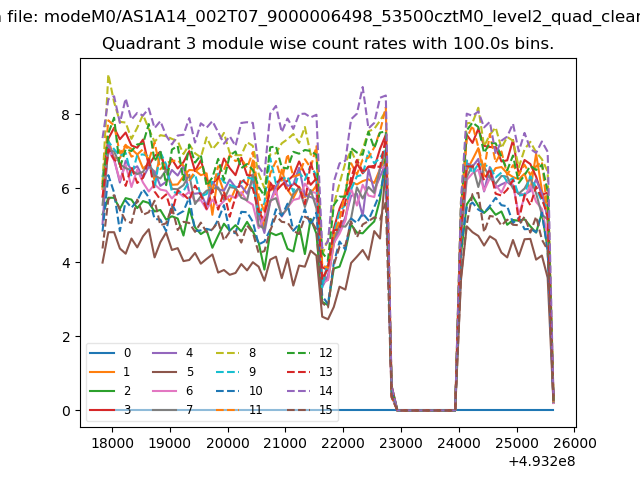
| Module-wise count rates for Quadrant C Data is divided into 100 sec bins |
 |
 |
| Module-wise count rates for Quadrant D Data is divided into 100 sec bins |
 |
 |
| Parameter | Plot |
|---|---|
| CZT HV Monitor | 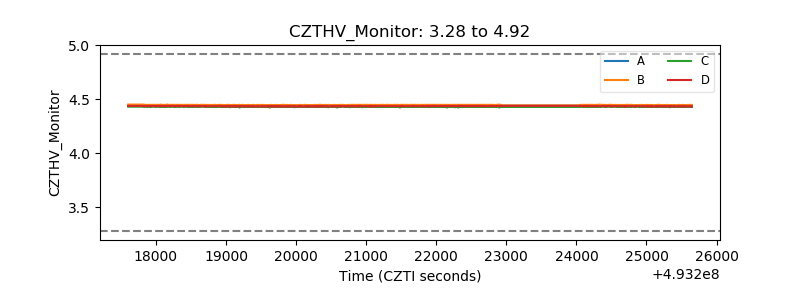 |
| D_VDD | 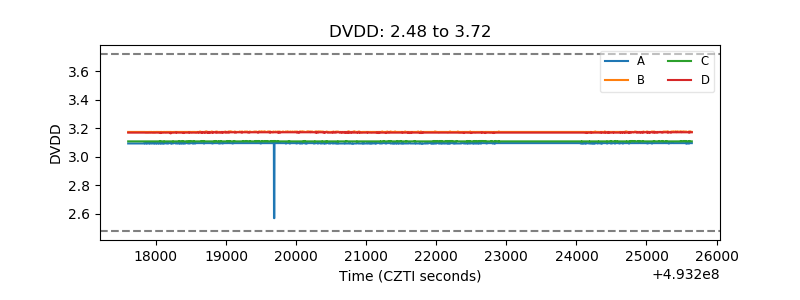 |
| Temperature 1 | 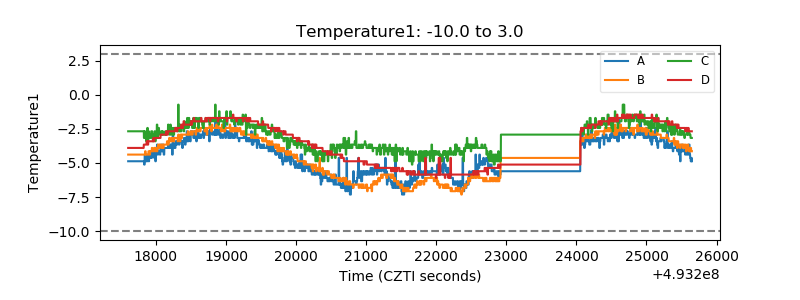 |
| Veto HV Monitor | 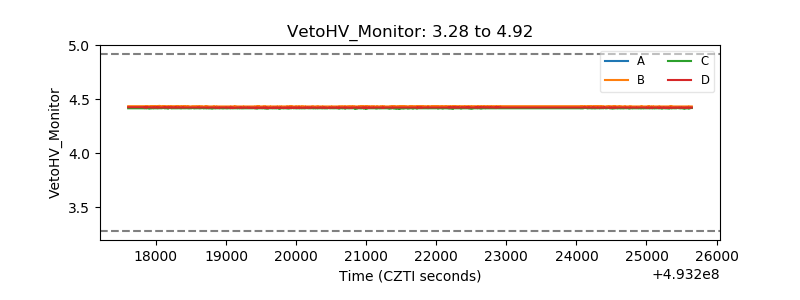 |
| Veto LLD | 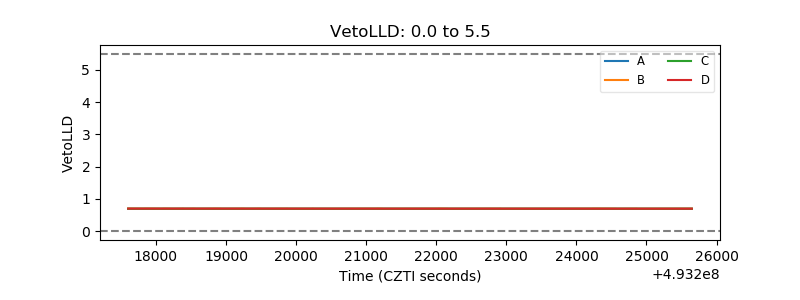 |
| Alpha Counter | 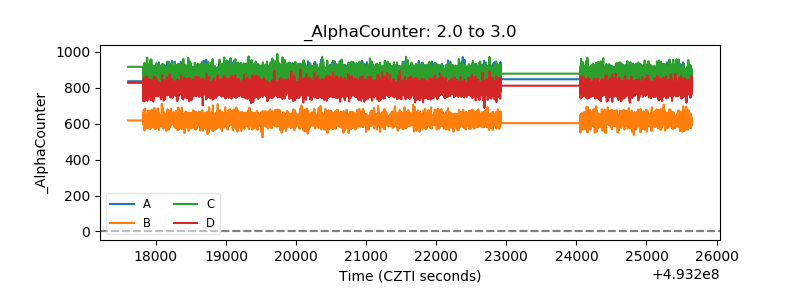 |
| _CPM_Rate | 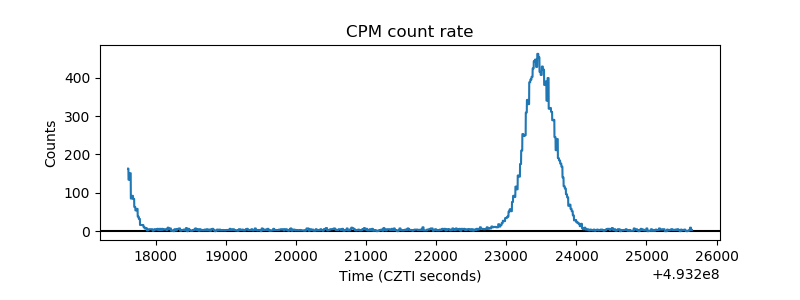 |
| CZT Counter | 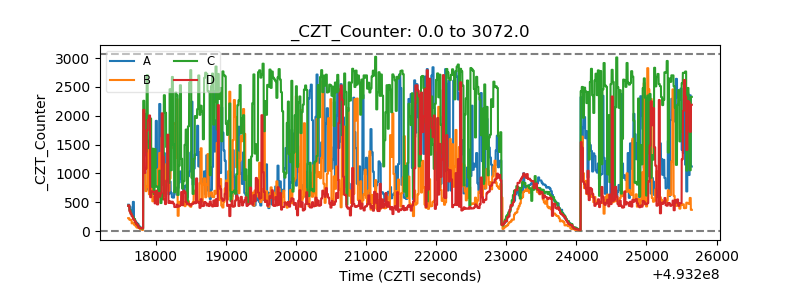 |
| +2.5 Volts monitor |  |
| +5 Volts monitor |  |
| _ROLL_ROT | 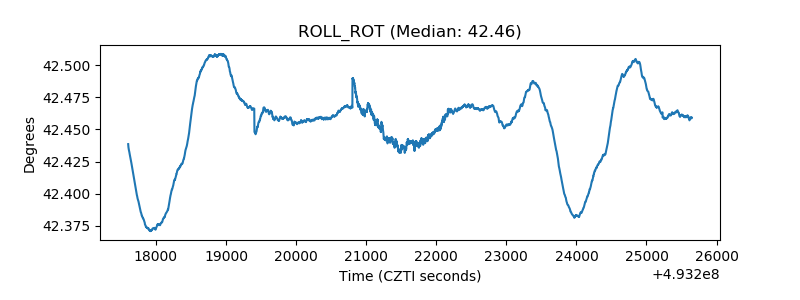 |
| _Roll_DEC | 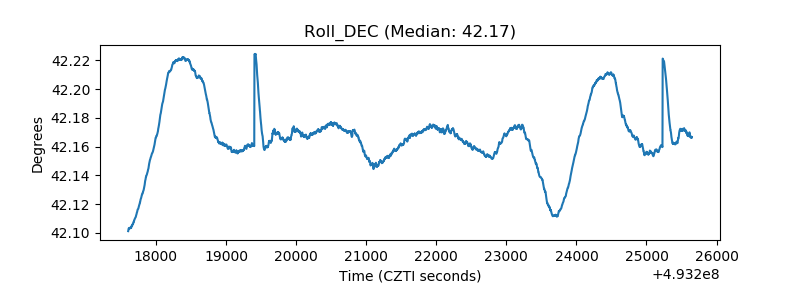 |
| _Roll_RA | 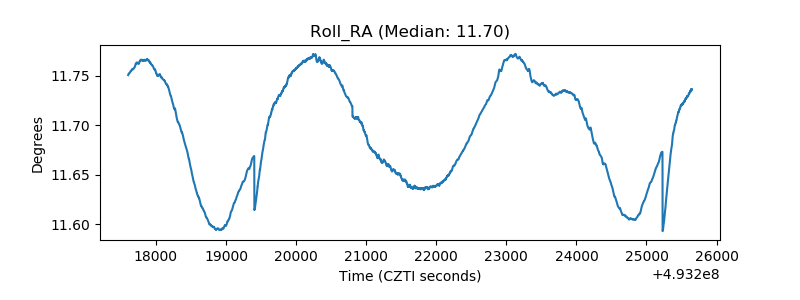 |
| Veto Counter | 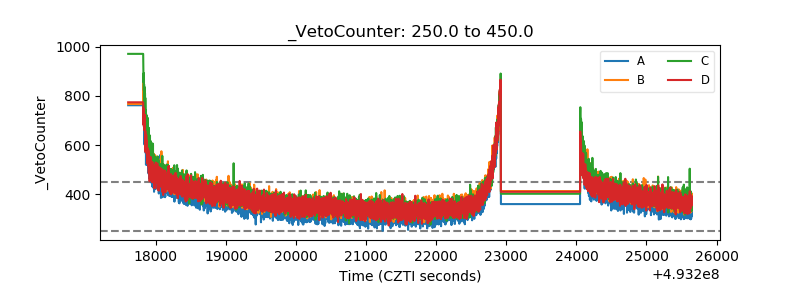 |