| Param | Original file | Final file |
|---|---|---|
| Filename | modeM0/AS1A14_002T07_9000006498_53501cztM0_level2.fits | modeM0/AS1A14_002T07_9000006498_53501cztM0_level2_quad_clean.evt |
| Size (bytes) | 876,049,920 | 80,965,440 |
| Size | 835.5 MB | 77.2 MB |
| Events in quadrant A | 9,022,418 | 530,974 |
| Events in quadrant B | 4,705,954 | 665,003 |
| Events in quadrant C | 14,031,557 | 211,772 |
| Events in quadrant D | 4,157,852 | 583,255 |
| Mode SS | |||
|---|---|---|---|
| Quadrant | BADHDUFLAG | Total packets | Discarded packets |
| A | 0 | 134 | 0 |
| B | 0 | 134 | 0 |
| C | 0 | 134 | 0 |
| D | 0 | 134 | 0 |
| Mode M9 | |||
|---|---|---|---|
| Quadrant | BADHDUFLAG | Total packets | Discarded packets |
| A | 0 | 19 | 0 |
| B | 0 | 19 | 0 |
| C | 0 | 20 | 0 |
| D | 0 | 20 | 0 |
| Mode M0 | |||
|---|---|---|---|
| Quadrant | BADHDUFLAG | Total packets | Discarded packets |
| A | 0 | 31406 | 2 |
| B | 0 | 18423 | 9 |
| C | 0 | 46268 | 2 |
| D | 0 | 17006 | 2 |
| Quadrant | Total seconds | Saturated seconds | Saturation percentage |
|---|---|---|---|
| A | 6601 | 1741 | 26.374792% |
| B | 6600 | 750 | 11.363636% |
| C | 6600 | 4658 | 70.575758% |
| D | 6600 | 281 | 4.257576% |
Noise dominated data is calculated using 1-second bins in cleaned event files. If a bin has >2000 counts, and if more than 50% of those come from <1% of pixels, then it is considered to be noise-dominated and hence unusable.
| Quadrant | # 1 sec bins | Bins with >0 counts | Bins with >2000 counts | High rate bins dominated by noise | Noise dominated (total time) | Noise dominated (detector-on time) | Marked lightcurve |
|---|---|---|---|---|---|---|---|
| A | 7606 | 6602 | 1425 | 1425 | 18.74% | 21.58% | 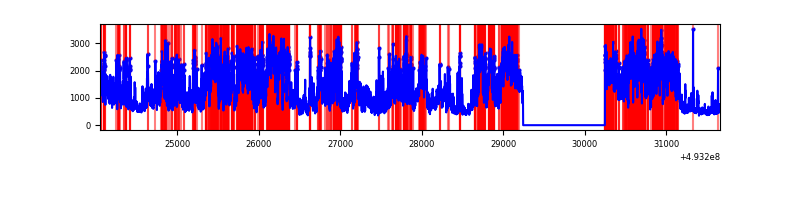 |
| B | 7605 | 6601 | 504 | 504 | 6.63% | 7.64% | 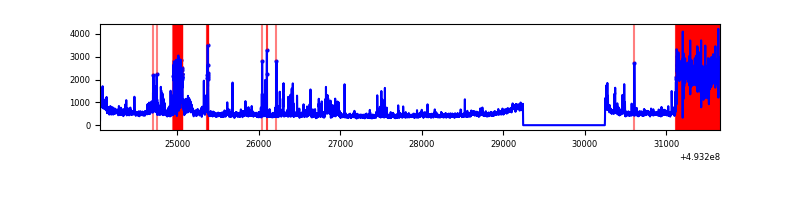 |
| C | 7605 | 6601 | 4264 | 4264 | 56.07% | 64.60% | 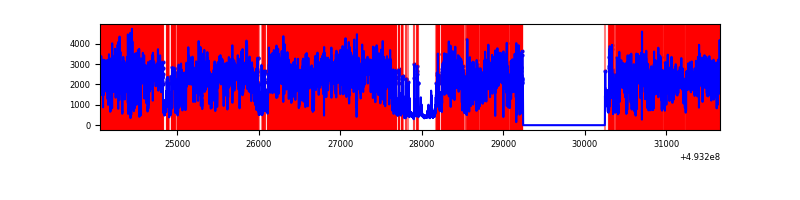 |
| D | 7605 | 6601 | 230 | 230 | 3.02% | 3.48% | 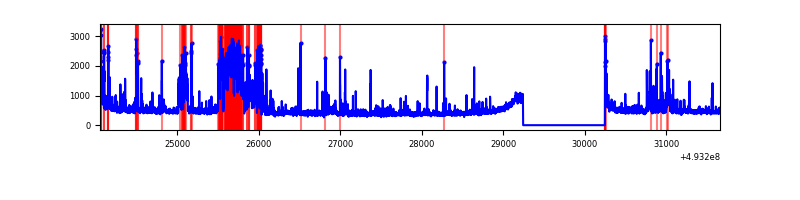 |
Top three noisy pixels from each quadrant. If the there are fewer than three noisy pixels in the level2.evt file, extra rows are filled as -1
| Pixel properties | Quadrant properties | ||||||
|---|---|---|---|---|---|---|---|
| Quadrant | DetID | PixID | Counts | Sigma | Mean | Median | Sigma |
| A | 3 | 63 | 4474192 | 26868.19 | 682 | 666 | 166.5 |
| A | 3 | 62 | 1426123 | 8561.35 | 682 | 666 | 166.5 |
| A | 15 | 174 | 387343 | 2322.4 | 682 | 666 | 166.5 |
| B | 4 | 206 | 1379189 | 9056.81 | 716 | 690 | 152.2 |
| B | 0 | 171 | 201872 | 1321.78 | 716 | 690 | 152.2 |
| B | 4 | 171 | 110070 | 718.63 | 716 | 690 | 152.2 |
| C | 7 | 64 | 8964923 | 74387.23 | 445 | 441 | 120.5 |
| C | 1 | 241 | 2440999 | 20251.74 | 445 | 441 | 120.5 |
| C | 15 | 178 | 299443 | 2481.11 | 445 | 441 | 120.5 |
| D | 9 | 49 | 795299 | 3873.33 | 732 | 701 | 205.1 |
| D | 3 | 12 | 171403 | 832.1 | 732 | 701 | 205.1 |
| D | 8 | 176 | 92194 | 445.99 | 732 | 701 | 205.1 |
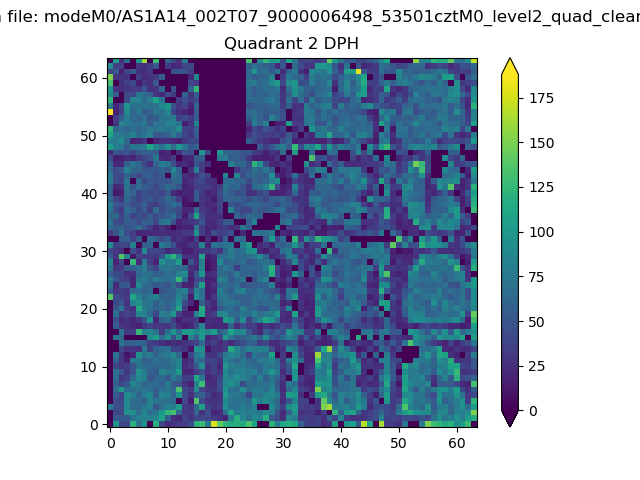
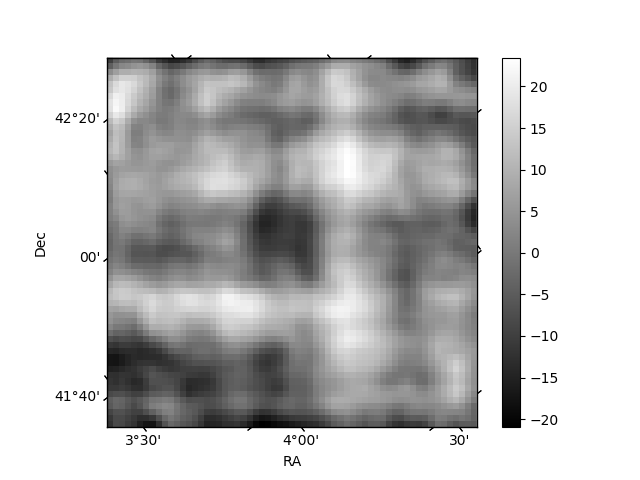
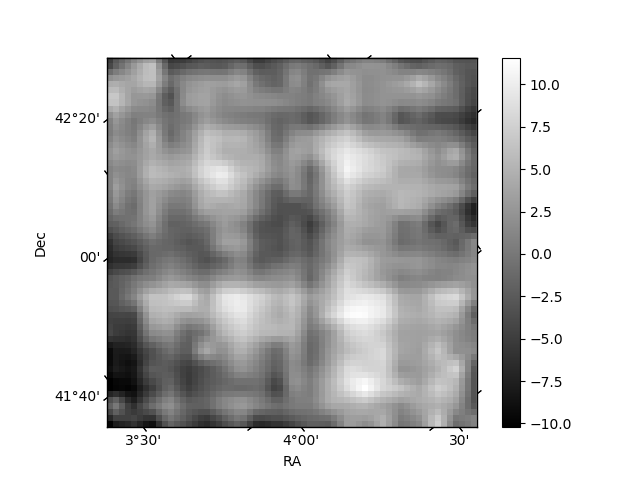
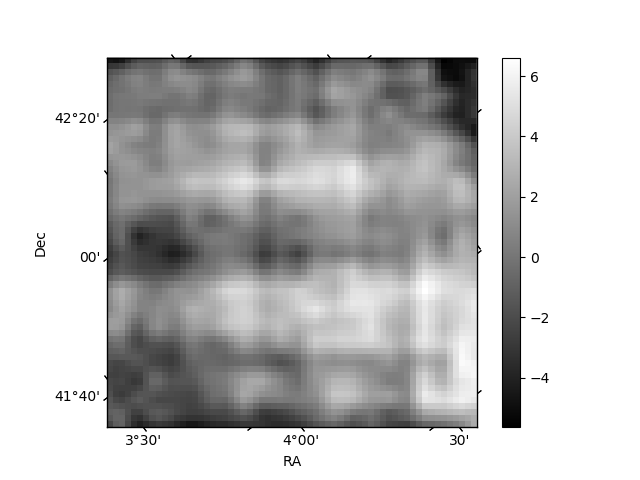
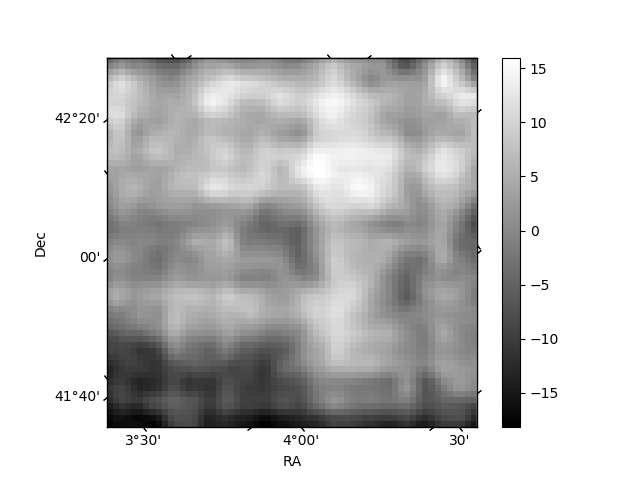
Histogram calculated using DETX and DETY for each event in the final _common_clean file
| Quadrant A | 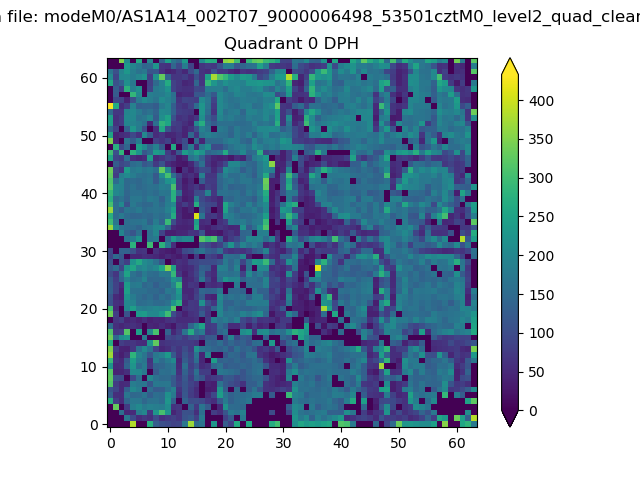 |
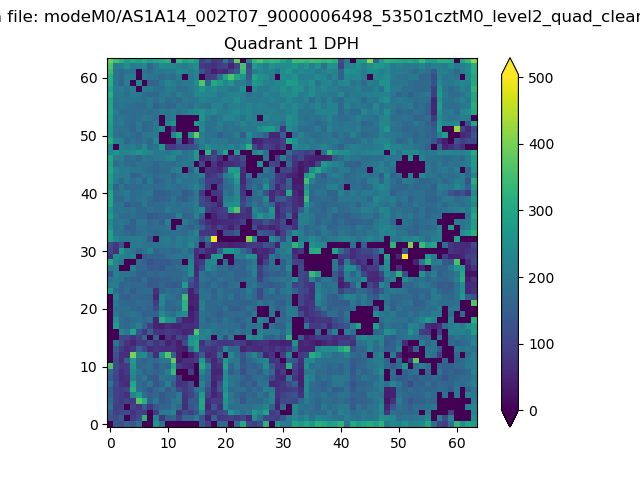 |
Quadrant B |
|---|---|---|---|
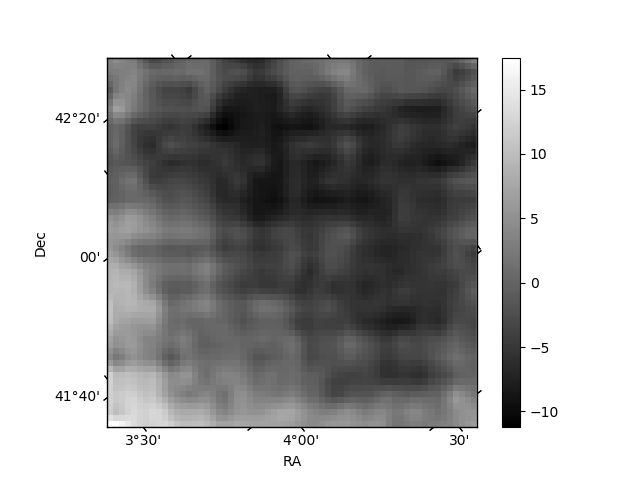
| Quadrant D | 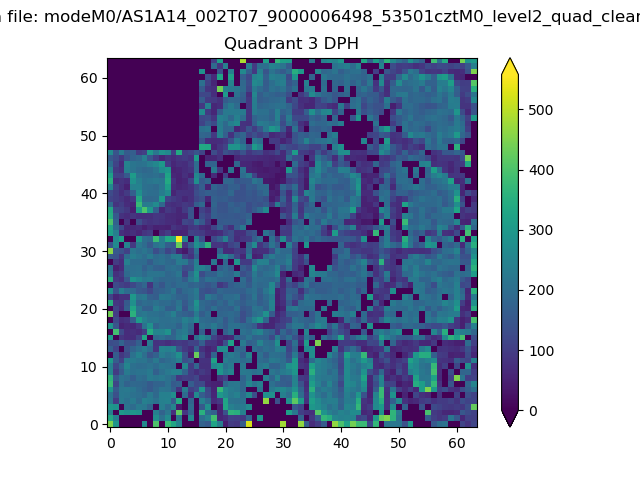 |
 |
Quadrant C |
| Plot type | Count rate plots | Images |
|---|---|---|
| Comparison with Poisson distribution Blue bars denote a histogram of data divided into 1 sec bins. Red curve is a Poisson curve with rate = median count rate of data. |
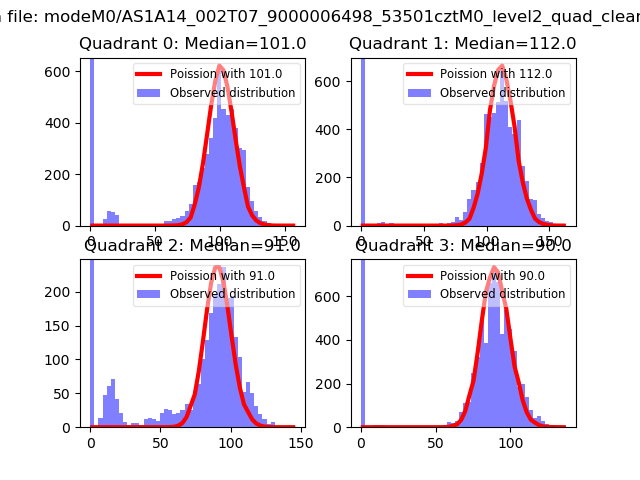 |
 |
| Quadrant-wise count rates Data is divided into 100 sec bins |
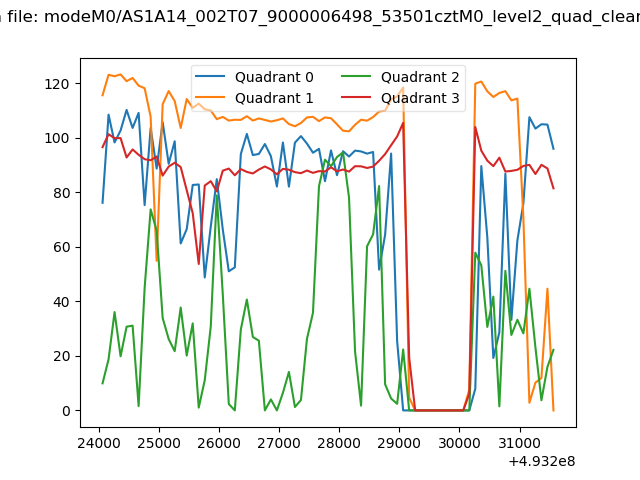 |
|
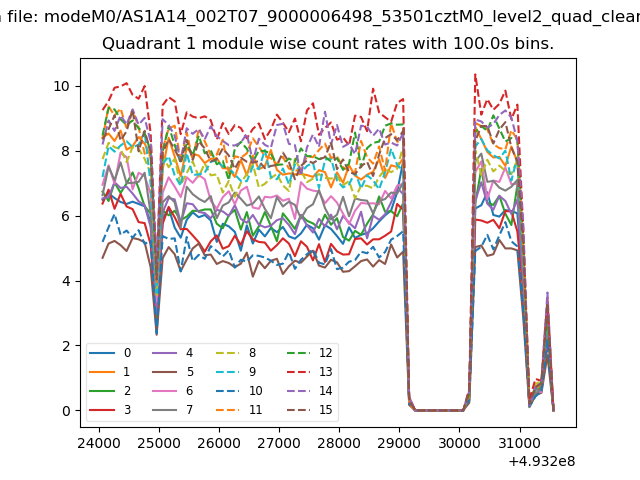
| Module-wise count rates for Quadrant A Data is divided into 100 sec bins |
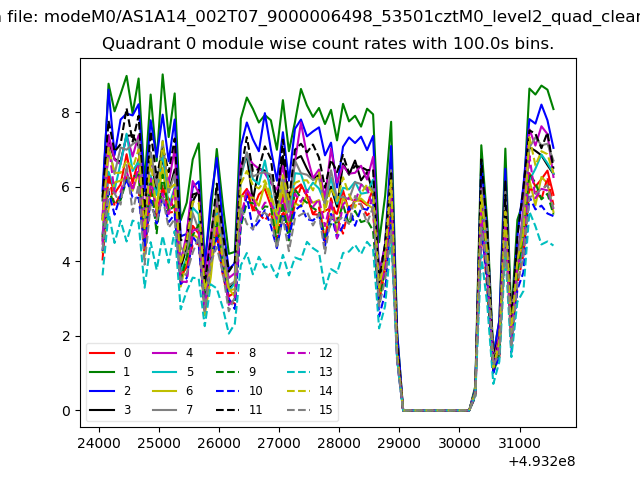 |
 |
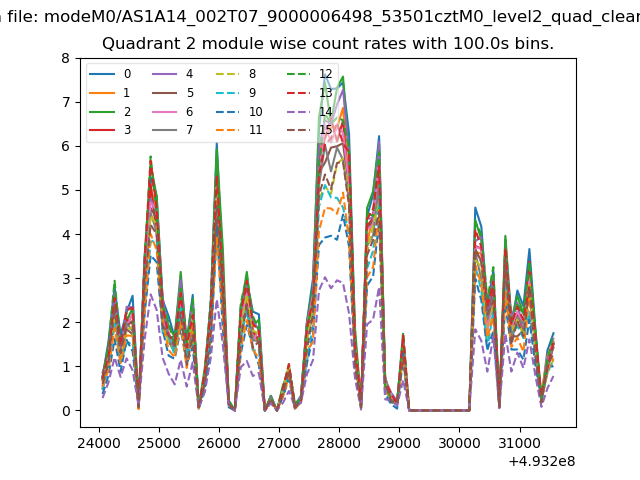
| Module-wise count rates for Quadrant B Data is divided into 100 sec bins |
 |
 |
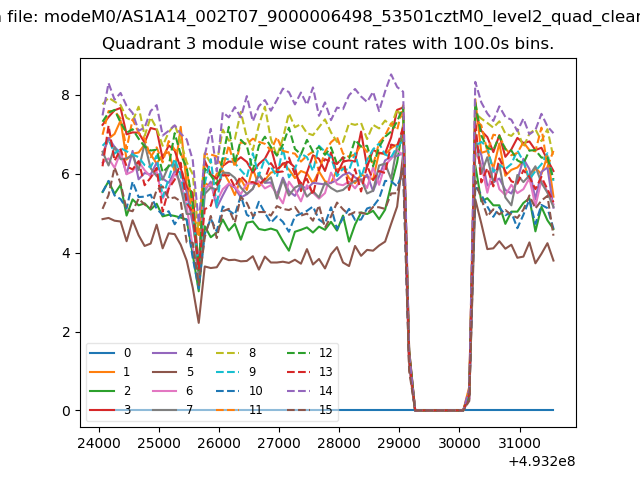
| Module-wise count rates for Quadrant C Data is divided into 100 sec bins |
 |
 |
| Module-wise count rates for Quadrant D Data is divided into 100 sec bins |
 |
 |
| Parameter | Plot |
|---|---|
| CZT HV Monitor | 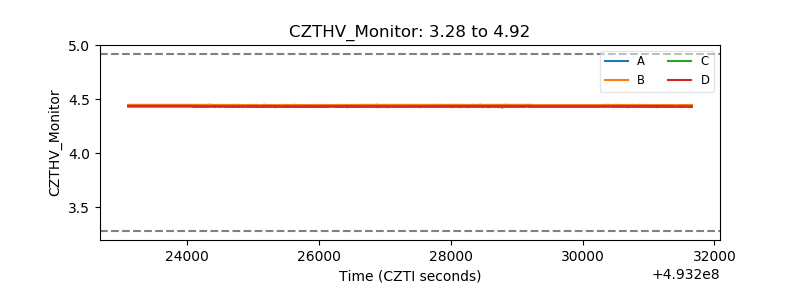 |
| D_VDD | 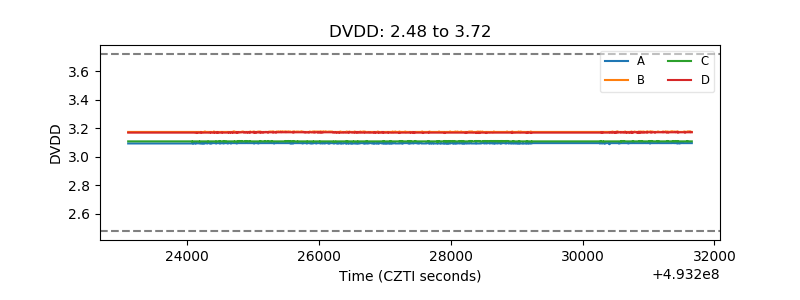 |
| Temperature 1 | 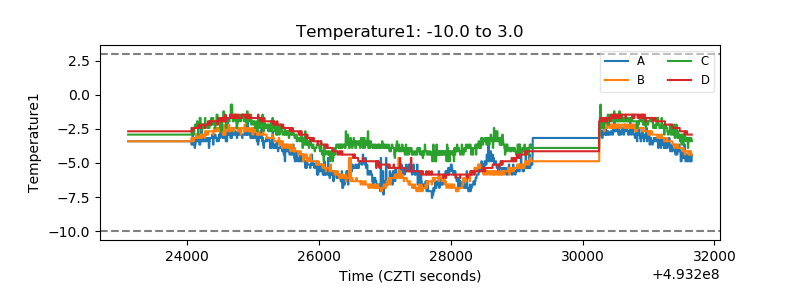 |
| Veto HV Monitor | 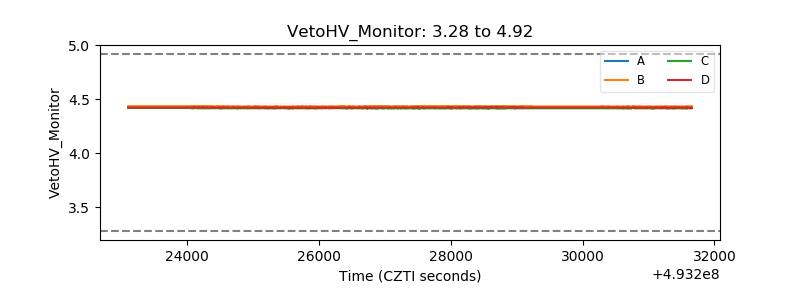 |
| Veto LLD | 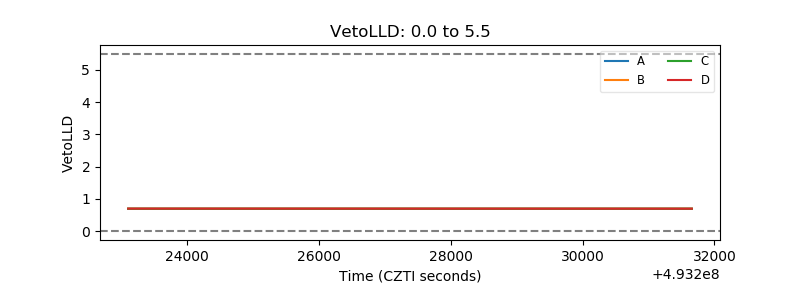 |
| Alpha Counter | 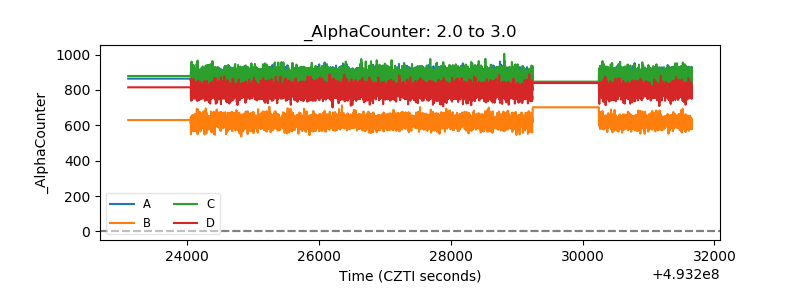 |
| _CPM_Rate | 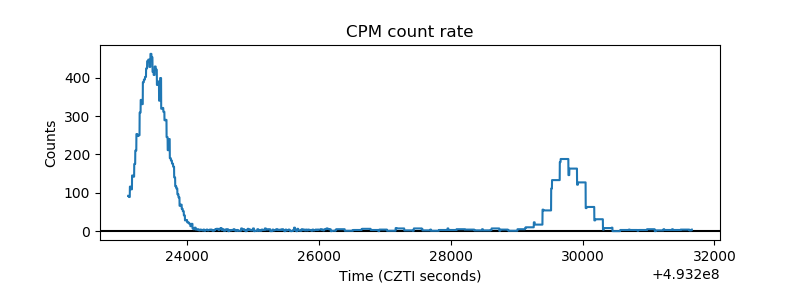 |
| CZT Counter | 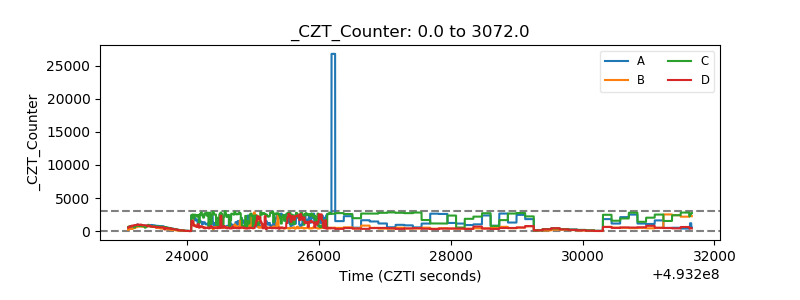 |
| +2.5 Volts monitor | 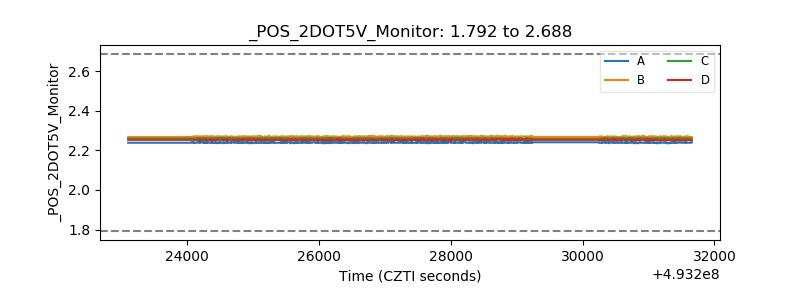 |
| +5 Volts monitor | 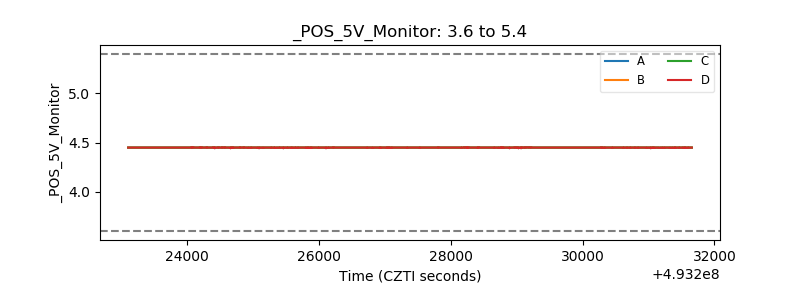 |
| _ROLL_ROT | 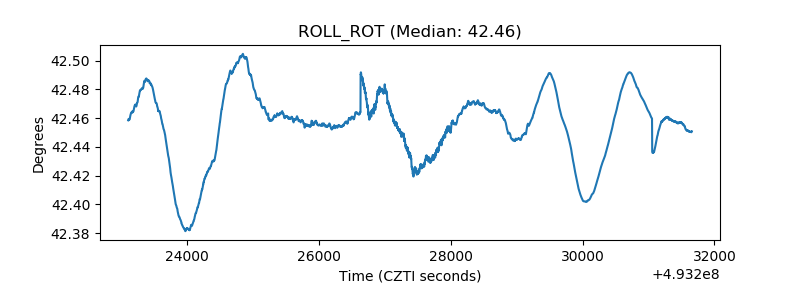 |
| _Roll_DEC | 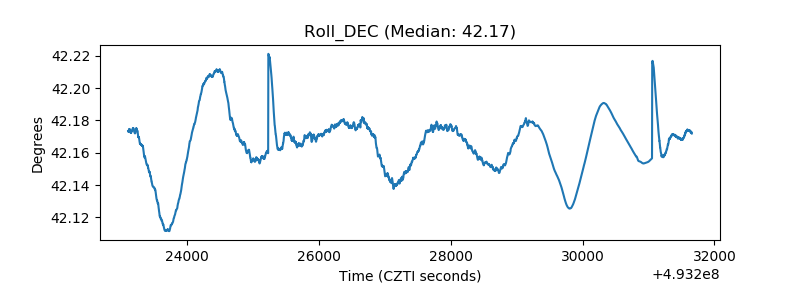 |
| _Roll_RA | 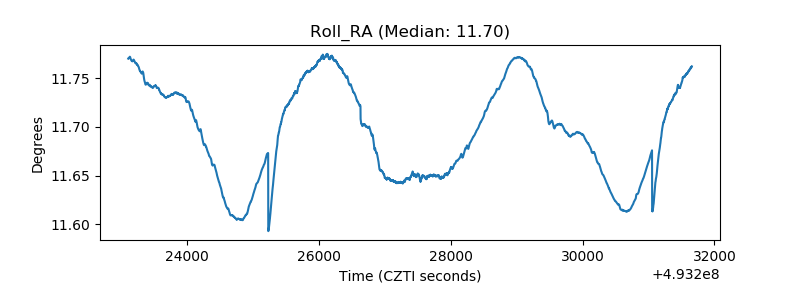 |
| Veto Counter | 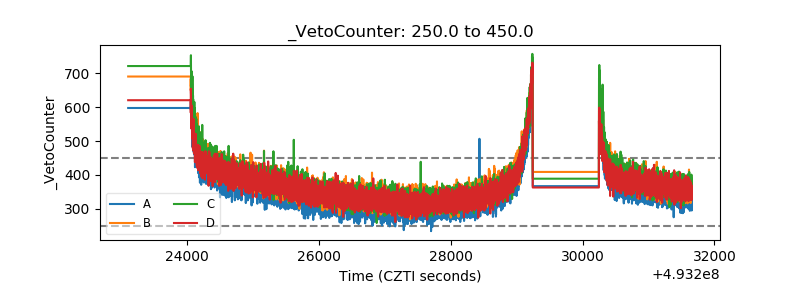 |