| Param | Original file | Final file |
|---|---|---|
| Filename | modeM0/AS1A14_002T07_9000006498_53502cztM0_level2.fits | modeM0/AS1A14_002T07_9000006498_53502cztM0_level2_quad_clean.evt |
| Size (bytes) | 929,669,760 | 75,487,680 |
| Size | 886.6 MB | 72.0 MB |
| Events in quadrant A | 9,375,734 | 481,062 |
| Events in quadrant B | 6,520,531 | 597,311 |
| Events in quadrant C | 14,691,870 | 167,319 |
| Events in quadrant D | 3,314,024 | 578,815 |
| Mode SS | |||
|---|---|---|---|
| Quadrant | BADHDUFLAG | Total packets | Discarded packets |
| A | 0 | 134 | 0 |
| B | 0 | 134 | 0 |
| C | 0 | 134 | 0 |
| D | 0 | 134 | 0 |
| Mode M9 | |||
|---|---|---|---|
| Quadrant | BADHDUFLAG | Total packets | Discarded packets |
| A | 0 | 8 | 0 |
| B | 0 | 8 | 0 |
| C | 0 | 8 | 0 |
| D | 0 | 8 | 0 |
| Mode M0 | |||
|---|---|---|---|
| Quadrant | BADHDUFLAG | Total packets | Discarded packets |
| A | 0 | 32380 | 1 |
| B | 0 | 23836 | 1 |
| C | 0 | 48158 | 1 |
| D | 0 | 14605 | 1 |
| Quadrant | Total seconds | Saturated seconds | Saturation percentage |
|---|---|---|---|
| A | 6608 | 2022 | 30.599274% |
| B | 6608 | 1196 | 18.099274% |
| C | 6608 | 5042 | 76.301453% |
| D | 6609 | 57 | 0.862460% |
Noise dominated data is calculated using 1-second bins in cleaned event files. If a bin has >2000 counts, and if more than 50% of those come from <1% of pixels, then it is considered to be noise-dominated and hence unusable.
| Quadrant | # 1 sec bins | Bins with >0 counts | Bins with >2000 counts | High rate bins dominated by noise | Noise dominated (total time) | Noise dominated (detector-on time) | Marked lightcurve |
|---|---|---|---|---|---|---|---|
| A | 7408 | 6609 | 1799 | 1799 | 24.28% | 27.22% | 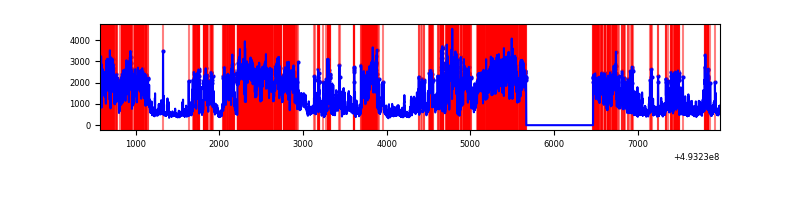 |
| B | 7408 | 6609 | 910 | 910 | 12.28% | 13.77% | 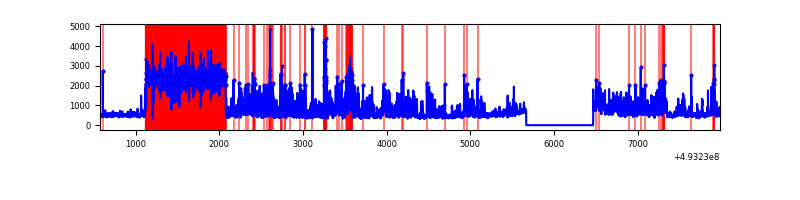 |
| C | 7408 | 6609 | 4508 | 4508 | 60.85% | 68.21% | 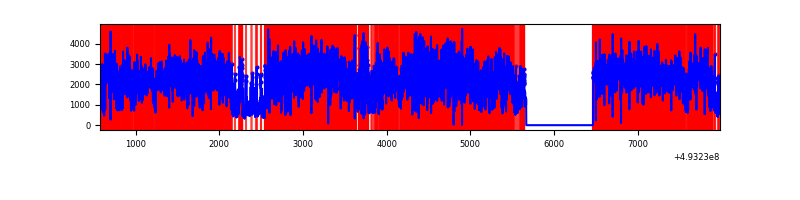 |
| D | 7409 | 6610 | 46 | 46 | 0.62% | 0.70% | 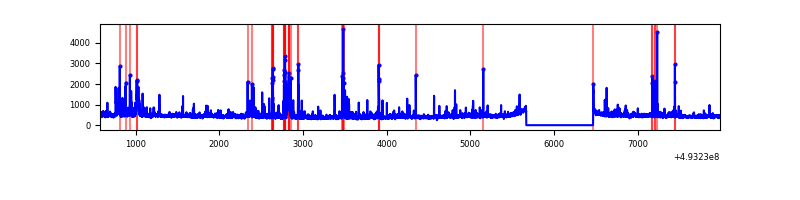 |
Top three noisy pixels from each quadrant. If the there are fewer than three noisy pixels in the level2.evt file, extra rows are filled as -1
| Pixel properties | Quadrant properties | ||||||
|---|---|---|---|---|---|---|---|
| Quadrant | DetID | PixID | Counts | Sigma | Mean | Median | Sigma |
| A | 3 | 63 | 5034276 | 32186.42 | 630 | 615 | 156.4 |
| A | 3 | 62 | 1159566 | 7410.61 | 630 | 615 | 156.4 |
| A | 15 | 174 | 679253 | 4339.37 | 630 | 615 | 156.4 |
| B | 4 | 206 | 3271588 | 23117.91 | 657 | 633 | 141.5 |
| B | 4 | 171 | 267841 | 1888.53 | 657 | 633 | 141.5 |
| B | 10 | 28 | 81525 | 571.72 | 657 | 633 | 141.5 |
| C | 7 | 64 | 9682274 | 91016.55 | 388 | 382 | 106.4 |
| C | 1 | 241 | 1055136 | 9915.43 | 388 | 382 | 106.4 |
| C | 12 | 254 | 899733 | 8454.53 | 388 | 382 | 106.4 |
| D | 3 | 12 | 193349 | 978.15 | 700 | 671 | 197.0 |
| D | 8 | 208 | 97669 | 492.42 | 700 | 671 | 197.0 |
| D | 1 | 0 | 93681 | 472.17 | 700 | 671 | 197.0 |
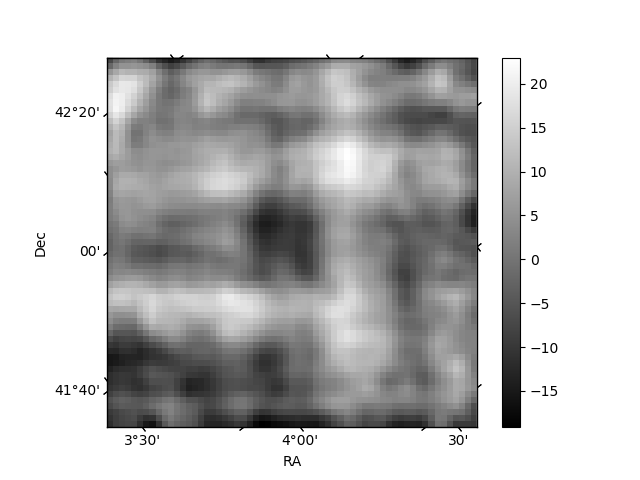
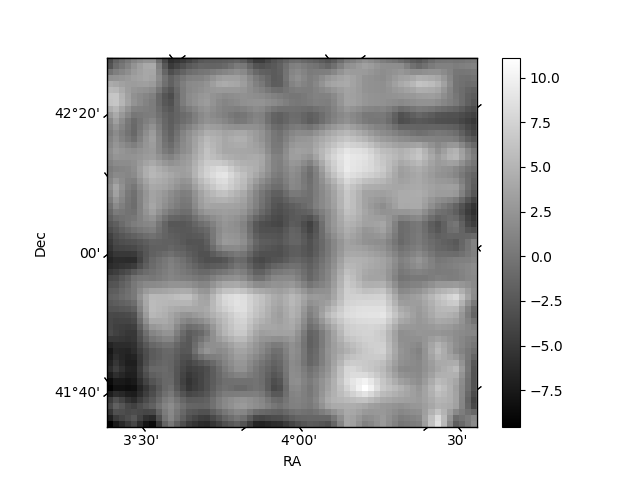
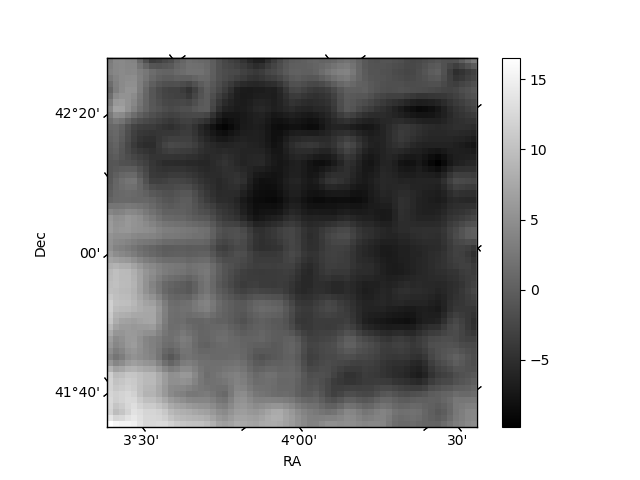
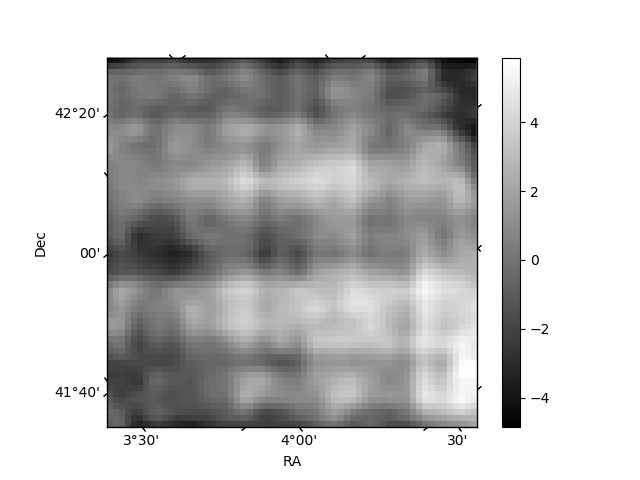
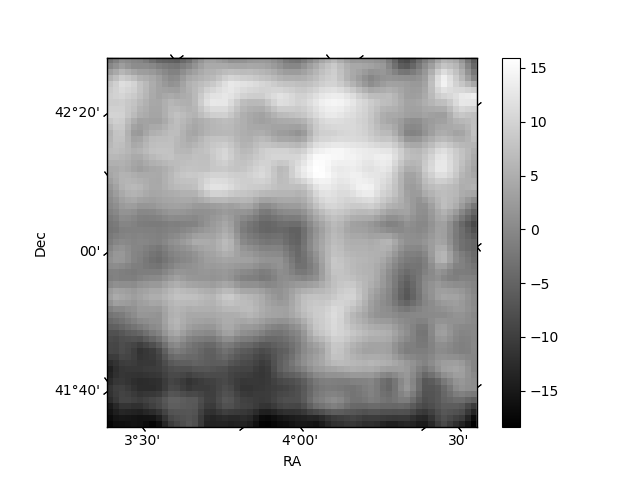
Histogram calculated using DETX and DETY for each event in the final _common_clean file
| Quadrant A | 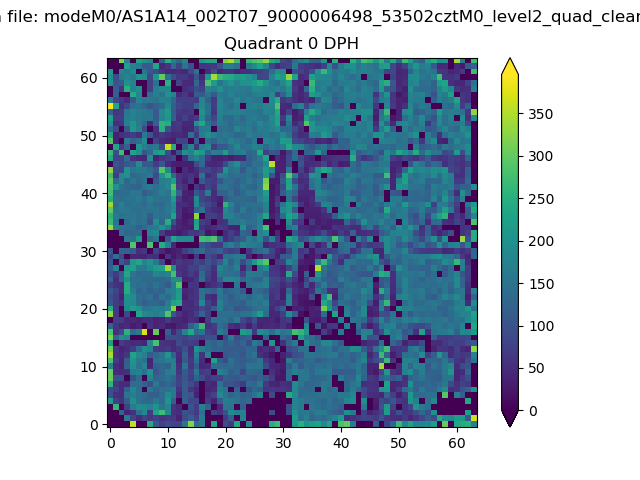 |
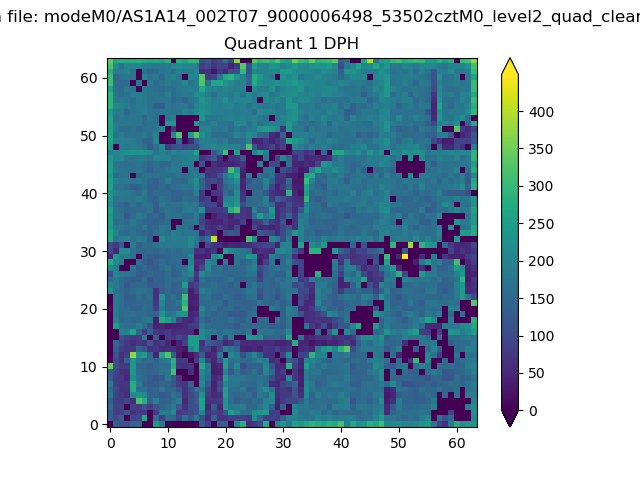 |
Quadrant B |
|---|---|---|---|
| Quadrant D | 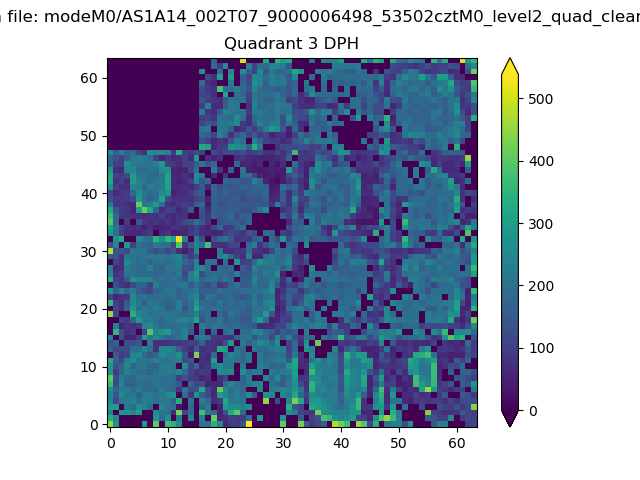 |
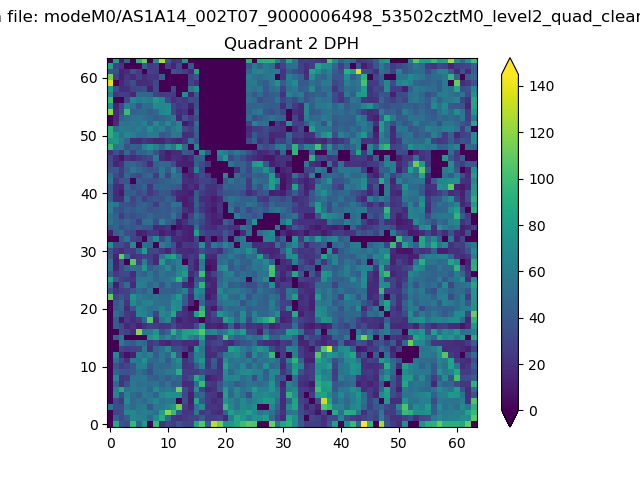 |
Quadrant C |
| Plot type | Count rate plots | Images |
|---|---|---|
| Comparison with Poisson distribution Blue bars denote a histogram of data divided into 1 sec bins. Red curve is a Poisson curve with rate = median count rate of data. |
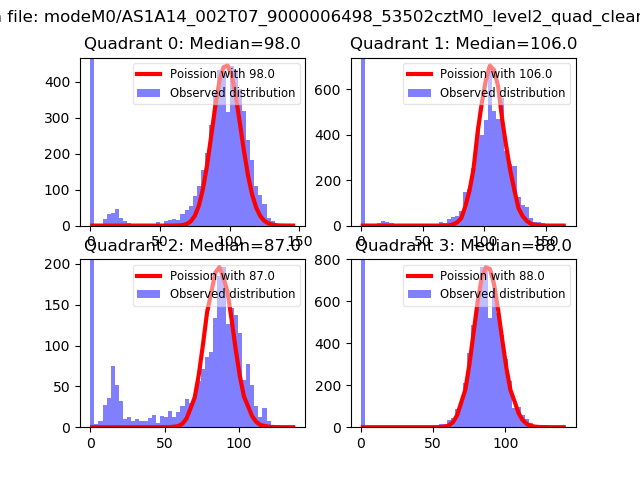 |
 |
| Quadrant-wise count rates Data is divided into 100 sec bins |
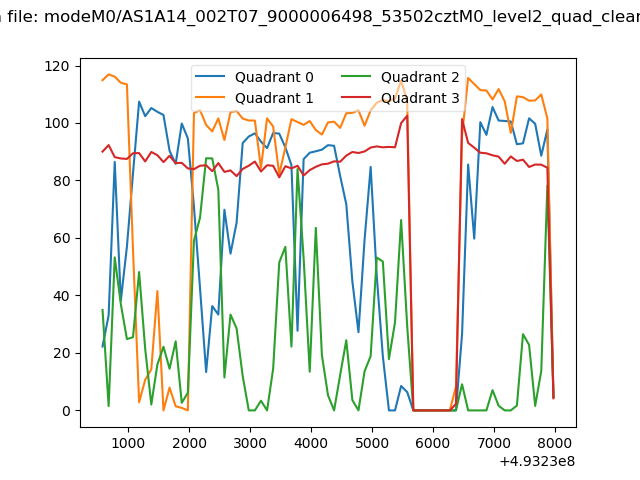 |
|
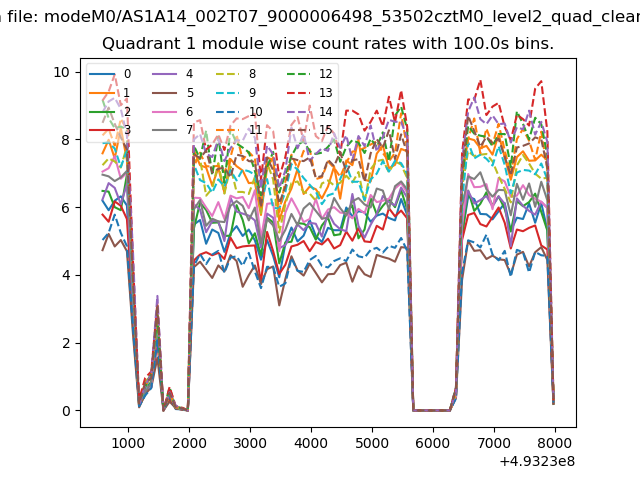
| Module-wise count rates for Quadrant A Data is divided into 100 sec bins |
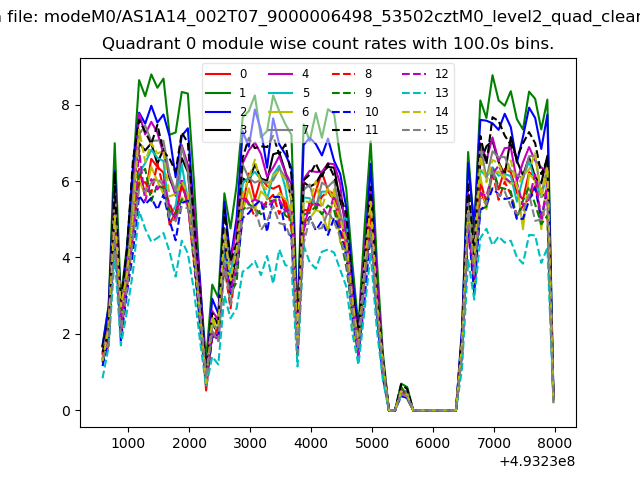 |
 |
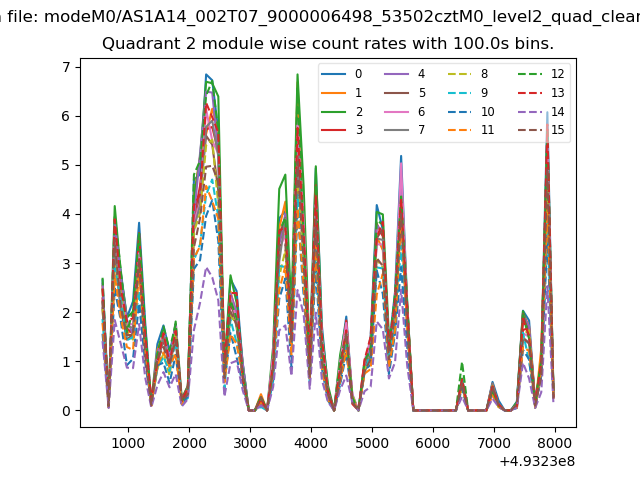
| Module-wise count rates for Quadrant B Data is divided into 100 sec bins |
 |
 |
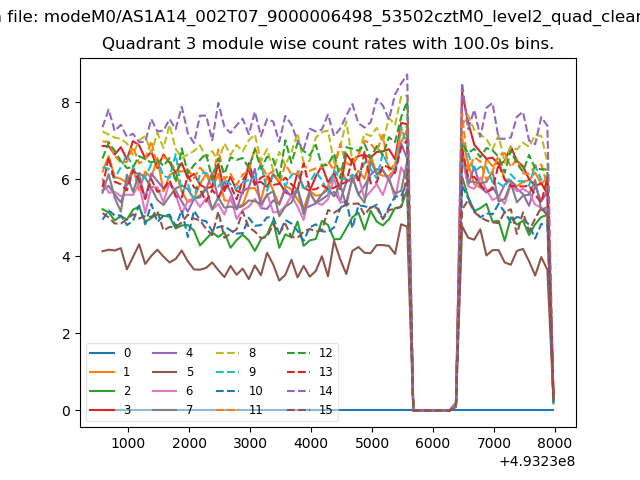
| Module-wise count rates for Quadrant C Data is divided into 100 sec bins |
 |
 |
| Module-wise count rates for Quadrant D Data is divided into 100 sec bins |
 |
 |
| Parameter | Plot |
|---|---|
| CZT HV Monitor |  |
| D_VDD | 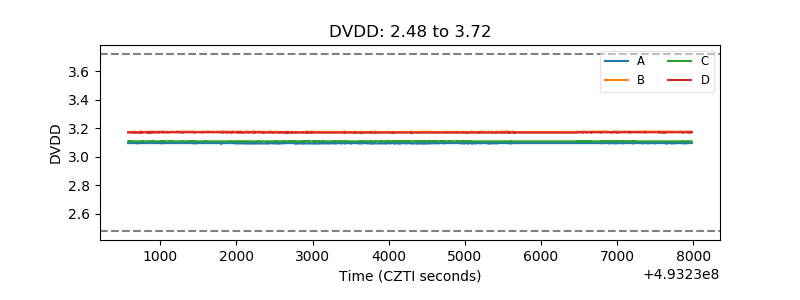 |
| Temperature 1 | 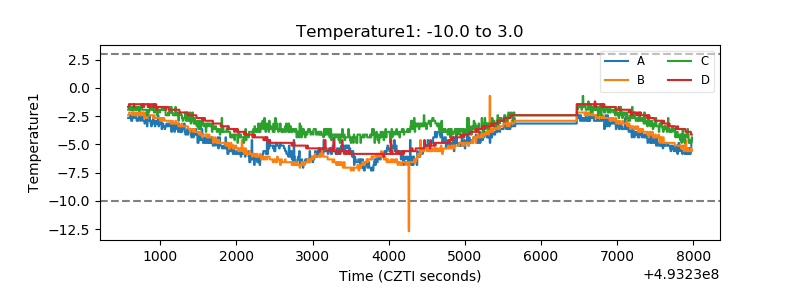 |
| Veto HV Monitor | 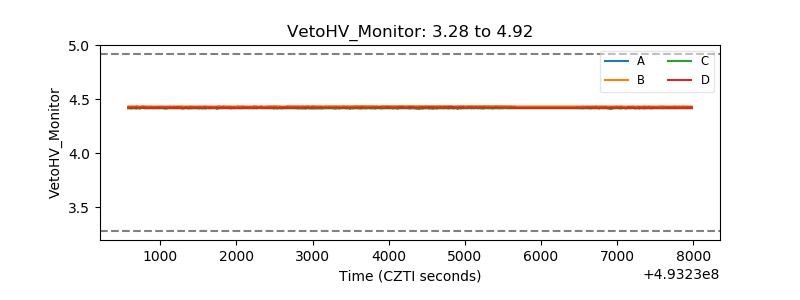 |
| Veto LLD | 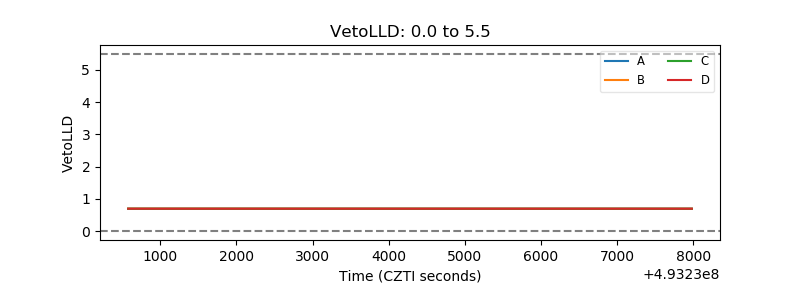 |
| Alpha Counter | 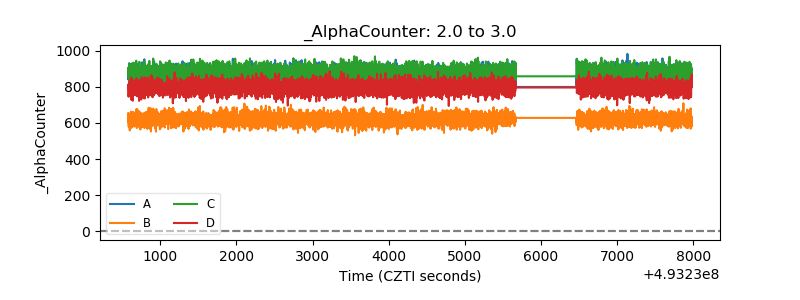 |
| _CPM_Rate | 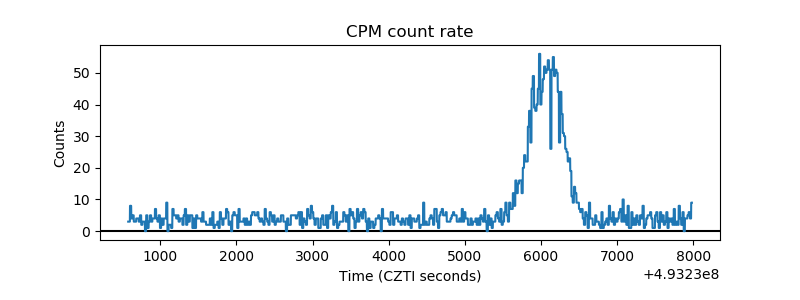 |
| CZT Counter | 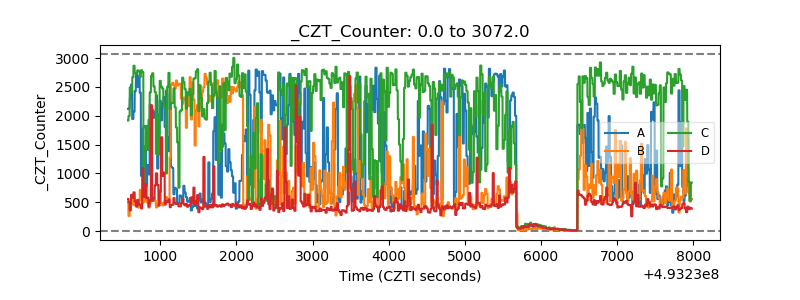 |
| +2.5 Volts monitor |  |
| +5 Volts monitor |  |
| _ROLL_ROT | 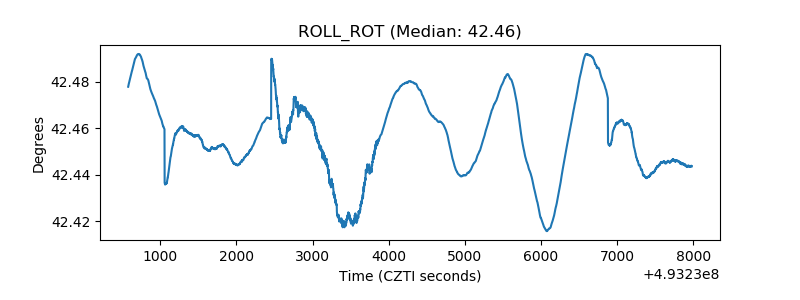 |
| _Roll_DEC | 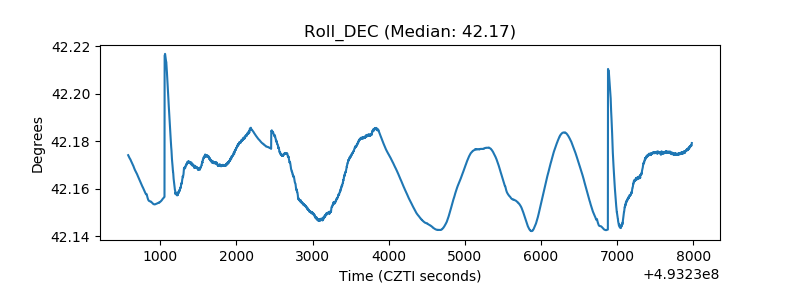 |
| _Roll_RA | 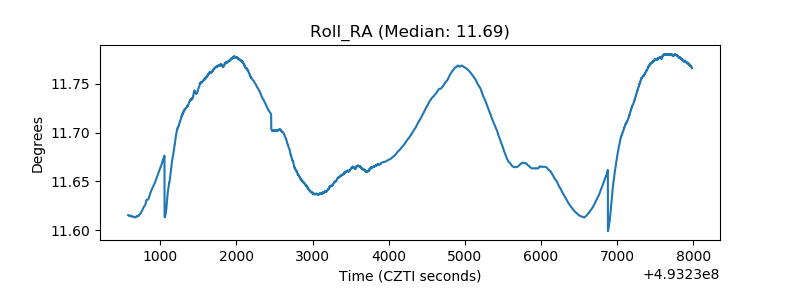 |
| Veto Counter | 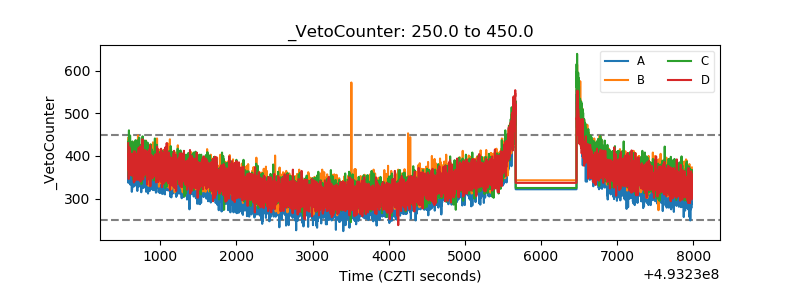 |