| Param | Original file | Final file |
|---|---|---|
| Filename | modeM0/AS1A14_002T07_9000006498_53503cztM0_level2.fits | modeM0/AS1A14_002T07_9000006498_53503cztM0_level2_quad_clean.evt |
| Size (bytes) | 1,078,439,040 | 98,740,800 |
| Size | 1.0 GB | 94.2 MB |
| Events in quadrant A | 9,831,282 | 689,895 |
| Events in quadrant B | 7,875,267 | 754,295 |
| Events in quadrant C | 17,023,826 | 256,142 |
| Events in quadrant D | 4,552,575 | 716,771 |
| Mode SS | |||
|---|---|---|---|
| Quadrant | BADHDUFLAG | Total packets | Discarded packets |
| A | 0 | 166 | 0 |
| B | 0 | 166 | 0 |
| C | 0 | 166 | 0 |
| D | 0 | 166 | 0 |
| Mode M9 | |||
|---|---|---|---|
| Quadrant | BADHDUFLAG | Total packets | Discarded packets |
| A | 0 | 9 | 0 |
| B | 0 | 9 | 0 |
| C | 0 | 9 | 0 |
| D | 0 | 9 | 0 |
| Mode M0 | |||
|---|---|---|---|
| Quadrant | BADHDUFLAG | Total packets | Discarded packets |
| A | 0 | 34964 | 2 |
| B | 0 | 29029 | 2 |
| C | 0 | 56212 | 7 |
| D | 0 | 19436 | 2 |
| Quadrant | Total seconds | Saturated seconds | Saturation percentage |
|---|---|---|---|
| A | 8242 | 1658 | 20.116477% |
| B | 8243 | 1554 | 18.852360% |
| C | 8242 | 5770 | 70.007280% |
| D | 8242 | 188 | 2.281000% |
Noise dominated data is calculated using 1-second bins in cleaned event files. If a bin has >2000 counts, and if more than 50% of those come from <1% of pixels, then it is considered to be noise-dominated and hence unusable.
| Quadrant | # 1 sec bins | Bins with >0 counts | Bins with >2000 counts | High rate bins dominated by noise | Noise dominated (total time) | Noise dominated (detector-on time) | Marked lightcurve |
|---|---|---|---|---|---|---|---|
| A | 9082 | 8244 | 1169 | 1169 | 12.87% | 14.18% | 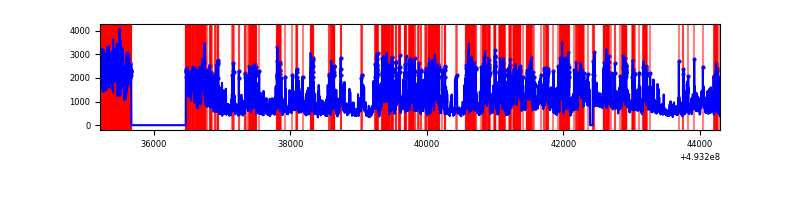 |
| B | 9083 | 8244 | 855 | 855 | 9.41% | 10.37% | 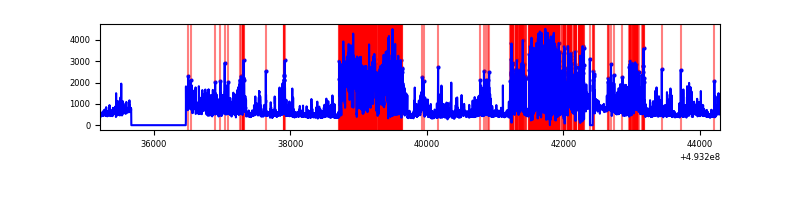 |
| C | 9082 | 8244 | 4939 | 4939 | 54.38% | 59.91% | 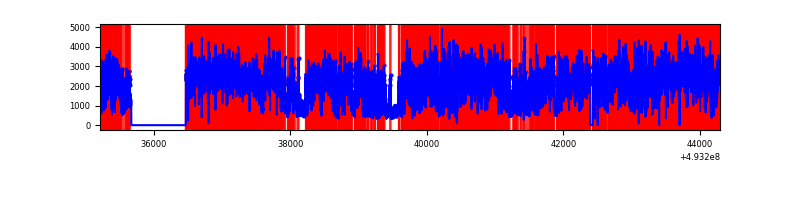 |
| D | 9082 | 8244 | 142 | 142 | 1.56% | 1.72% | 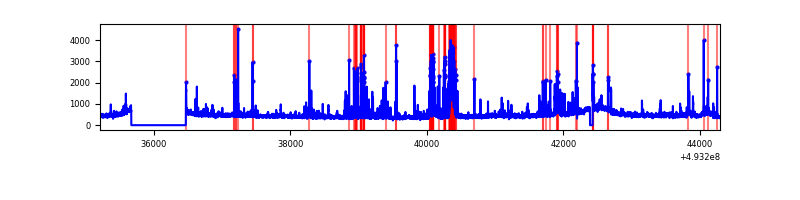 |
Top three noisy pixels from each quadrant. If the there are fewer than three noisy pixels in the level2.evt file, extra rows are filled as -1
| Pixel properties | Quadrant properties | ||||||
|---|---|---|---|---|---|---|---|
| Quadrant | DetID | PixID | Counts | Sigma | Mean | Median | Sigma |
| A | 3 | 63 | 3049788 | 14366.59 | 863 | 839 | 212.2 |
| A | 3 | 62 | 2918996 | 13750.3 | 863 | 839 | 212.2 |
| A | 15 | 174 | 357915 | 1682.53 | 863 | 839 | 212.2 |
| B | 4 | 206 | 2843328 | 15354.89 | 867 | 835 | 185.1 |
| B | 4 | 171 | 932322 | 5031.81 | 867 | 835 | 185.1 |
| B | 10 | 28 | 273985 | 1475.53 | 867 | 835 | 185.1 |
| C | 7 | 64 | 11517365 | 78779.68 | 535 | 530 | 146.2 |
| C | 12 | 254 | 1618271 | 11065.98 | 535 | 530 | 146.2 |
| C | 1 | 241 | 1017666 | 6957.61 | 535 | 530 | 146.2 |
| D | 7 | 110 | 221843 | 862.69 | 907 | 867 | 256.1 |
| D | 2 | 120 | 204999 | 796.93 | 907 | 867 | 256.1 |
| D | 2 | 249 | 87786 | 339.33 | 907 | 867 | 256.1 |
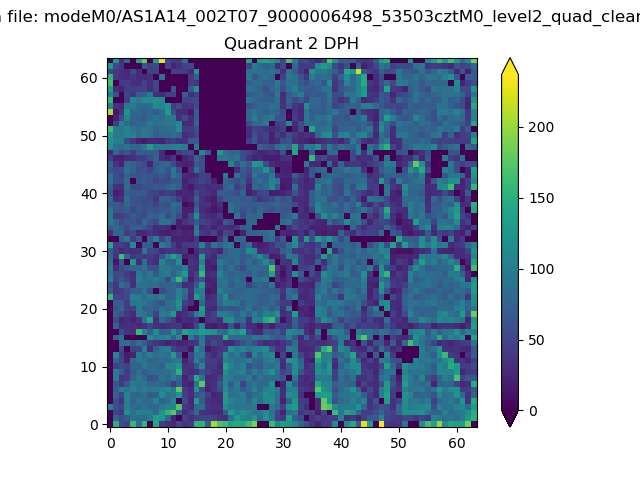
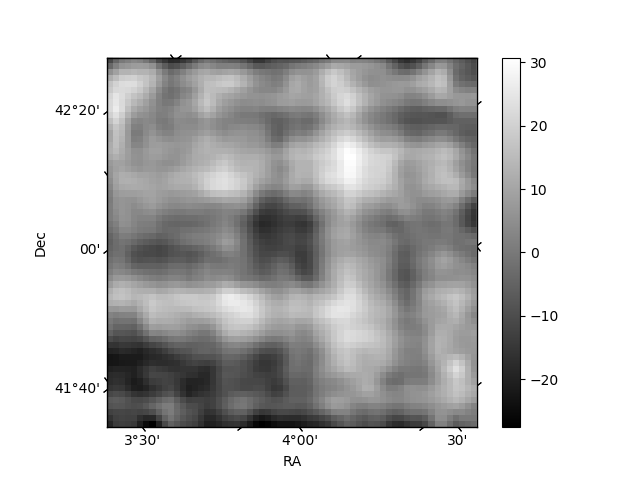
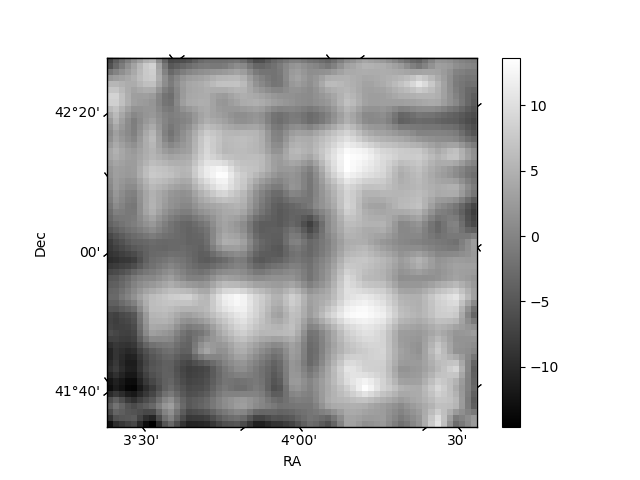
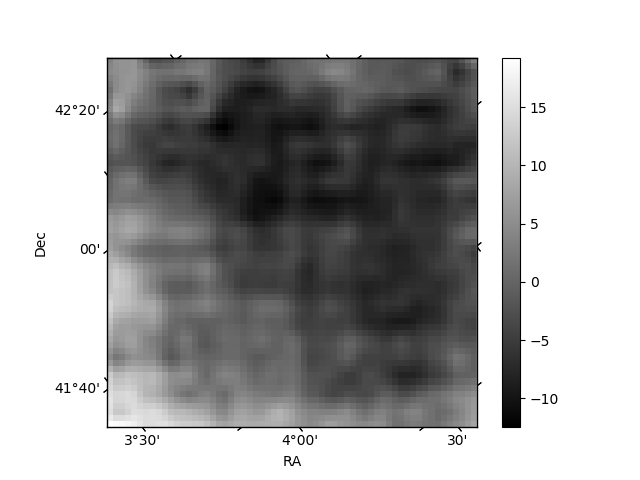
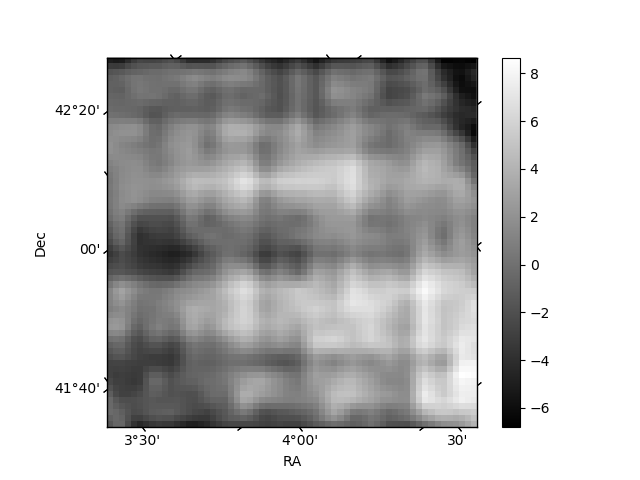
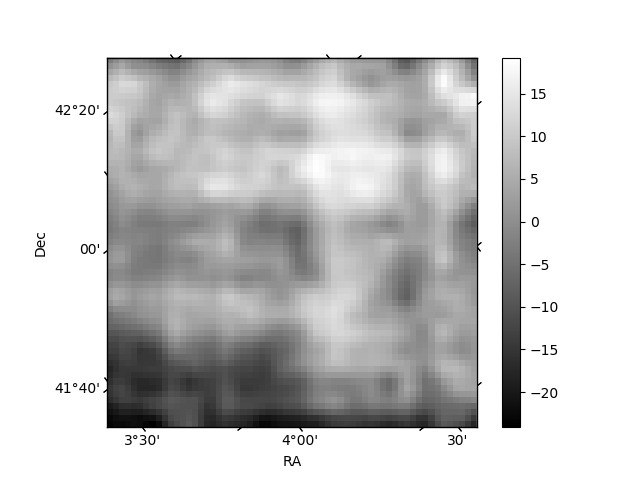
Histogram calculated using DETX and DETY for each event in the final _common_clean file
| Quadrant A | 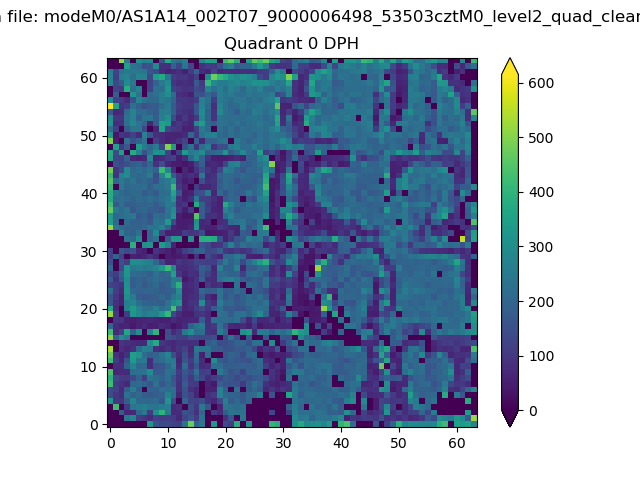 |
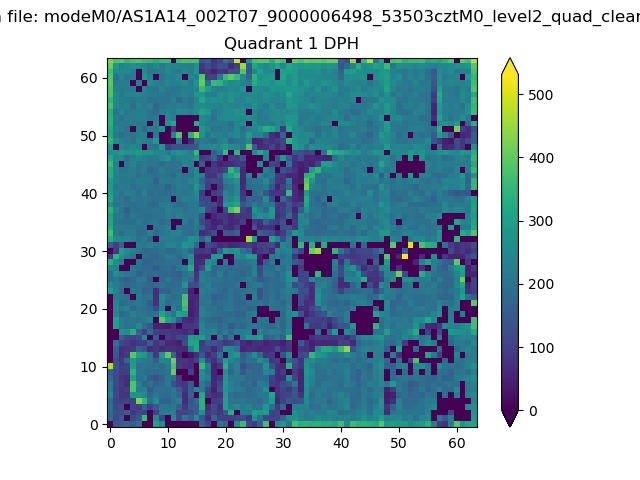 |
Quadrant B |
|---|---|---|---|
| Quadrant D | 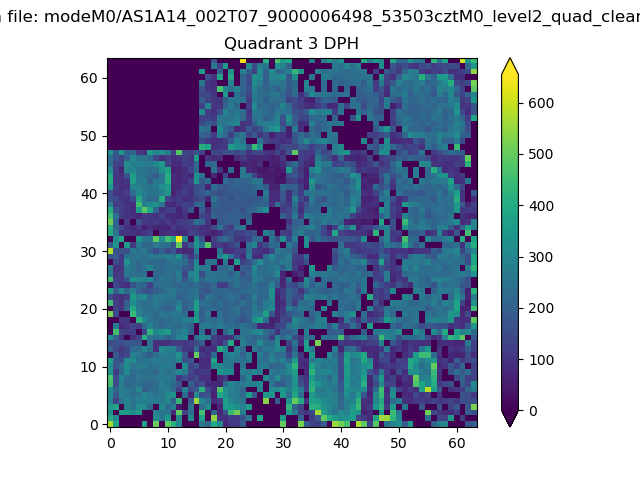 |
 |
Quadrant C |
| Plot type | Count rate plots | Images |
|---|---|---|
| Comparison with Poisson distribution Blue bars denote a histogram of data divided into 1 sec bins. Red curve is a Poisson curve with rate = median count rate of data. |
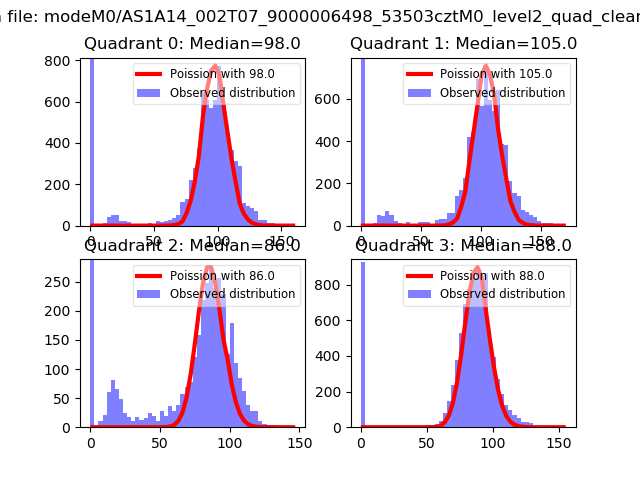 |
 |
| Quadrant-wise count rates Data is divided into 100 sec bins |
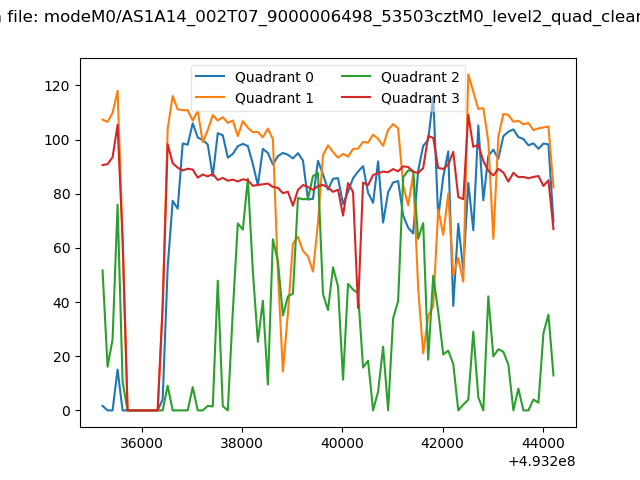 |
|
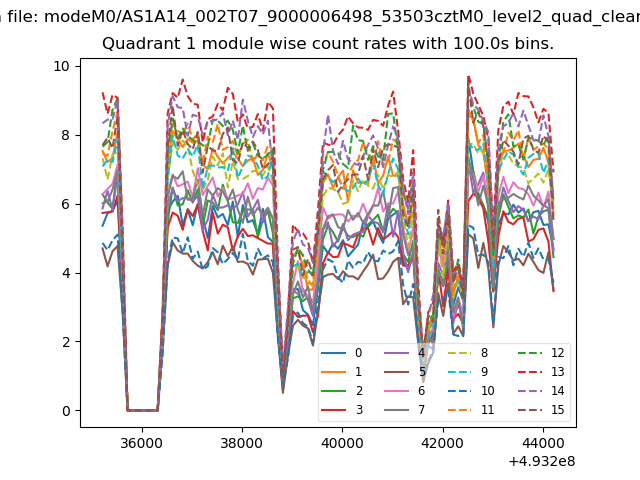
| Module-wise count rates for Quadrant A Data is divided into 100 sec bins |
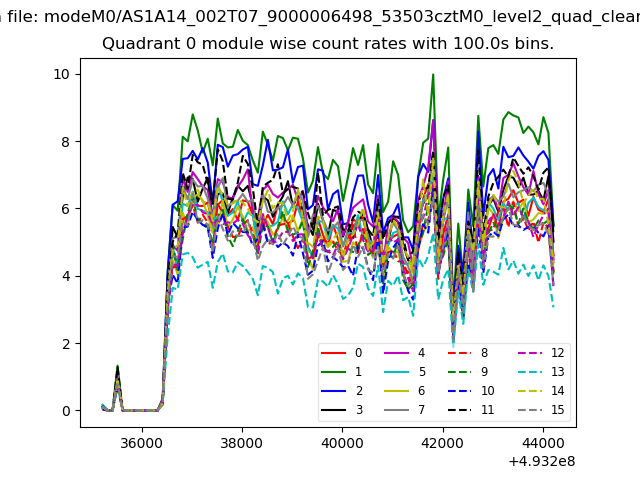 |
 |
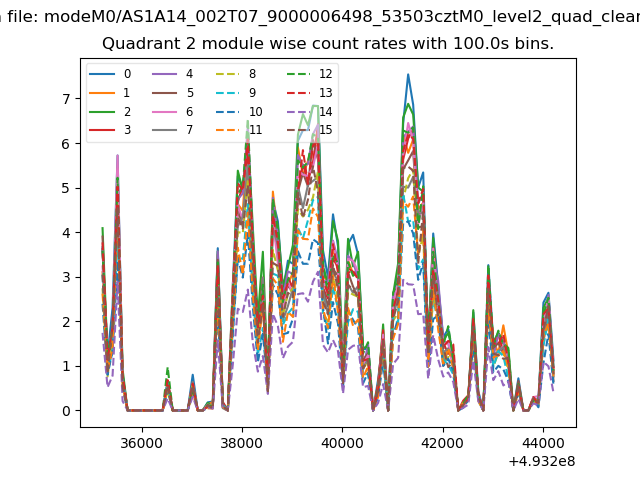
| Module-wise count rates for Quadrant B Data is divided into 100 sec bins |
 |
 |
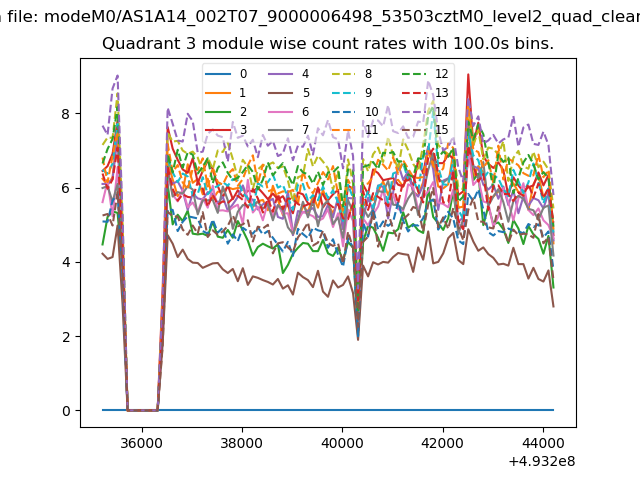
| Module-wise count rates for Quadrant C Data is divided into 100 sec bins |
 |
 |
| Module-wise count rates for Quadrant D Data is divided into 100 sec bins |
 |
 |
| Parameter | Plot |
|---|---|
| CZT HV Monitor | 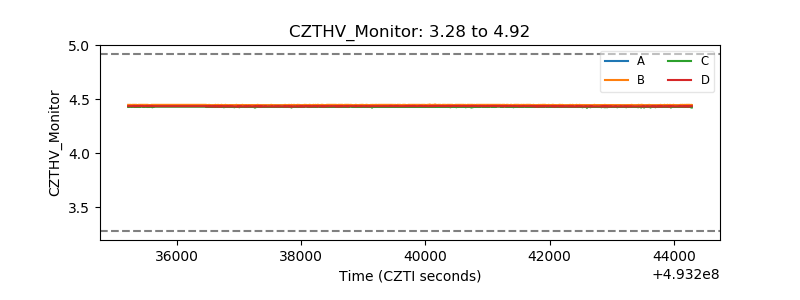 |
| D_VDD | 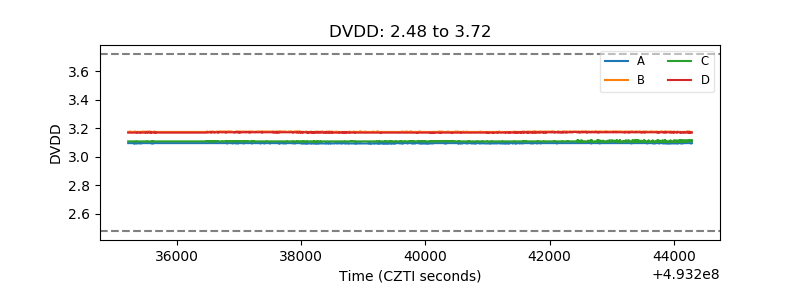 |
| Temperature 1 | 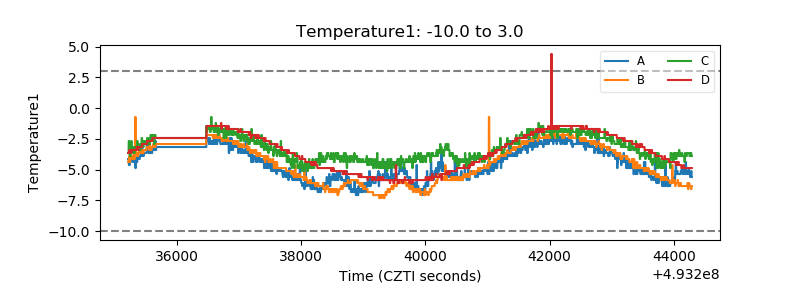 |
| Veto HV Monitor |  |
| Veto LLD | 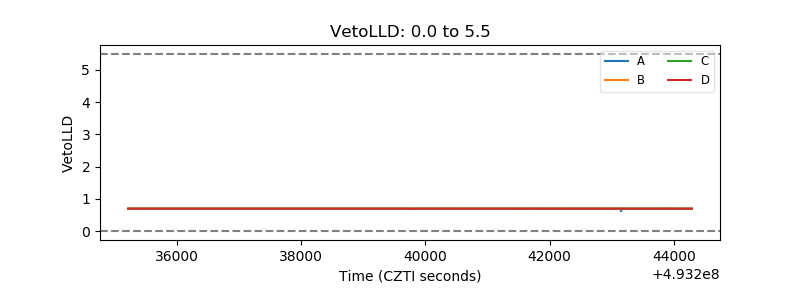 |
| Alpha Counter | 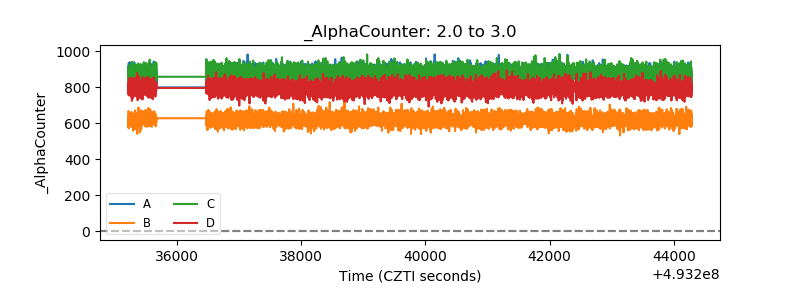 |
| _CPM_Rate | 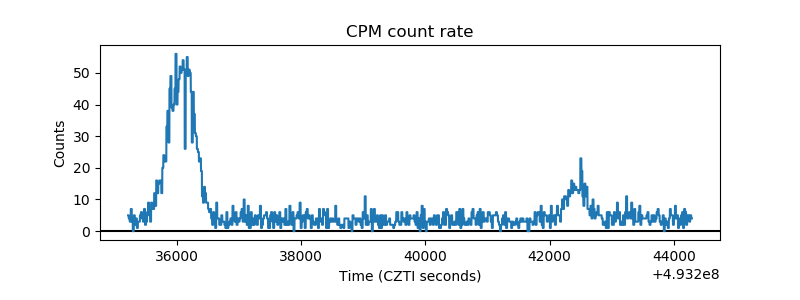 |
| CZT Counter | 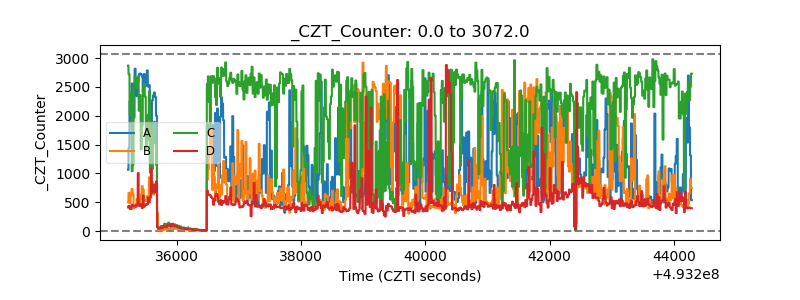 |
| +2.5 Volts monitor |  |
| +5 Volts monitor |  |
| _ROLL_ROT | 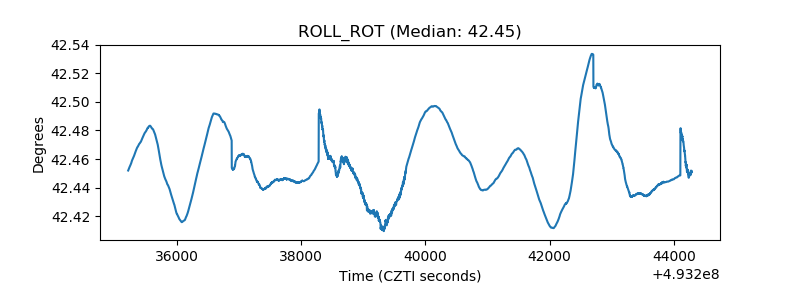 |
| _Roll_DEC | 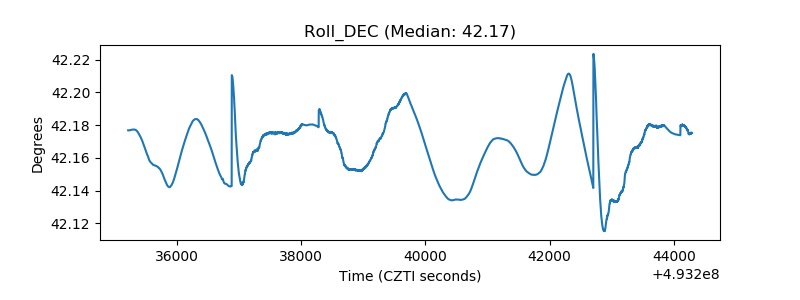 |
| _Roll_RA | 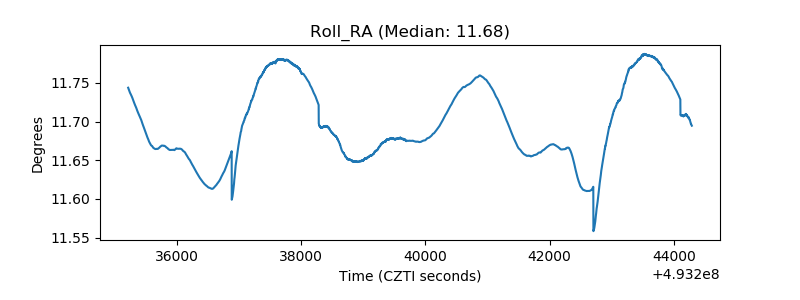 |
| Veto Counter | 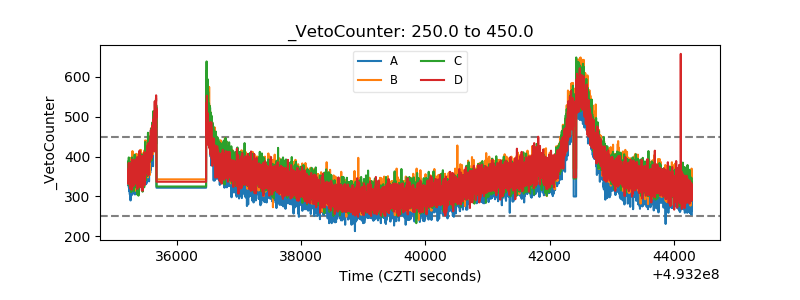 |