| Param | Original file | Final file |
|---|---|---|
| Filename | modeM0/AS1A14_002T07_9000006498_53504cztM0_level2.fits | modeM0/AS1A14_002T07_9000006498_53504cztM0_level2_quad_clean.evt |
| Size (bytes) | 1,046,070,720 | 101,782,080 |
| Size | 997.6 MB | 97.1 MB |
| Events in quadrant A | 9,687,901 | 709,128 |
| Events in quadrant B | 6,098,615 | 832,992 |
| Events in quadrant C | 18,091,031 | 226,249 |
| Events in quadrant D | 4,194,024 | 729,768 |
| Mode SS | |||
|---|---|---|---|
| Quadrant | BADHDUFLAG | Total packets | Discarded packets |
| A | 0 | 168 | 0 |
| B | 0 | 168 | 0 |
| C | 0 | 168 | 0 |
| D | 0 | 168 | 0 |
| Mode M9 | |||
|---|---|---|---|
| Quadrant | BADHDUFLAG | Total packets | Discarded packets |
| A | 0 | 1 | 0 |
| B | 0 | 1 | 0 |
| C | 0 | 1 | 0 |
| D | 0 | 1 | 0 |
| Mode M0 | |||
|---|---|---|---|
| Quadrant | BADHDUFLAG | Total packets | Discarded packets |
| A | 0 | 34700 | 3 |
| B | 0 | 24118 | 1 |
| C | 0 | 59495 | 1 |
| D | 0 | 18706 | 1 |
| Quadrant | Total seconds | Saturated seconds | Saturation percentage |
|---|---|---|---|
| A | 8405 | 1604 | 19.083879% |
| B | 8405 | 755 | 8.982748% |
| C | 8405 | 6235 | 74.182035% |
| D | 8405 | 97 | 1.154075% |
Noise dominated data is calculated using 1-second bins in cleaned event files. If a bin has >2000 counts, and if more than 50% of those come from <1% of pixels, then it is considered to be noise-dominated and hence unusable.
| Quadrant | # 1 sec bins | Bins with >0 counts | Bins with >2000 counts | High rate bins dominated by noise | Noise dominated (total time) | Noise dominated (detector-on time) | Marked lightcurve |
|---|---|---|---|---|---|---|---|
| A | 8445 | 8406 | 1081 | 1081 | 12.80% | 12.86% | 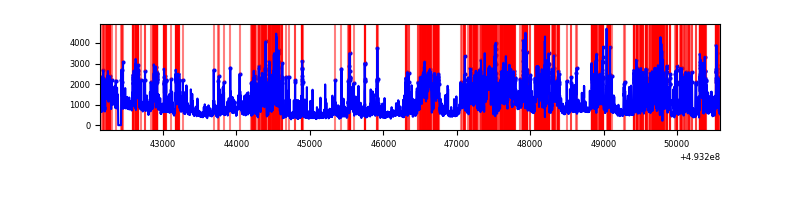 |
| B | 8445 | 8404 | 262 | 262 | 3.10% | 3.12% | 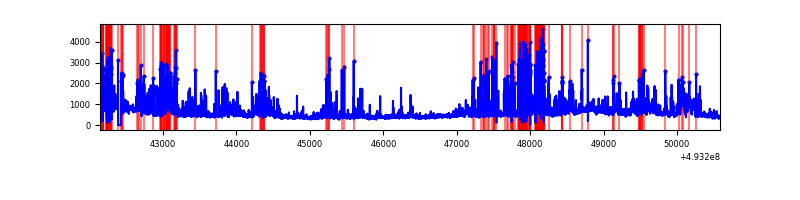 |
| C | 8445 | 8406 | 5328 | 5328 | 63.09% | 63.38% | 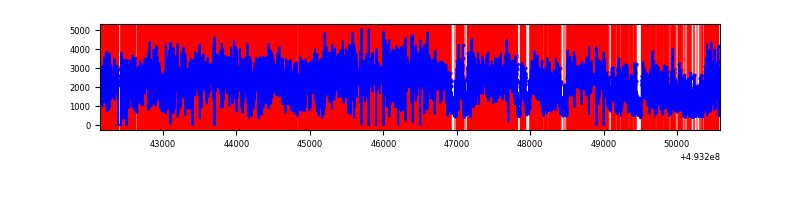 |
| D | 8445 | 8406 | 49 | 49 | 0.58% | 0.58% | 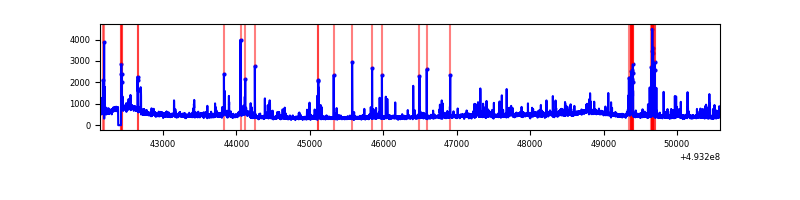 |
Top three noisy pixels from each quadrant. If the there are fewer than three noisy pixels in the level2.evt file, extra rows are filled as -1
| Pixel properties | Quadrant properties | ||||||
|---|---|---|---|---|---|---|---|
| Quadrant | DetID | PixID | Counts | Sigma | Mean | Median | Sigma |
| A | 3 | 62 | 3314054 | 15016.3 | 895 | 873 | 220.6 |
| A | 3 | 63 | 1748359 | 7920.11 | 895 | 873 | 220.6 |
| A | 15 | 174 | 620718 | 2809.32 | 895 | 873 | 220.6 |
| B | 4 | 206 | 1203329 | 6109.27 | 917 | 883 | 196.8 |
| B | 10 | 28 | 339945 | 1722.67 | 917 | 883 | 196.8 |
| B | 4 | 171 | 291063 | 1474.32 | 917 | 883 | 196.8 |
| C | 7 | 64 | 12811766 | 91405.68 | 512 | 507 | 140.2 |
| C | 12 | 254 | 783497 | 5586.47 | 512 | 507 | 140.2 |
| C | 9 | 38 | 762172 | 5434.32 | 512 | 507 | 140.2 |
| D | 3 | 12 | 141746 | 546.68 | 926 | 888 | 257.7 |
| D | 2 | 120 | 94498 | 363.31 | 926 | 888 | 257.7 |
| D | 1 | 0 | 82494 | 316.72 | 926 | 888 | 257.7 |
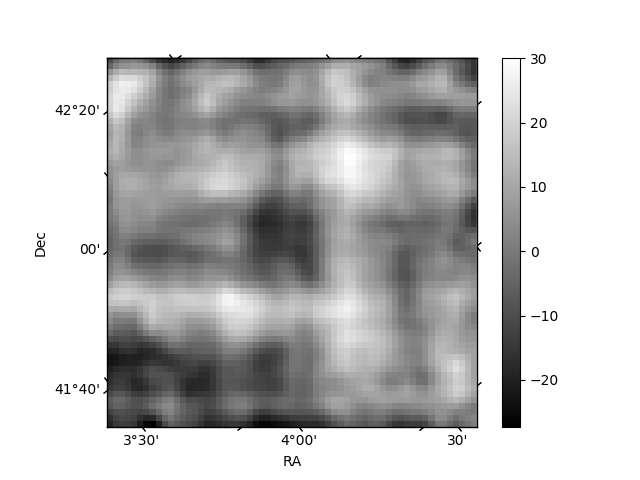
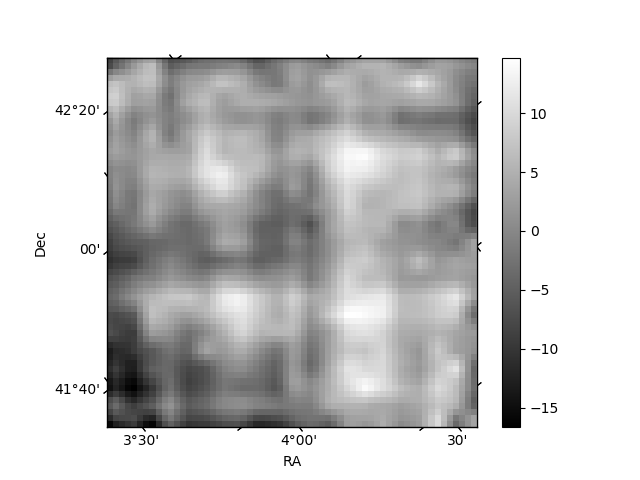
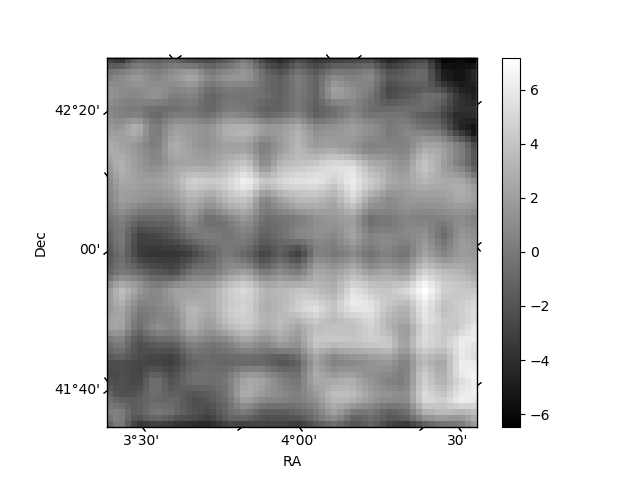
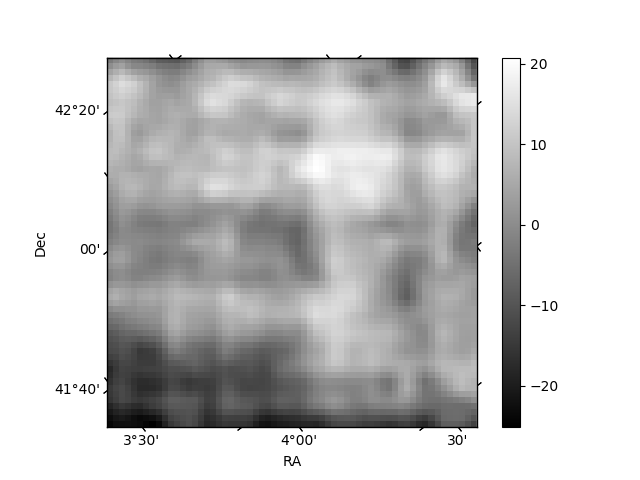
Histogram calculated using DETX and DETY for each event in the final _common_clean file
| Quadrant A | 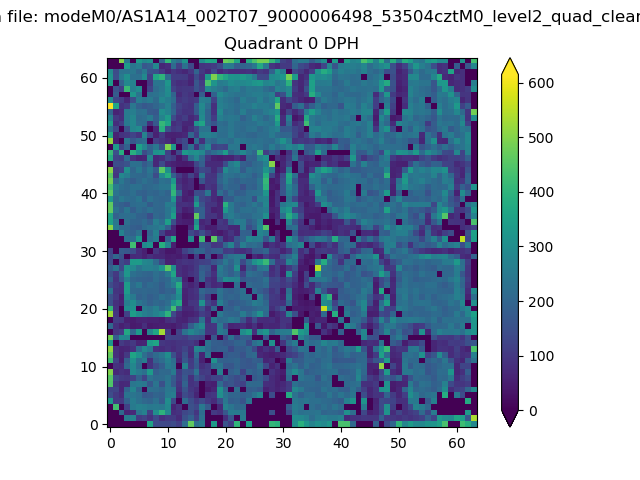 |
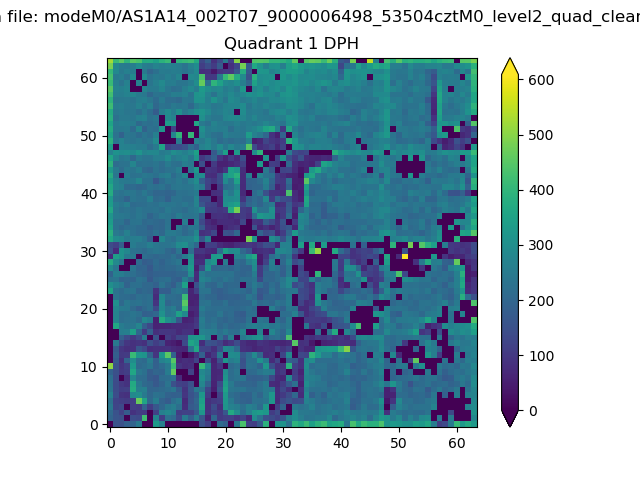 |
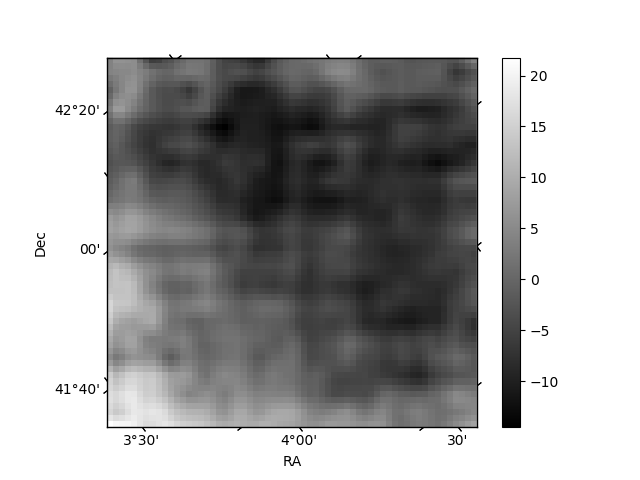
Quadrant B |
|---|---|---|---|
| Quadrant D | 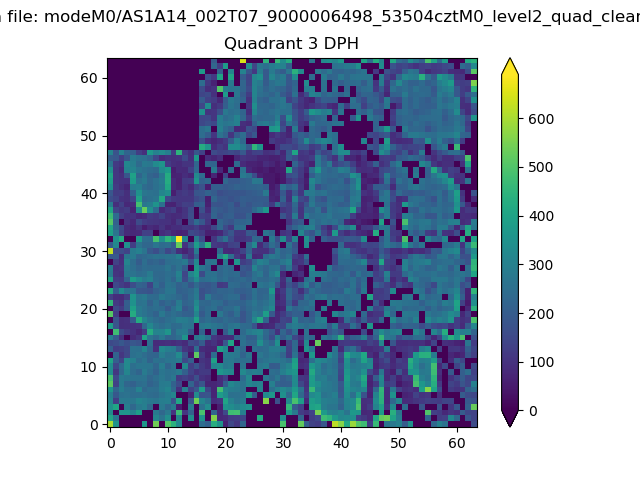 |
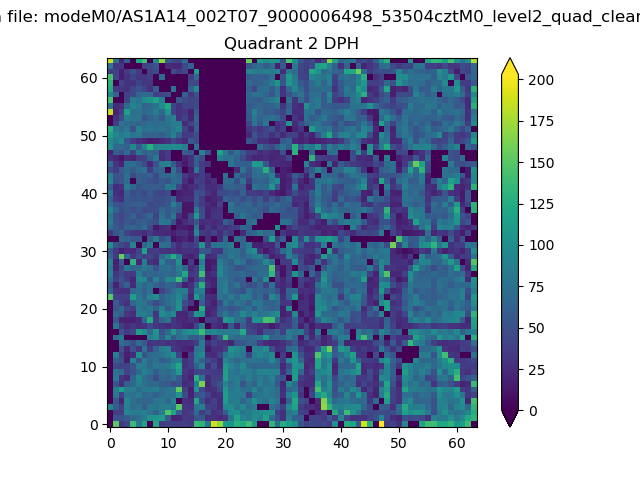 |
Quadrant C |
| Plot type | Count rate plots | Images |
|---|---|---|
| Comparison with Poisson distribution Blue bars denote a histogram of data divided into 1 sec bins. Red curve is a Poisson curve with rate = median count rate of data. |
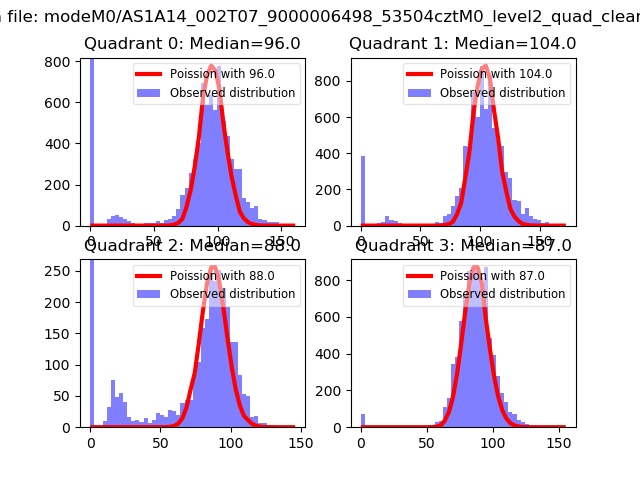 |
 |
| Quadrant-wise count rates Data is divided into 100 sec bins |
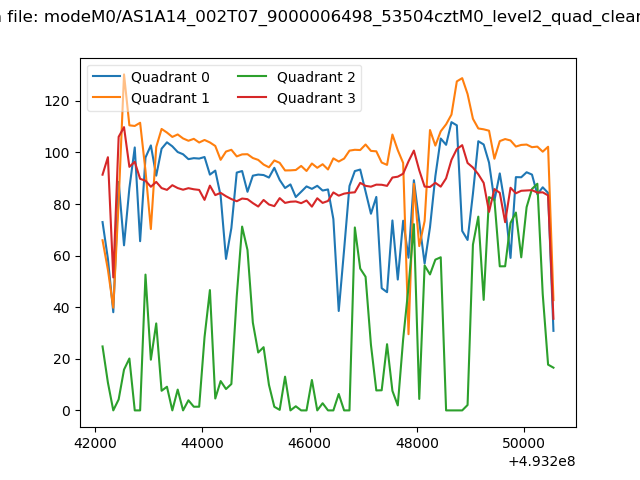 |
|
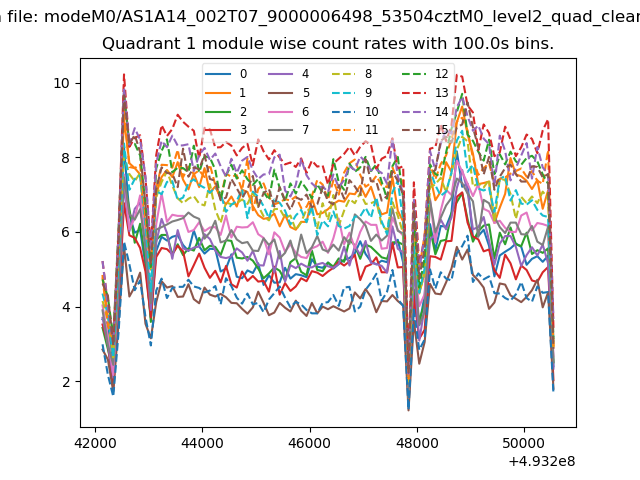
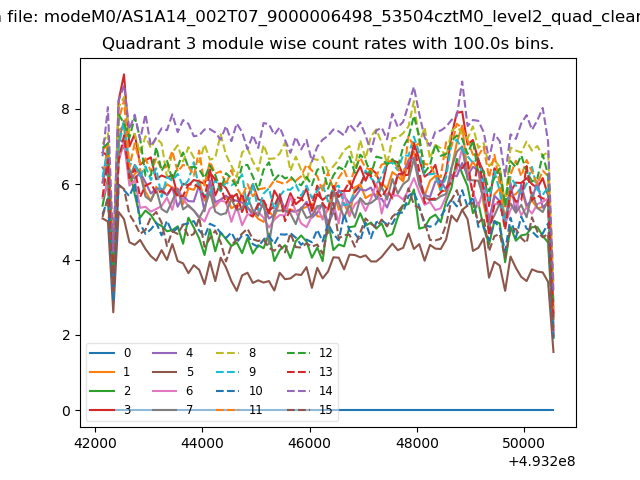
| Module-wise count rates for Quadrant A Data is divided into 100 sec bins |
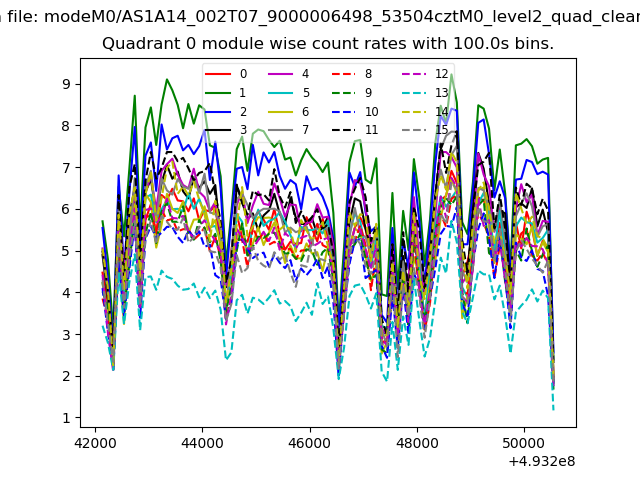 |
 |
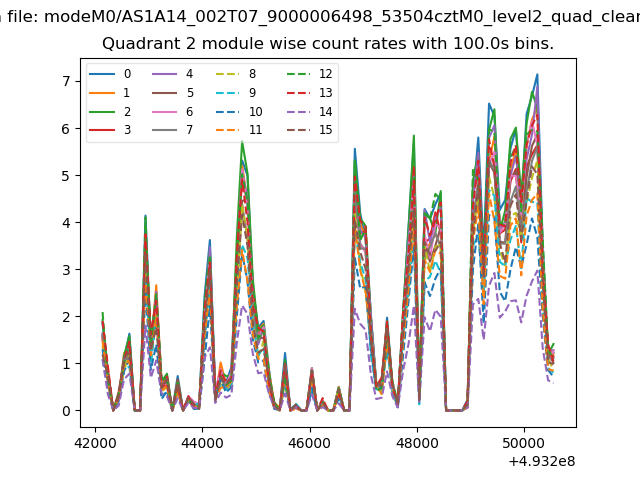
| Module-wise count rates for Quadrant B Data is divided into 100 sec bins |
 |
 |
| Module-wise count rates for Quadrant C Data is divided into 100 sec bins |
 |
 |
| Module-wise count rates for Quadrant D Data is divided into 100 sec bins |
 |
 |
| Parameter | Plot |
|---|---|
| CZT HV Monitor | 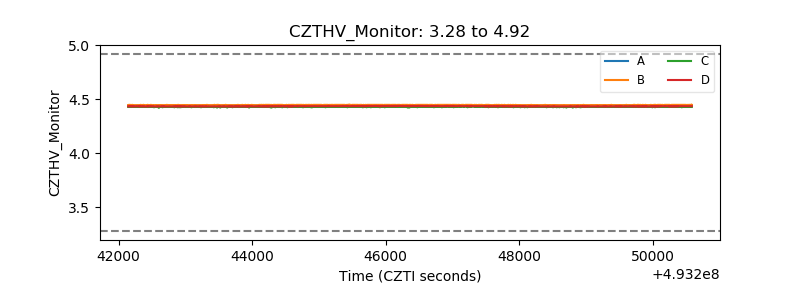 |
| D_VDD | 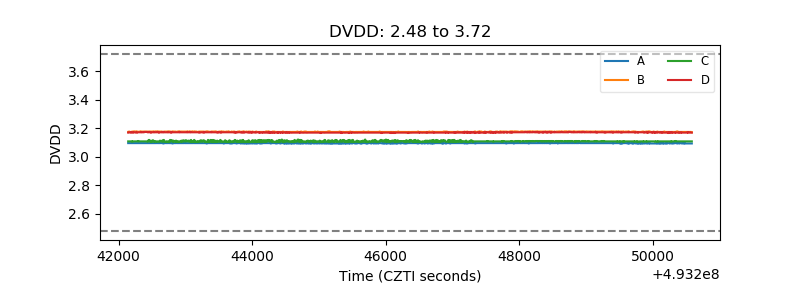 |
| Temperature 1 | 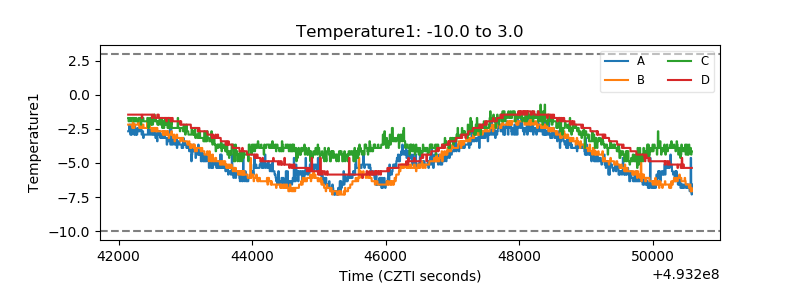 |
| Veto HV Monitor | 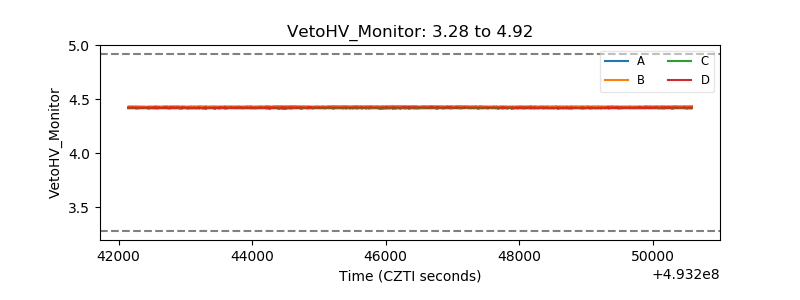 |
| Veto LLD | 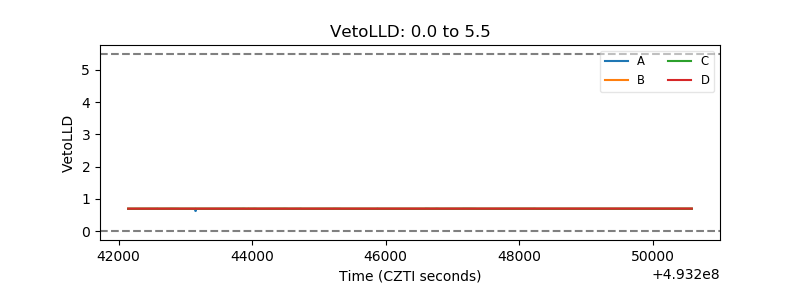 |
| Alpha Counter | 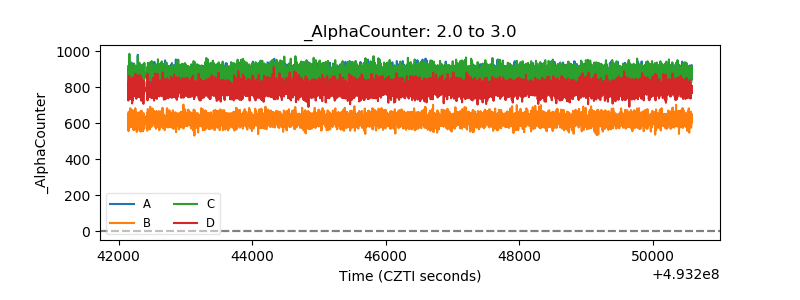 |
| _CPM_Rate | 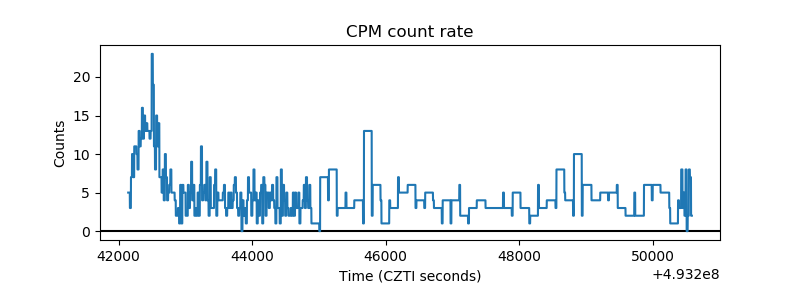 |
| CZT Counter | 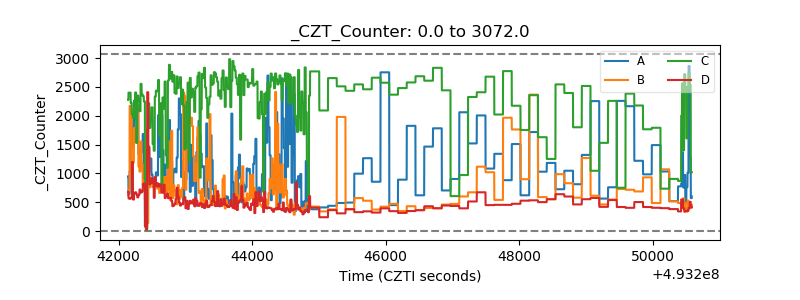 |
| +2.5 Volts monitor | 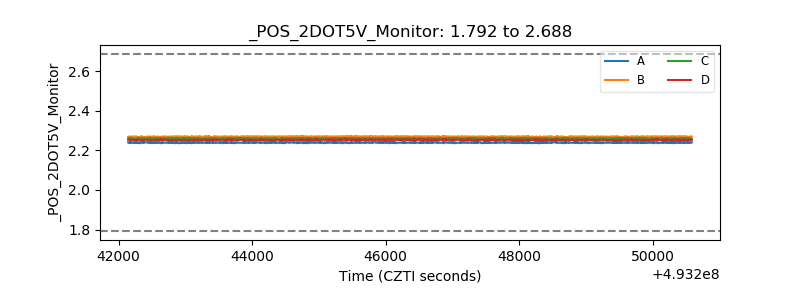 |
| +5 Volts monitor | 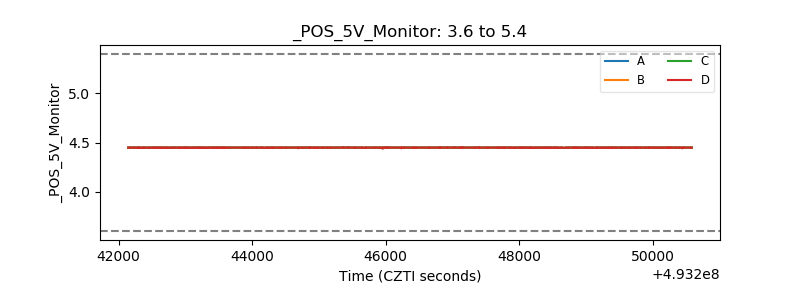 |
| _ROLL_ROT | 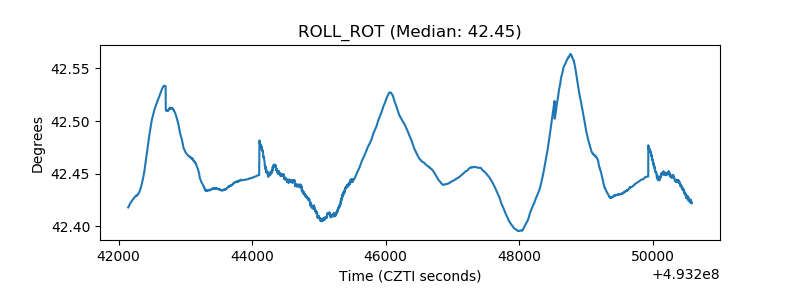 |
| _Roll_DEC | 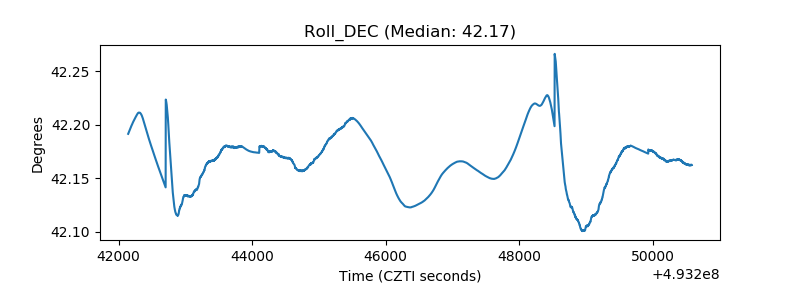 |
| _Roll_RA | 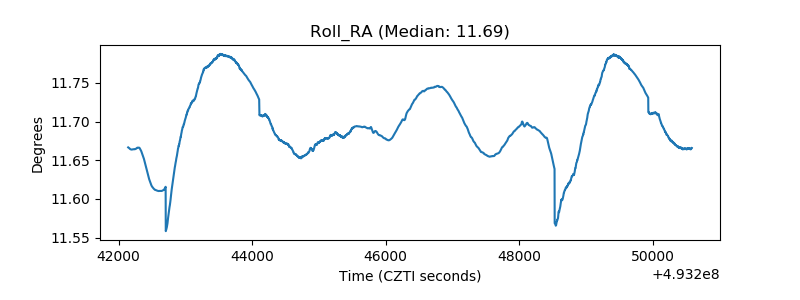 |
| Veto Counter | 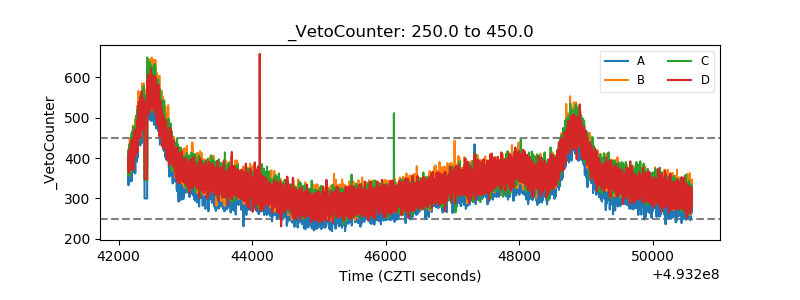 |