| Param | Original file | Final file |
|---|---|---|
| Filename | modeM0/AS1A14_002T07_9000006498_53505cztM0_level2.fits | modeM0/AS1A14_002T07_9000006498_53505cztM0_level2_quad_clean.evt |
| Size (bytes) | 1,148,071,680 | 99,838,080 |
| Size | 1.1 GB | 95.2 MB |
| Events in quadrant A | 11,769,687 | 644,377 |
| Events in quadrant B | 7,407,884 | 841,582 |
| Events in quadrant C | 18,044,209 | 231,705 |
| Events in quadrant D | 4,627,116 | 721,097 |
| Mode SS | |||
|---|---|---|---|
| Quadrant | BADHDUFLAG | Total packets | Discarded packets |
| A | 0 | 168 | 0 |
| B | 0 | 168 | 0 |
| C | 0 | 168 | 0 |
| D | 0 | 168 | 0 |
| Mode M0 | |||
|---|---|---|---|
| Quadrant | BADHDUFLAG | Total packets | Discarded packets |
| A | 0 | 40872 | 0 |
| B | 0 | 27975 | 0 |
| C | 0 | 59369 | 0 |
| D | 0 | 19948 | 0 |
| Quadrant | Total seconds | Saturated seconds | Saturation percentage |
|---|---|---|---|
| A | 8405 | 2302 | 27.388459% |
| B | 8405 | 666 | 7.923855% |
| C | 8406 | 6172 | 73.423745% |
| D | 8406 | 158 | 1.879610% |
Noise dominated data is calculated using 1-second bins in cleaned event files. If a bin has >2000 counts, and if more than 50% of those come from <1% of pixels, then it is considered to be noise-dominated and hence unusable.
| Quadrant | # 1 sec bins | Bins with >0 counts | Bins with >2000 counts | High rate bins dominated by noise | Noise dominated (total time) | Noise dominated (detector-on time) | Marked lightcurve |
|---|---|---|---|---|---|---|---|
| A | 8405 | 8405 | 2015 | 2015 | 23.97% | 23.97% | 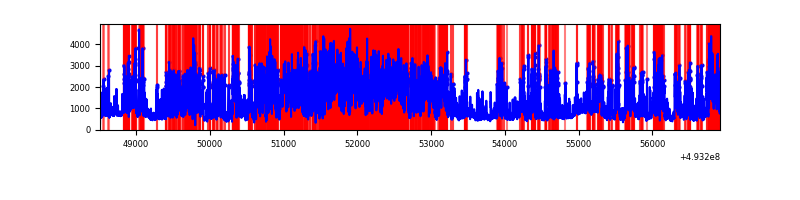 |
| B | 8405 | 8405 | 300 | 300 | 3.57% | 3.57% | 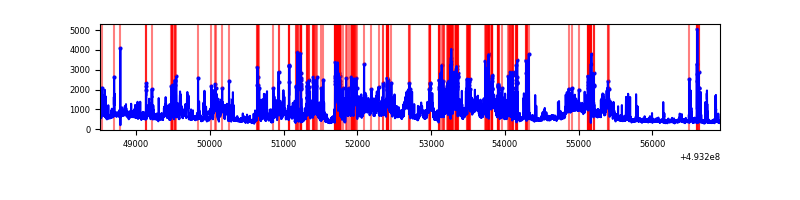 |
| C | 8406 | 8406 | 5299 | 5299 | 63.04% | 63.04% | 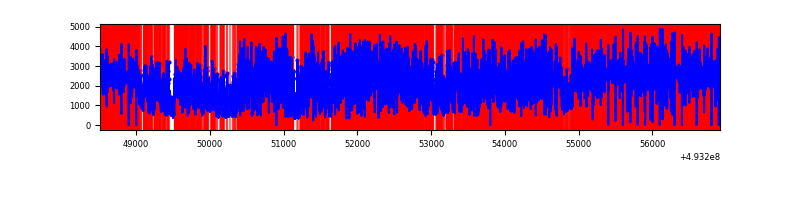 |
| D | 8406 | 8406 | 121 | 121 | 1.44% | 1.44% | 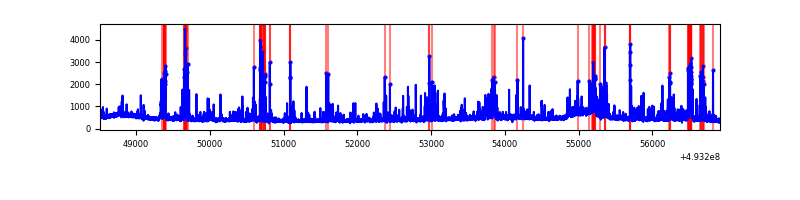 |
Top three noisy pixels from each quadrant. If the there are fewer than three noisy pixels in the level2.evt file, extra rows are filled as -1
| Pixel properties | Quadrant properties | ||||||
|---|---|---|---|---|---|---|---|
| Quadrant | DetID | PixID | Counts | Sigma | Mean | Median | Sigma |
| A | 3 | 62 | 5761962 | 27627.67 | 846 | 825 | 208.5 |
| A | 3 | 63 | 1235689 | 5921.82 | 846 | 825 | 208.5 |
| A | 15 | 174 | 1041271 | 4989.48 | 846 | 825 | 208.5 |
| B | 4 | 171 | 1316945 | 6696.64 | 911 | 878 | 196.5 |
| B | 4 | 206 | 782041 | 3974.85 | 911 | 878 | 196.5 |
| B | 2 | 249 | 568420 | 2887.86 | 911 | 878 | 196.5 |
| C | 7 | 64 | 11326431 | 85393.63 | 483 | 479 | 132.6 |
| C | 1 | 241 | 1200704 | 9049.27 | 483 | 479 | 132.6 |
| C | 15 | 224 | 1046063 | 7883.33 | 483 | 479 | 132.6 |
| D | 3 | 12 | 289242 | 1123.11 | 904 | 866 | 256.8 |
| D | 7 | 110 | 169848 | 658.12 | 904 | 866 | 256.8 |
| D | 1 | 0 | 129884 | 502.47 | 904 | 866 | 256.8 |
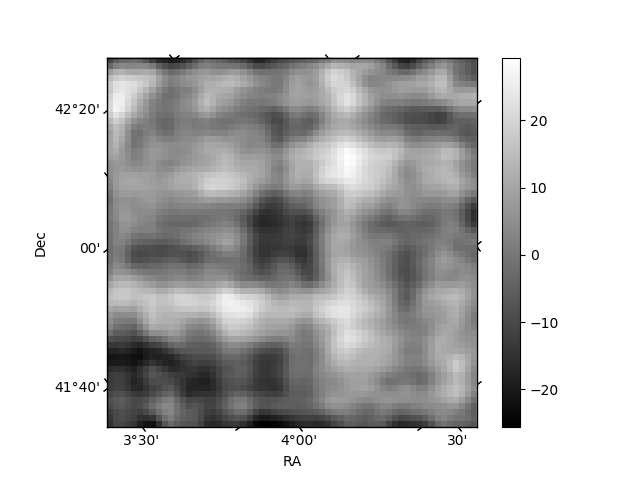
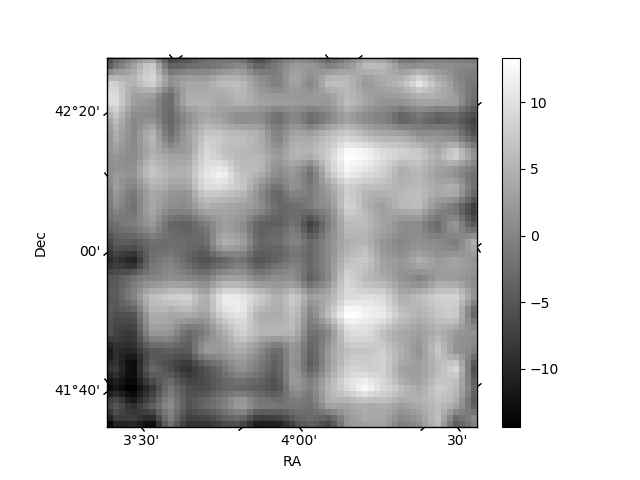
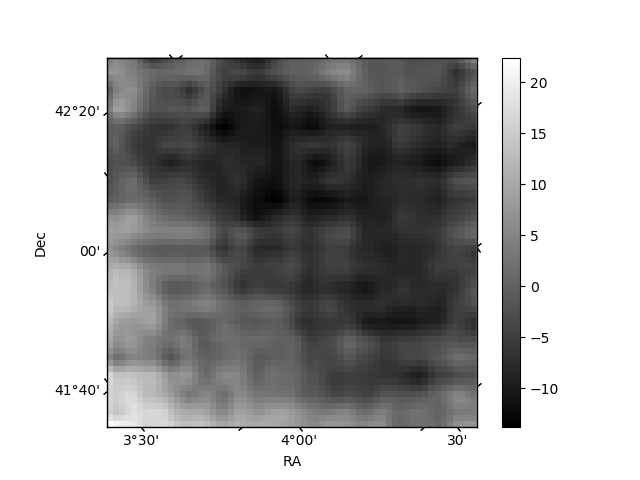
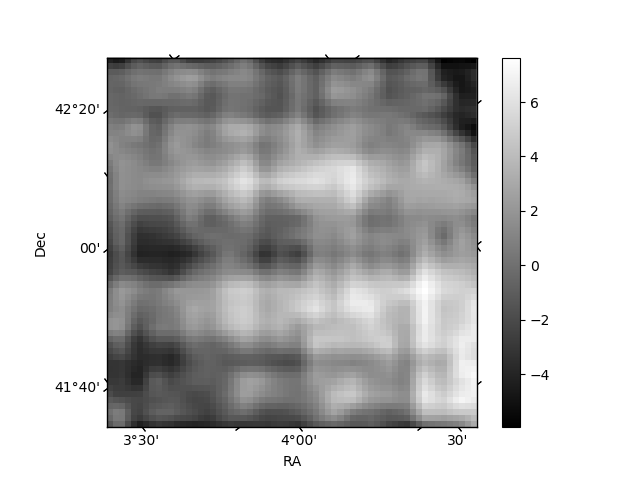
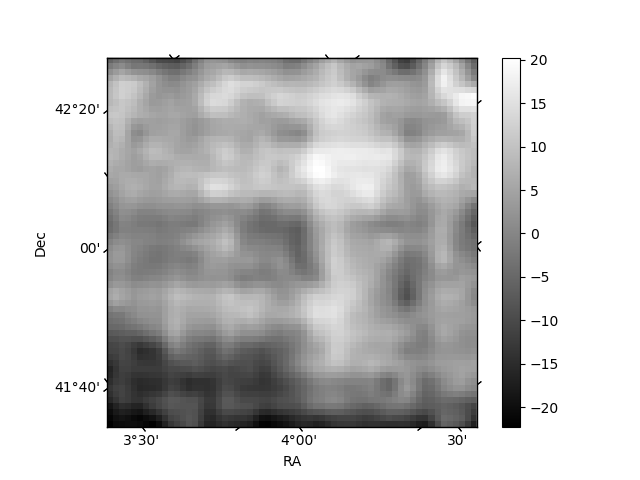
Histogram calculated using DETX and DETY for each event in the final _common_clean file
| Quadrant A | 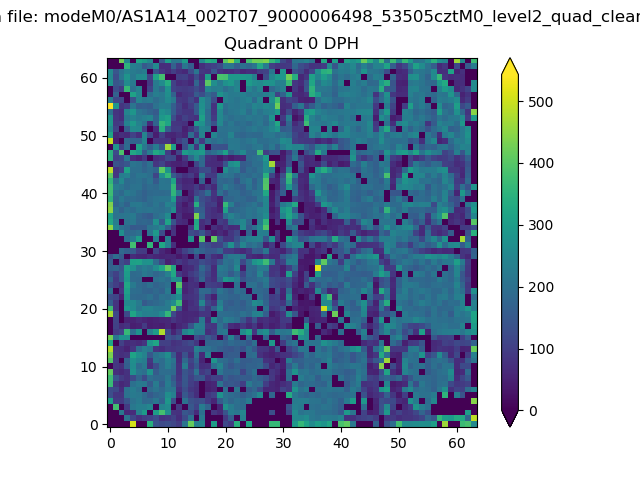 |
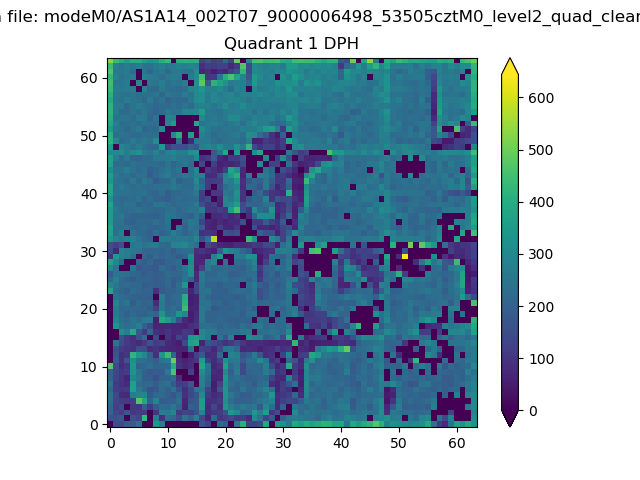 |
Quadrant B |
|---|---|---|---|
| Quadrant D | 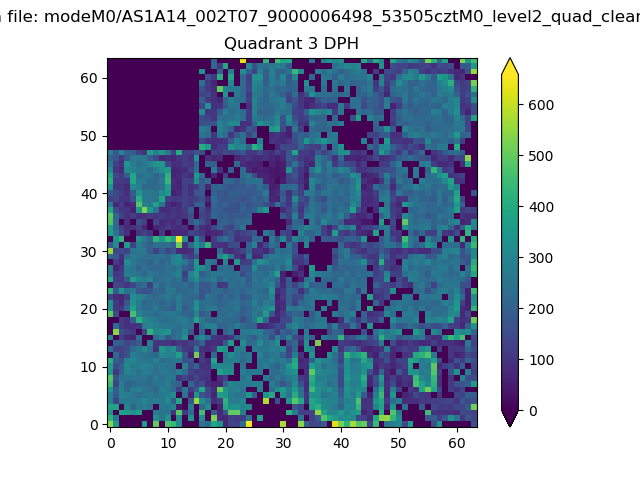 |
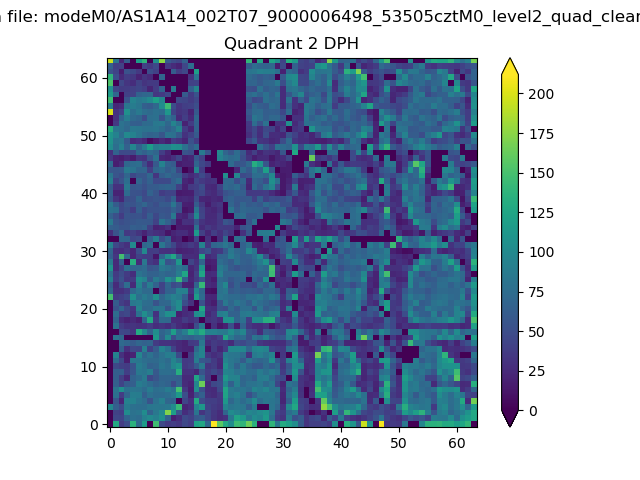 |
Quadrant C |
| Plot type | Count rate plots | Images |
|---|---|---|
| Comparison with Poisson distribution Blue bars denote a histogram of data divided into 1 sec bins. Red curve is a Poisson curve with rate = median count rate of data. |
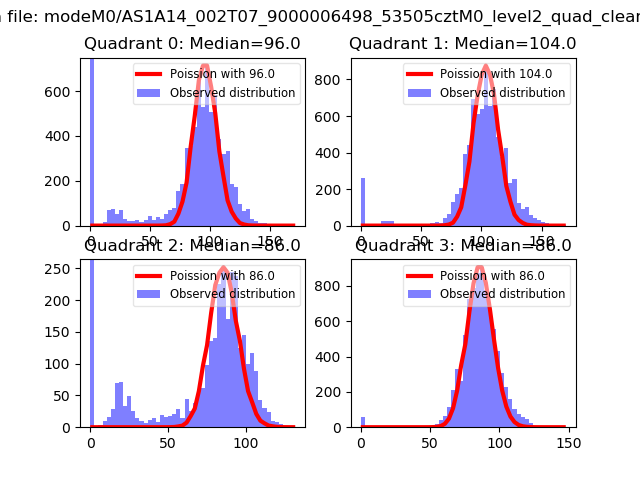 |
 |
| Quadrant-wise count rates Data is divided into 100 sec bins |
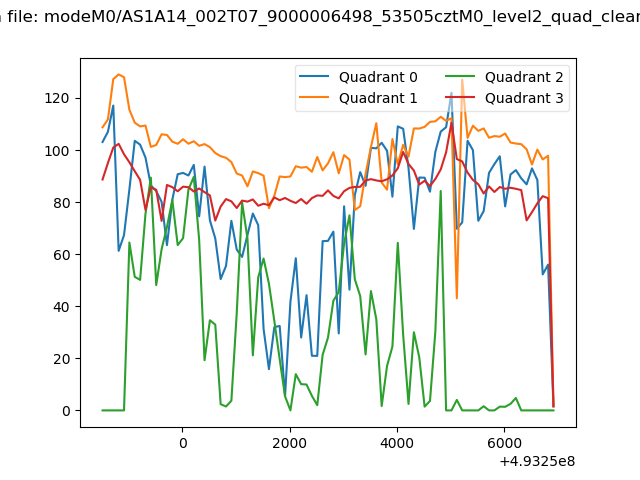 |
|
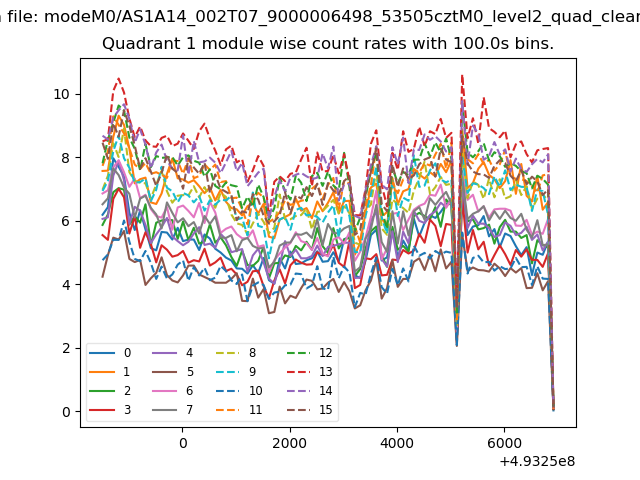
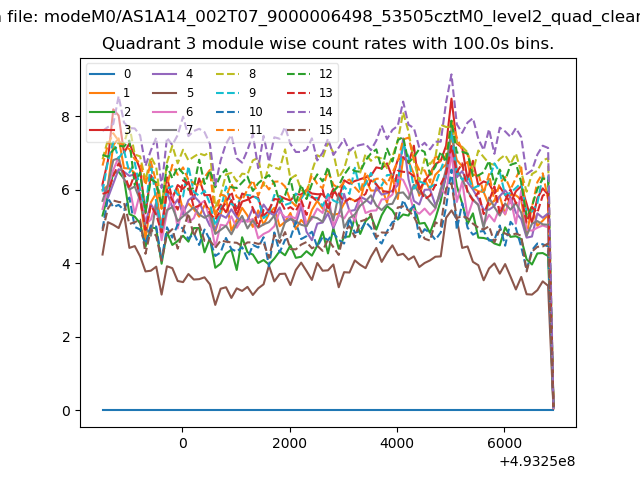
| Module-wise count rates for Quadrant A Data is divided into 100 sec bins |
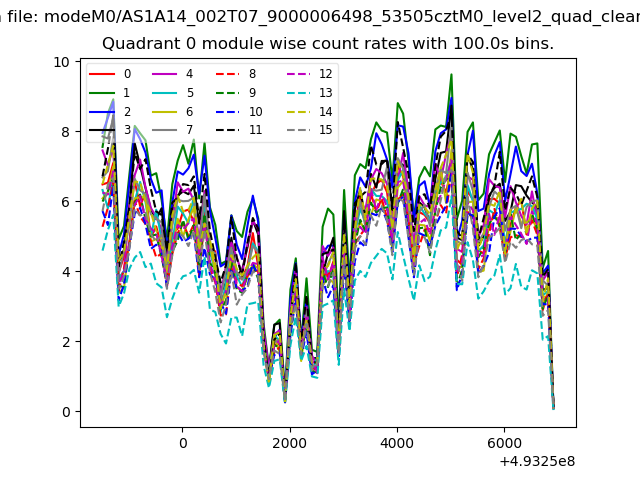 |
 |
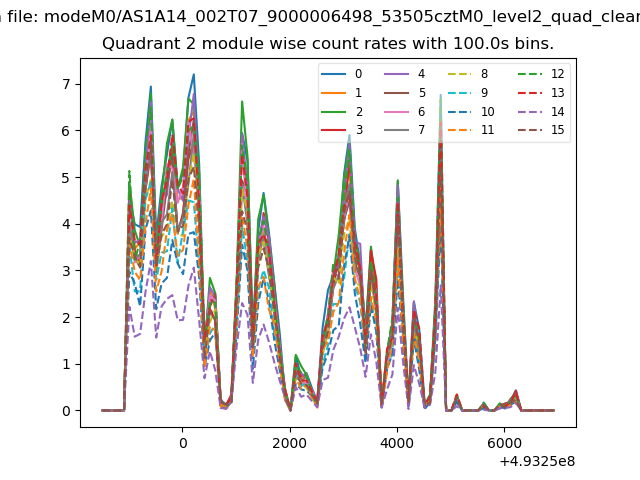
| Module-wise count rates for Quadrant B Data is divided into 100 sec bins |
 |
 |
| Module-wise count rates for Quadrant C Data is divided into 100 sec bins |
 |
 |
| Module-wise count rates for Quadrant D Data is divided into 100 sec bins |
 |
 |
| Parameter | Plot |
|---|---|
| CZT HV Monitor | 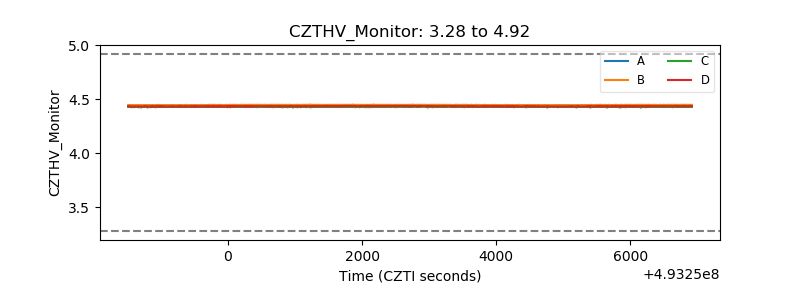 |
| D_VDD | 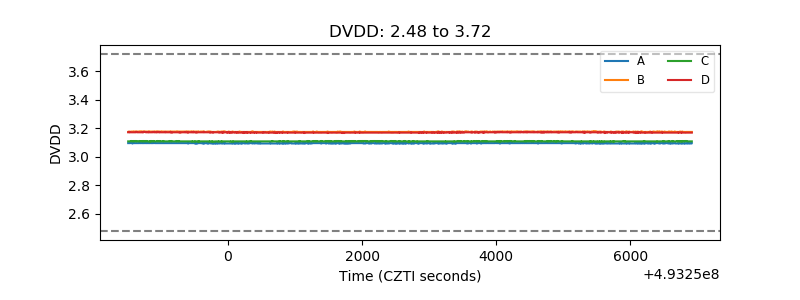 |
| Temperature 1 | 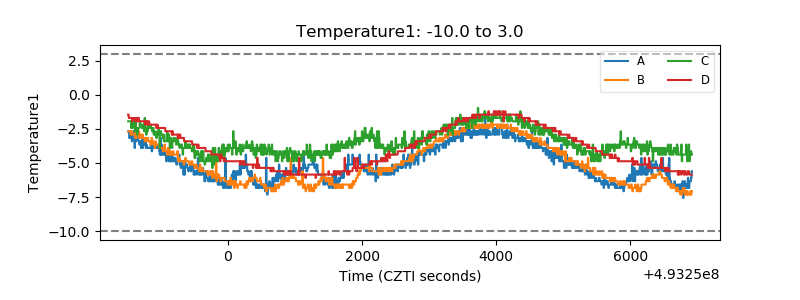 |
| Veto HV Monitor | 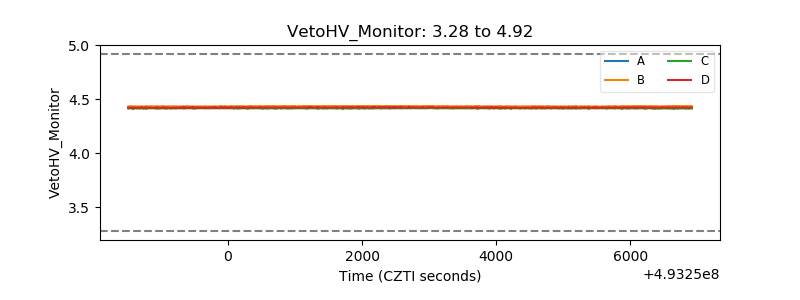 |
| Veto LLD | 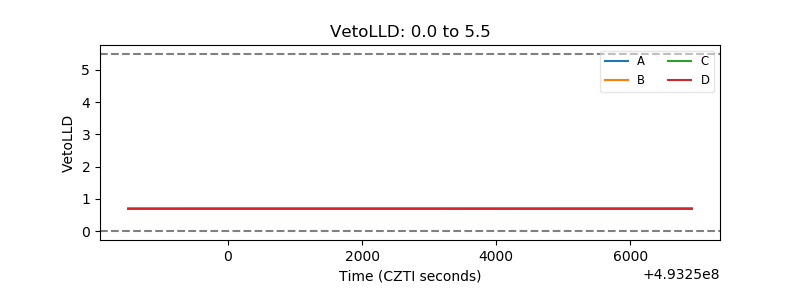 |
| Alpha Counter | 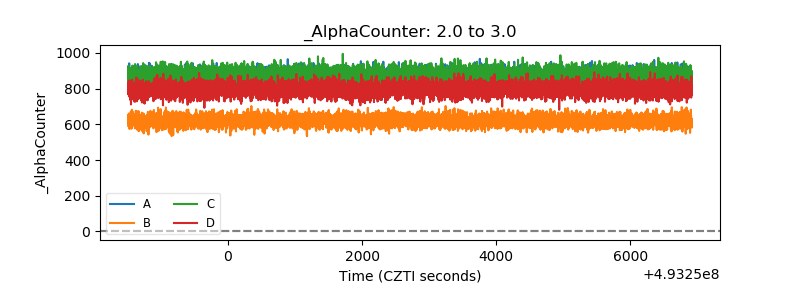 |
| _CPM_Rate | 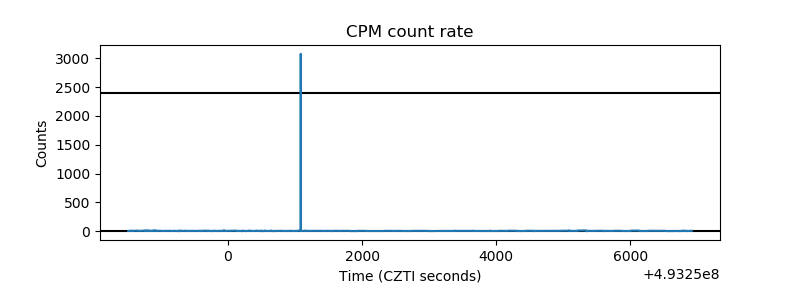 |
| CZT Counter | 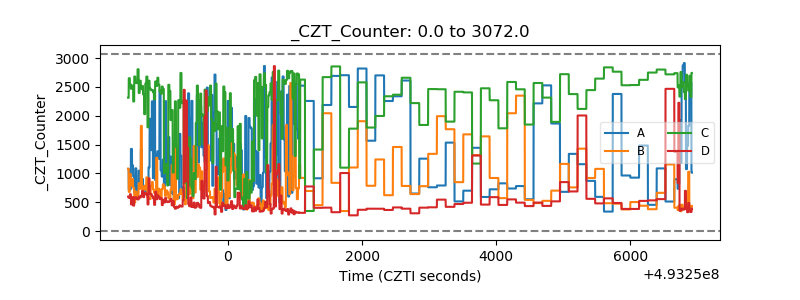 |
| +2.5 Volts monitor | 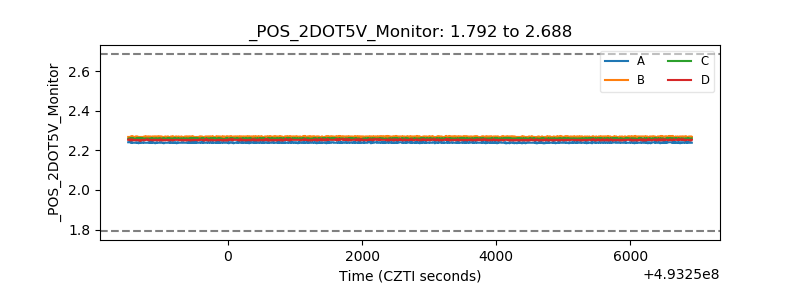 |
| +5 Volts monitor | 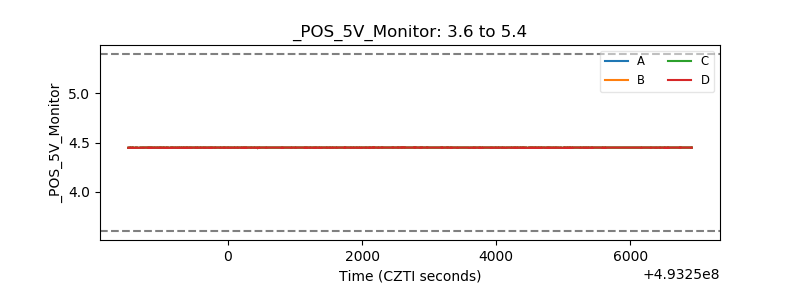 |
| _ROLL_ROT | 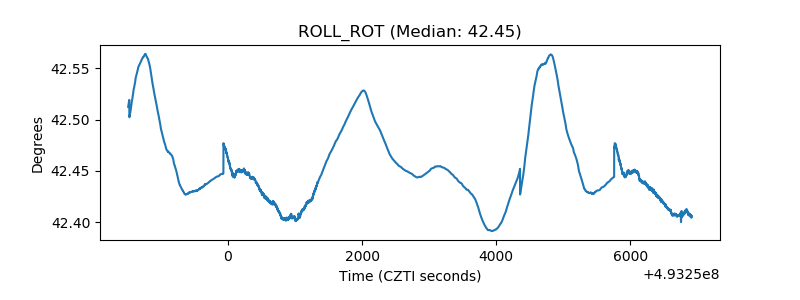 |
| _Roll_DEC | 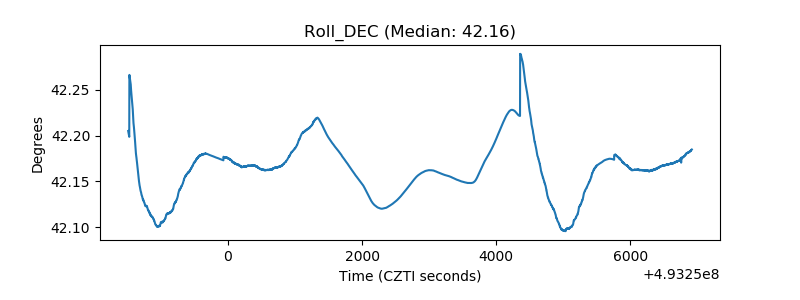 |
| _Roll_RA | 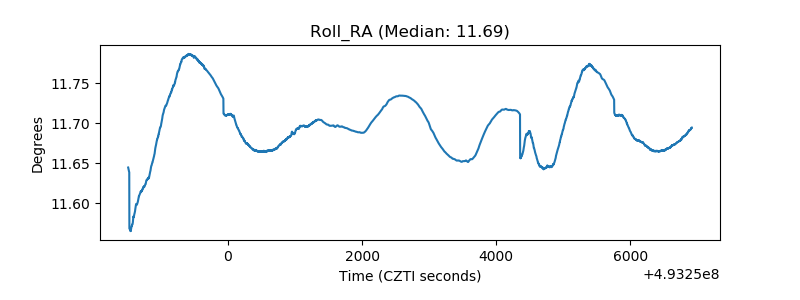 |
| Veto Counter | 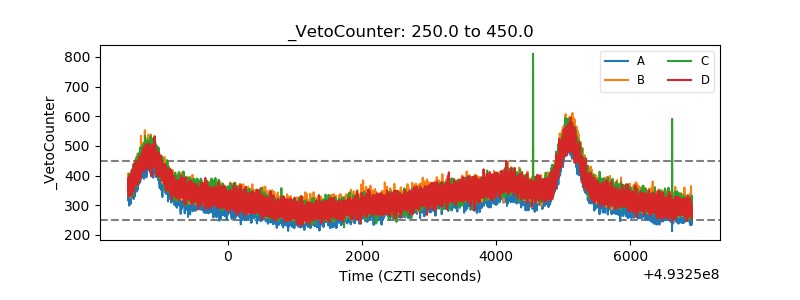 |