| Param | Original file | Final file |
|---|---|---|
| Filename | modeM0/AS1A14_002T07_9000006498_53508cztM0_level2.fits | modeM0/AS1A14_002T07_9000006498_53508cztM0_level2_quad_clean.evt |
| Size (bytes) | 1,529,599,680 | 131,544,000 |
| Size | 1.4 GB | 125.5 MB |
| Events in quadrant A | 23,786,823 | 429,228 |
| Events in quadrant B | 5,932,244 | 1,182,237 |
| Events in quadrant C | 19,207,334 | 614,586 |
| Events in quadrant D | 6,792,478 | 947,683 |
| Mode SS | |||
|---|---|---|---|
| Quadrant | BADHDUFLAG | Total packets | Discarded packets |
| A | 0 | 239 | 0 |
| B | 0 | 241 | 1 |
| C | 0 | 240 | 0 |
| D | 0 | 241 | 3 |
| Mode M9 | |||
|---|---|---|---|
| Quadrant | BADHDUFLAG | Total packets | Discarded packets |
| A | 0 | 13 | 1 |
| B | 0 | 12 | 0 |
| C | 0 | 12 | 0 |
| D | 0 | 13 | 1 |
| Mode M0 | |||
|---|---|---|---|
| Quadrant | BADHDUFLAG | Total packets | Discarded packets |
| A | 0 | 79800 | 1174 |
| B | 0 | 26126 | 223 |
| C | 0 | 66078 | 862 |
| D | 0 | 29263 | 208 |
| Quadrant | Total seconds | Saturated seconds | Saturation percentage |
|---|---|---|---|
| A | 11640 | 7595 | 65.249141% |
| B | 11706 | 178 | 1.520588% |
| C | 11669 | 5169 | 44.296855% |
| D | 11712 | 461 | 3.936134% |
Noise dominated data is calculated using 1-second bins in cleaned event files. If a bin has >2000 counts, and if more than 50% of those come from <1% of pixels, then it is considered to be noise-dominated and hence unusable.
| Quadrant | # 1 sec bins | Bins with >0 counts | Bins with >2000 counts | High rate bins dominated by noise | Noise dominated (total time) | Noise dominated (detector-on time) | Marked lightcurve |
|---|---|---|---|---|---|---|---|
| A | 12934 | 11706 | 6459 | 6459 | 49.94% | 55.18% | 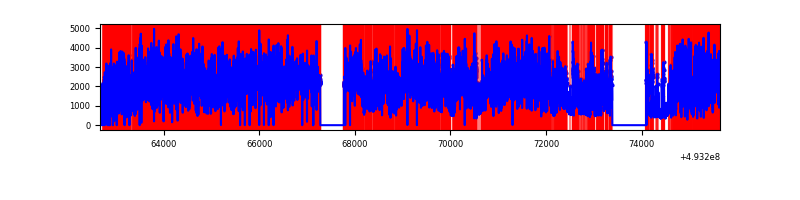 |
| B | 12970 | 11738 | 21 | 21 | 0.16% | 0.18% | 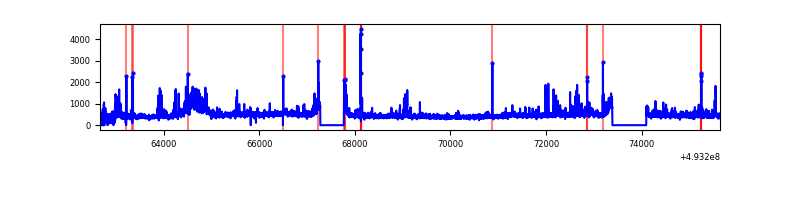 |
| C | 12950 | 11719 | 4370 | 4370 | 33.75% | 37.29% | 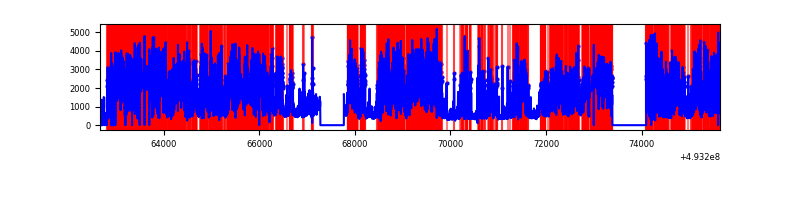 |
| D | 12962 | 11737 | 339 | 339 | 2.62% | 2.89% | 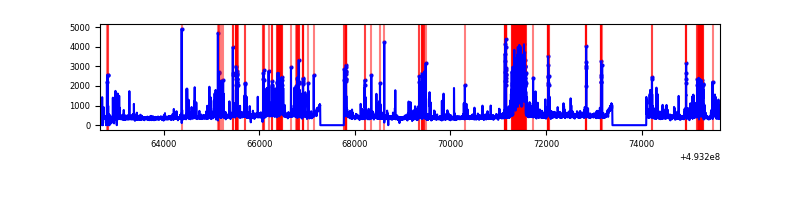 |
Top three noisy pixels from each quadrant. If the there are fewer than three noisy pixels in the level2.evt file, extra rows are filled as -1
| Pixel properties | Quadrant properties | ||||||
|---|---|---|---|---|---|---|---|
| Quadrant | DetID | PixID | Counts | Sigma | Mean | Median | Sigma |
| A | 3 | 62 | 13324513 | 66360.98 | 816 | 797 | 200.8 |
| A | 3 | 63 | 3956508 | 19702.07 | 816 | 797 | 200.8 |
| A | 15 | 174 | 3151175 | 15690.98 | 816 | 797 | 200.8 |
| B | 10 | 254 | 366357 | 1387.43 | 1237 | 1193 | 263.2 |
| B | 10 | 28 | 100617 | 377.76 | 1237 | 1193 | 263.2 |
| B | 5 | 185 | 93510 | 350.76 | 1237 | 1193 | 263.2 |
| C | 7 | 64 | 12386886 | 47800.59 | 947 | 943 | 259.1 |
| C | 15 | 224 | 1165896 | 4495.86 | 947 | 943 | 259.1 |
| C | 15 | 182 | 381599 | 1469.05 | 947 | 943 | 259.1 |
| D | 8 | 208 | 790938 | 2314.18 | 1195 | 1143 | 341.3 |
| D | 13 | 153 | 293637 | 857.04 | 1195 | 1143 | 341.3 |
| D | 2 | 249 | 263485 | 768.69 | 1195 | 1143 | 341.3 |
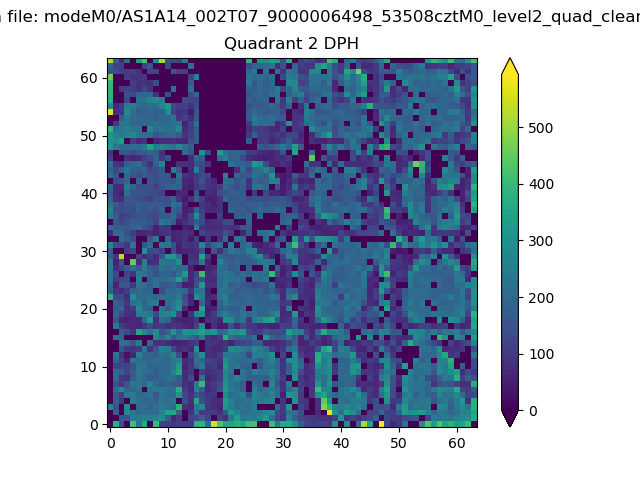
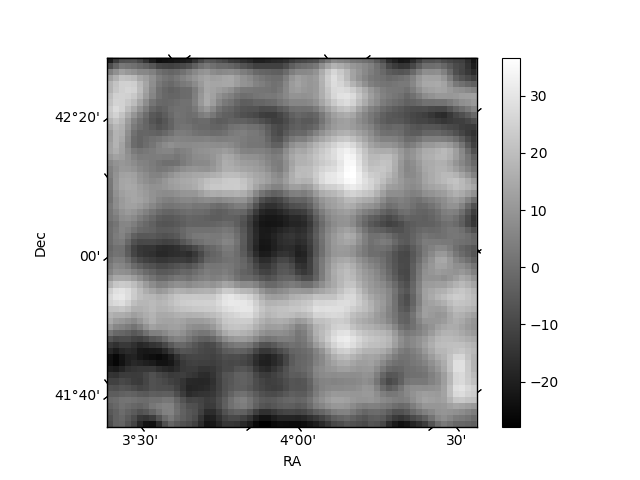
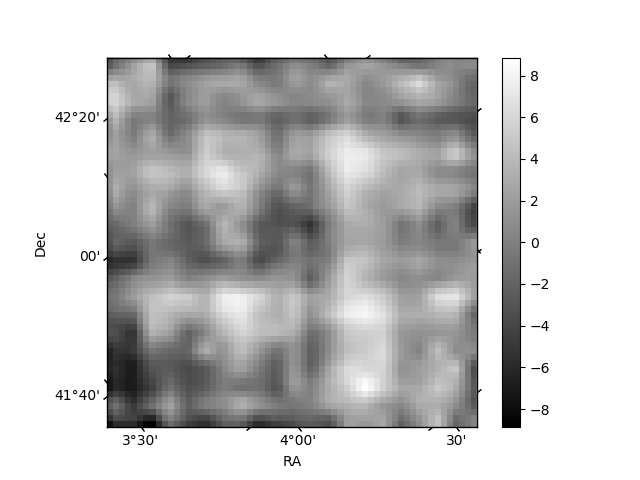
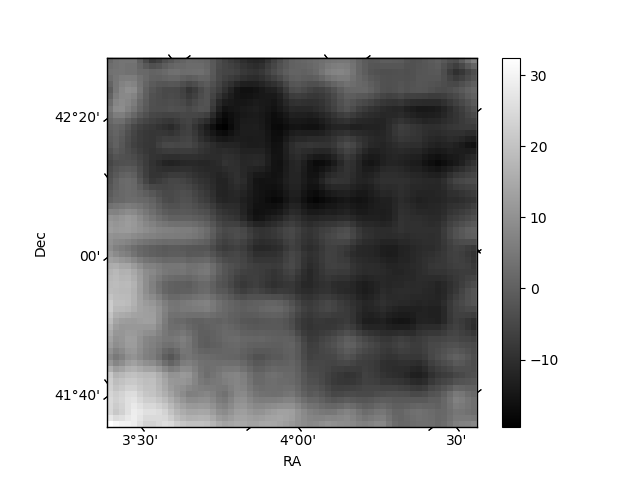
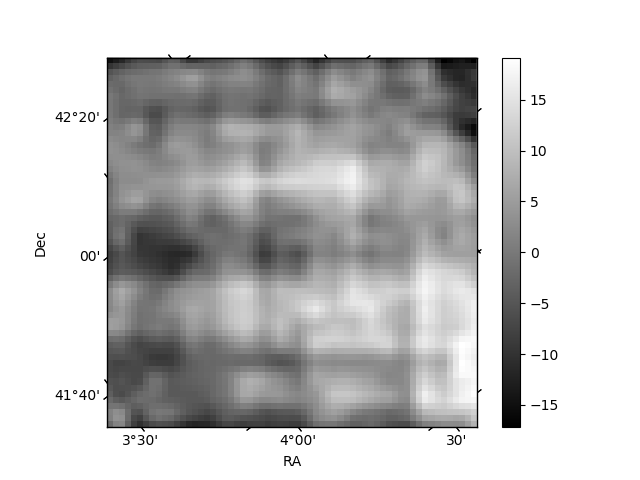
Histogram calculated using DETX and DETY for each event in the final _common_clean file
| Quadrant A | 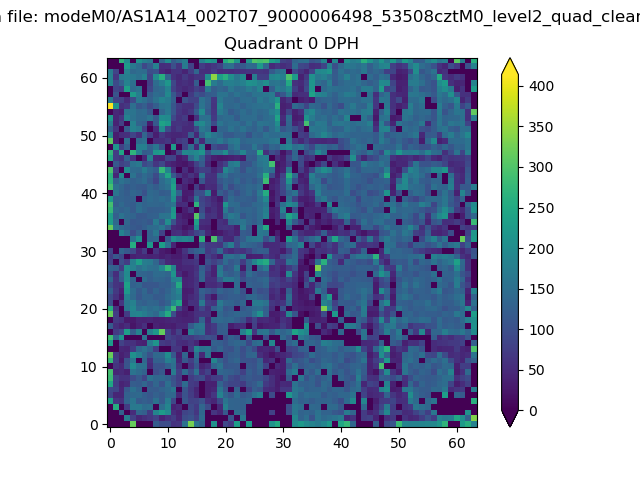 |
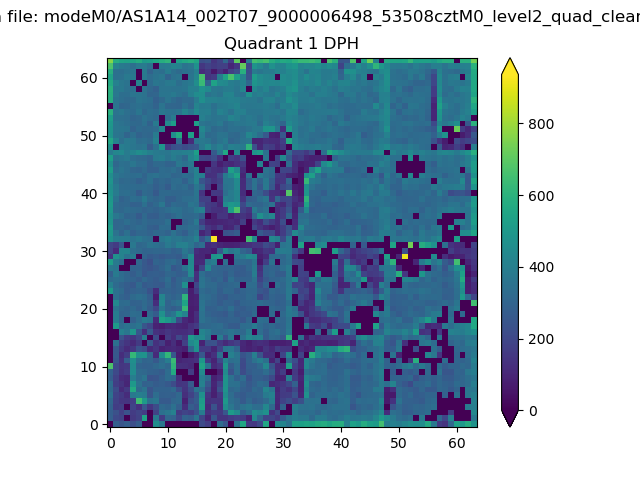 |
Quadrant B |
|---|---|---|---|
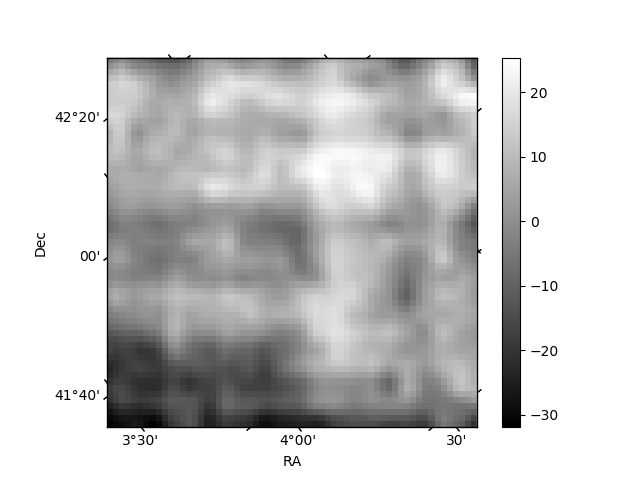
| Quadrant D | 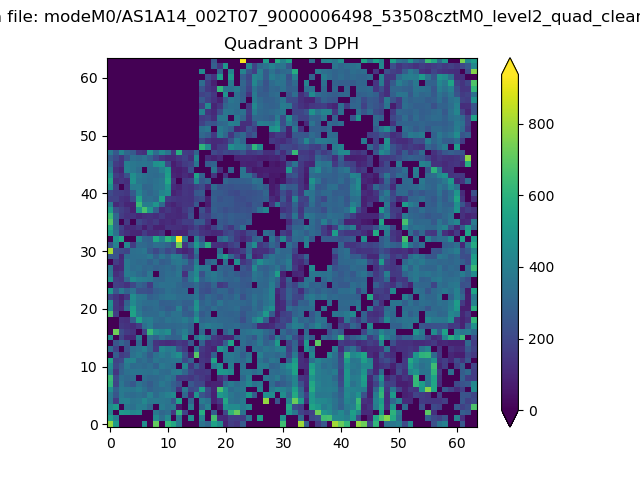 |
 |
Quadrant C |
| Plot type | Count rate plots | Images |
|---|---|---|
| Comparison with Poisson distribution Blue bars denote a histogram of data divided into 1 sec bins. Red curve is a Poisson curve with rate = median count rate of data. |
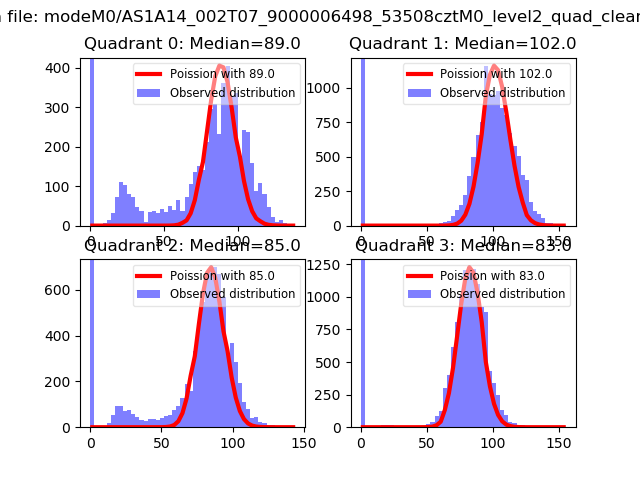 |
 |
| Quadrant-wise count rates Data is divided into 100 sec bins |
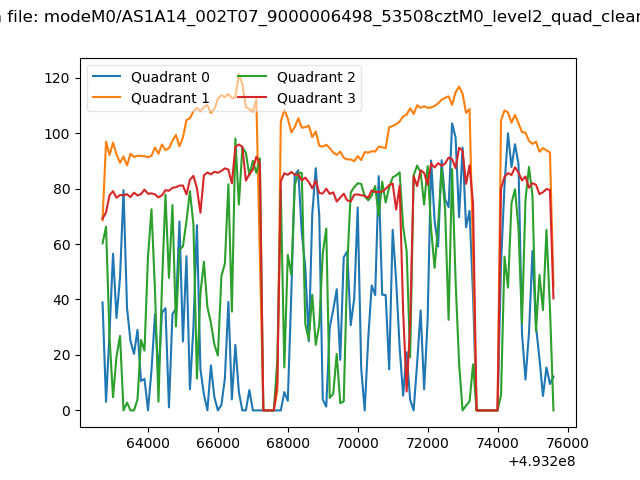 |
|
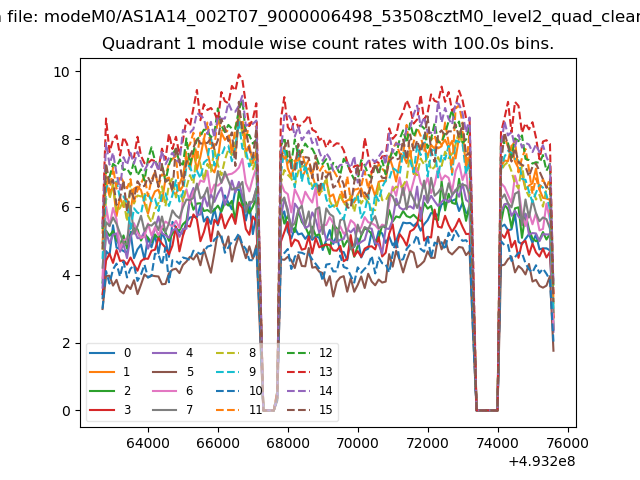
| Module-wise count rates for Quadrant A Data is divided into 100 sec bins |
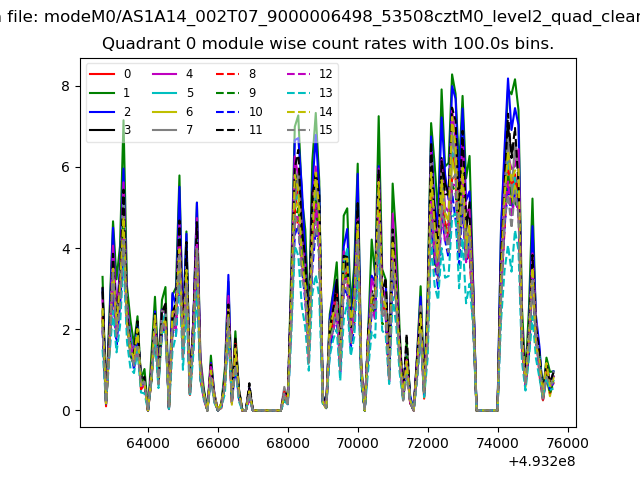 |
 |
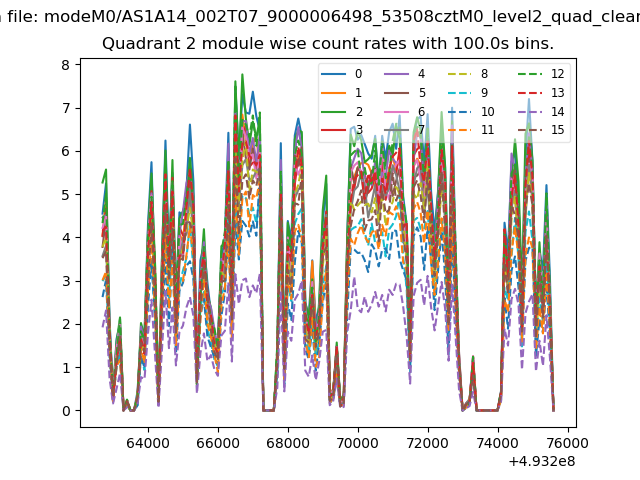
| Module-wise count rates for Quadrant B Data is divided into 100 sec bins |
 |
 |
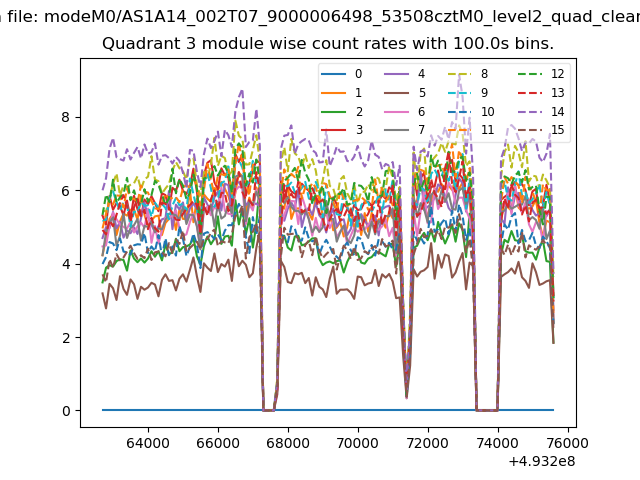
| Module-wise count rates for Quadrant C Data is divided into 100 sec bins |
 |
 |
| Module-wise count rates for Quadrant D Data is divided into 100 sec bins |
 |
 |
| Parameter | Plot |
|---|---|
| CZT HV Monitor | 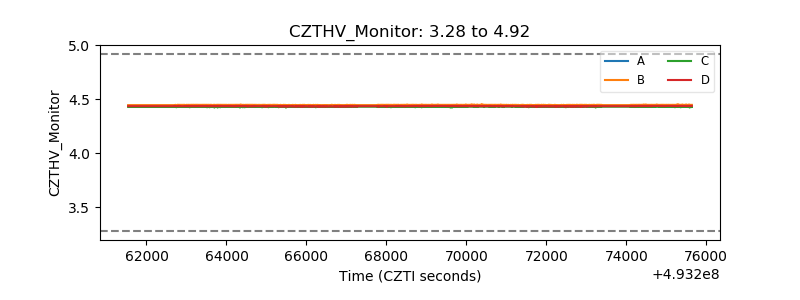 |
| D_VDD | 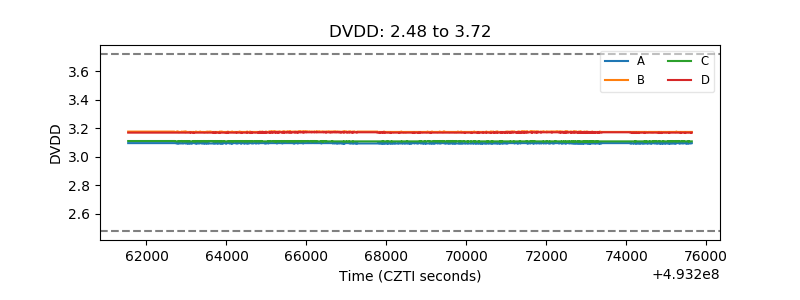 |
| Temperature 1 | 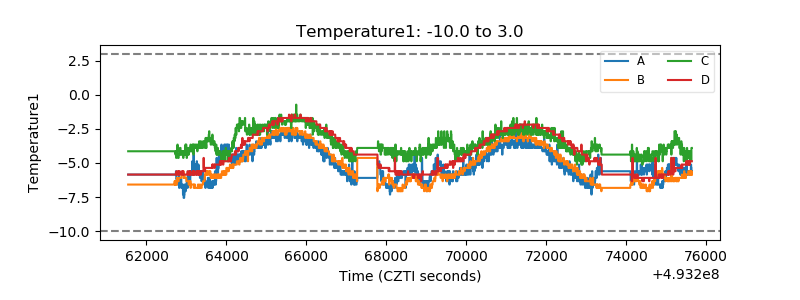 |
| Veto HV Monitor | 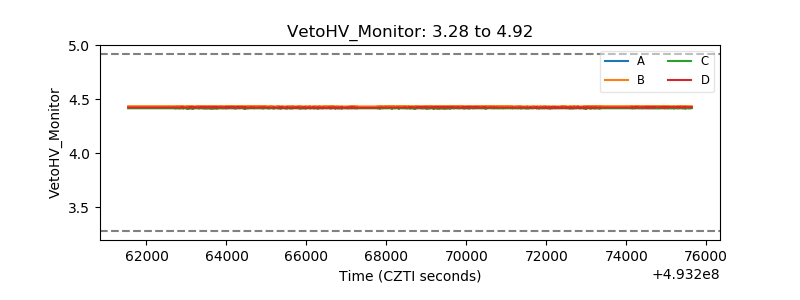 |
| Veto LLD | 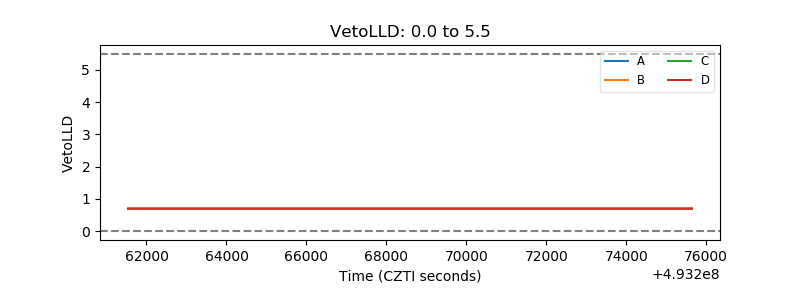 |
| Alpha Counter | 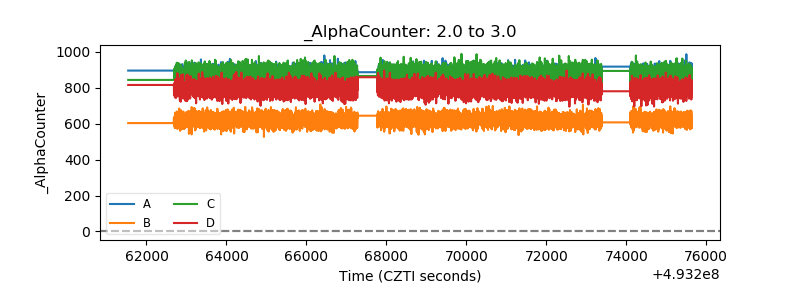 |
| _CPM_Rate | 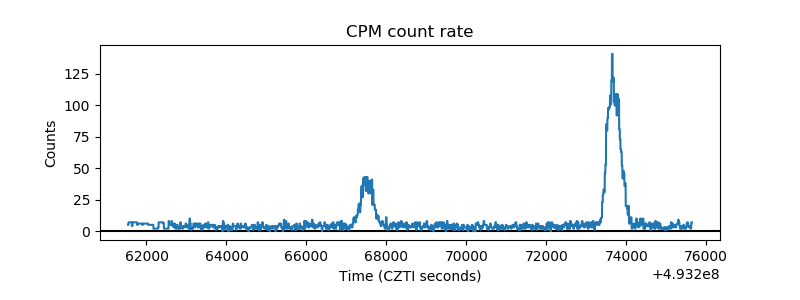 |
| CZT Counter | 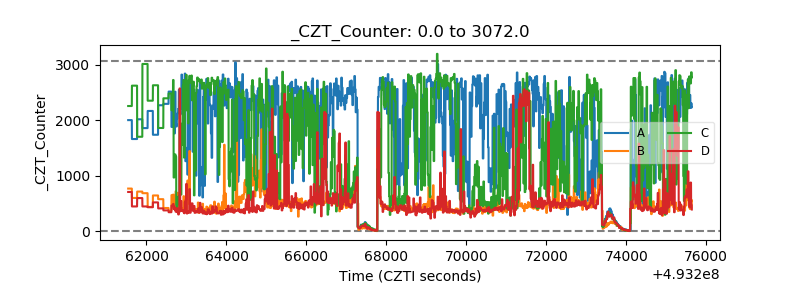 |
| +2.5 Volts monitor | 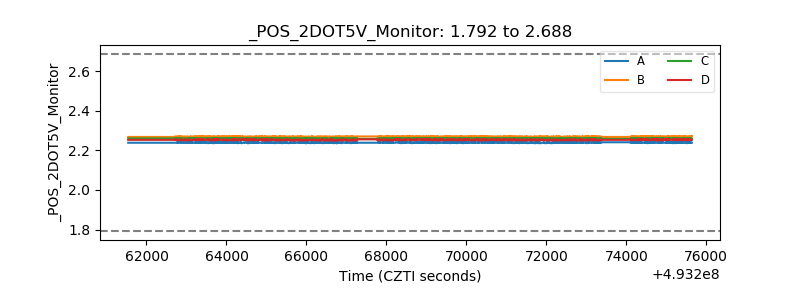 |
| +5 Volts monitor | 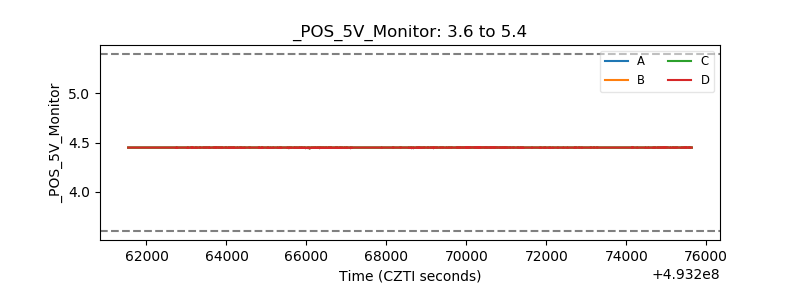 |
| _ROLL_ROT | 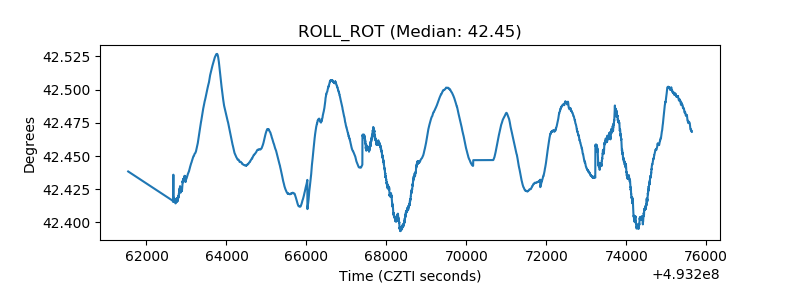 |
| _Roll_DEC | 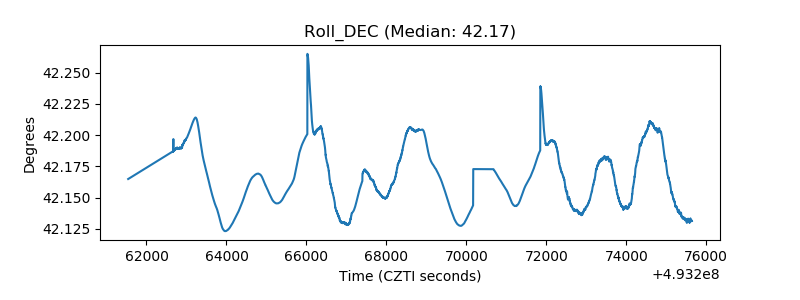 |
| _Roll_RA | 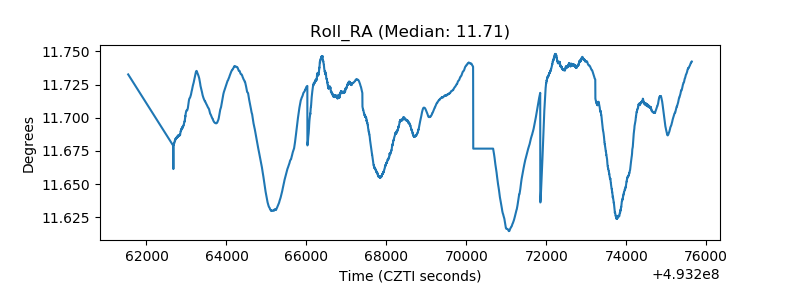 |
| Veto Counter | 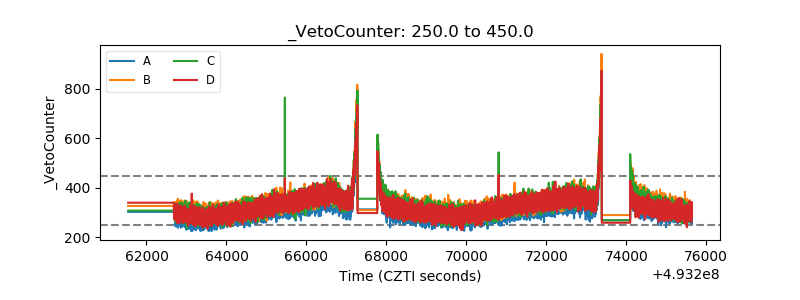 |