| Param | Original file | Final file |
|---|---|---|
| Filename | modeM0/AS1A14_002T07_9000006498_53509cztM0_level2.fits | modeM0/AS1A14_002T07_9000006498_53509cztM0_level2_quad_clean.evt |
| Size (bytes) | 886,233,600 | 61,842,240 |
| Size | 845.2 MB | 59.0 MB |
| Events in quadrant A | 12,626,363 | 184,668 |
| Events in quadrant B | 3,097,769 | 609,957 |
| Events in quadrant C | 12,660,445 | 181,776 |
| Events in quadrant D | 3,961,505 | 481,167 |
| Mode SS | |||
|---|---|---|---|
| Quadrant | BADHDUFLAG | Total packets | Discarded packets |
| A | 0 | 120 | 0 |
| B | 0 | 122 | 0 |
| C | 0 | 122 | 0 |
| D | 0 | 122 | 0 |
| Mode M9 | |||
|---|---|---|---|
| Quadrant | BADHDUFLAG | Total packets | Discarded packets |
| A | 0 | 9 | 0 |
| B | 0 | 9 | 0 |
| C | 0 | 9 | 0 |
| D | 0 | 9 | 0 |
| Mode M0 | |||
|---|---|---|---|
| Quadrant | BADHDUFLAG | Total packets | Discarded packets |
| A | 0 | 41614 | 1 |
| B | 0 | 13276 | 1 |
| C | 0 | 41760 | 14 |
| D | 0 | 16072 | 1 |
| Quadrant | Total seconds | Saturated seconds | Saturation percentage |
|---|---|---|---|
| A | 5934 | 4301 | 72.480620% |
| B | 5935 | 76 | 1.280539% |
| C | 5933 | 4126 | 69.543233% |
| D | 5934 | 361 | 6.083586% |
Noise dominated data is calculated using 1-second bins in cleaned event files. If a bin has >2000 counts, and if more than 50% of those come from <1% of pixels, then it is considered to be noise-dominated and hence unusable.
| Quadrant | # 1 sec bins | Bins with >0 counts | Bins with >2000 counts | High rate bins dominated by noise | Noise dominated (total time) | Noise dominated (detector-on time) | Marked lightcurve |
|---|---|---|---|---|---|---|---|
| A | 6819 | 5934 | 3570 | 3570 | 52.35% | 60.16% | 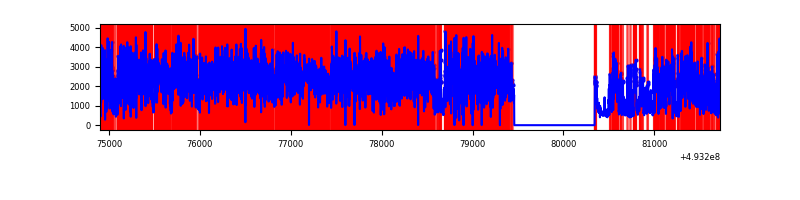 |
| B | 6819 | 5935 | 9 | 9 | 0.13% | 0.15% | 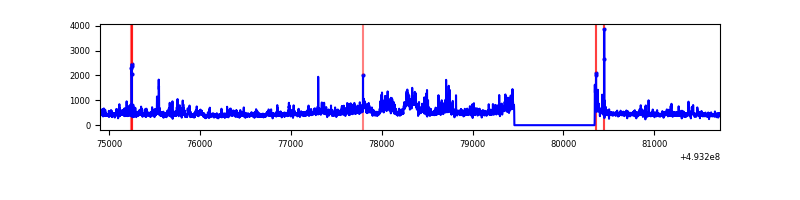 |
| C | 6818 | 5933 | 3598 | 3598 | 52.77% | 60.64% | 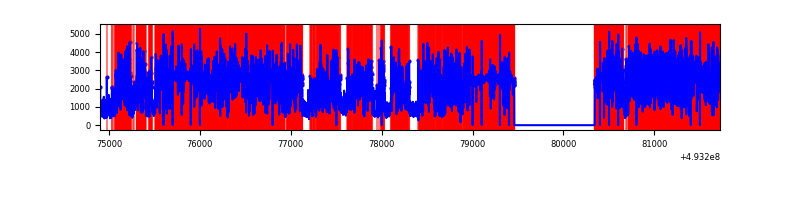 |
| D | 6818 | 5934 | 325 | 325 | 4.77% | 5.48% | 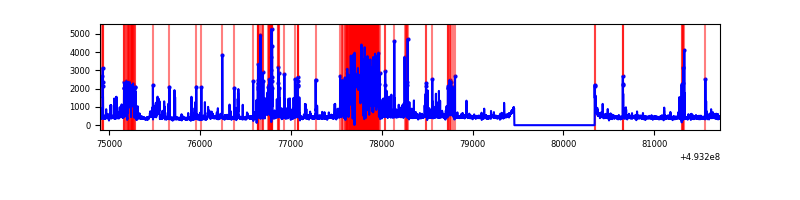 |
Top three noisy pixels from each quadrant. If the there are fewer than three noisy pixels in the level2.evt file, extra rows are filled as -1
| Pixel properties | Quadrant properties | ||||||
|---|---|---|---|---|---|---|---|
| Quadrant | DetID | PixID | Counts | Sigma | Mean | Median | Sigma |
| A | 3 | 62 | 9034688 | 90912.23 | 402 | 393 | 99.4 |
| A | 15 | 174 | 1060905 | 10671.95 | 402 | 393 | 99.4 |
| A | 3 | 63 | 831604 | 8364.49 | 402 | 393 | 99.4 |
| B | 10 | 254 | 139995 | 1032.59 | 629 | 607 | 135.0 |
| B | 10 | 28 | 117436 | 865.48 | 629 | 607 | 135.0 |
| B | 7 | 252 | 113330 | 835.06 | 629 | 607 | 135.0 |
| C | 7 | 64 | 9298057 | 94863.68 | 353 | 349 | 98.0 |
| C | 1 | 241 | 612614 | 6246.88 | 353 | 349 | 98.0 |
| C | 15 | 224 | 443329 | 4519.68 | 353 | 349 | 98.0 |
| D | 3 | 12 | 842726 | 5014.14 | 592 | 567 | 168.0 |
| D | 2 | 249 | 247790 | 1471.94 | 592 | 567 | 168.0 |
| D | 2 | 153 | 226902 | 1347.58 | 592 | 567 | 168.0 |
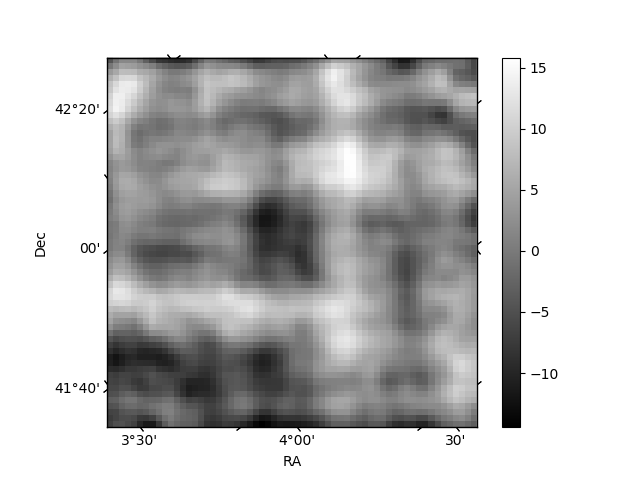
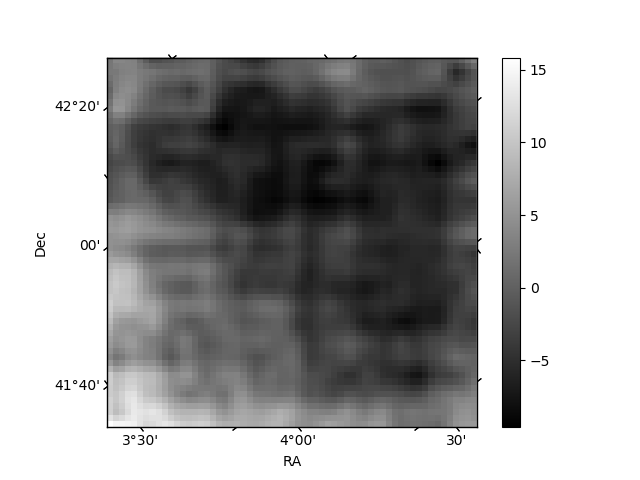
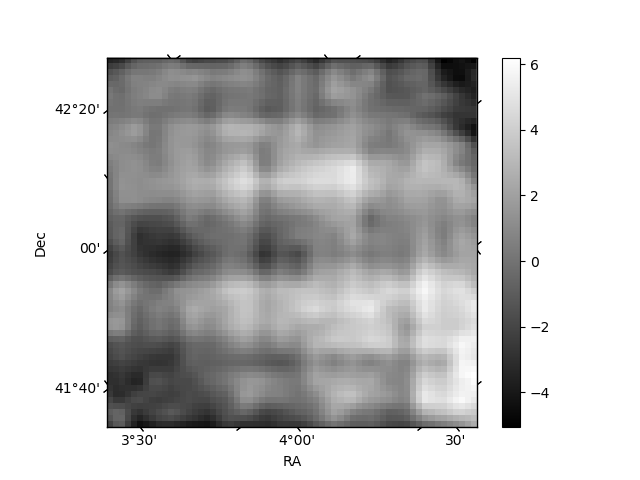
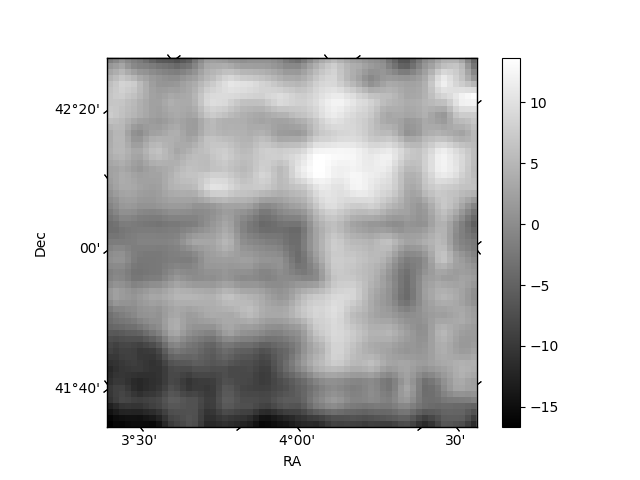
Histogram calculated using DETX and DETY for each event in the final _common_clean file
| Quadrant A | 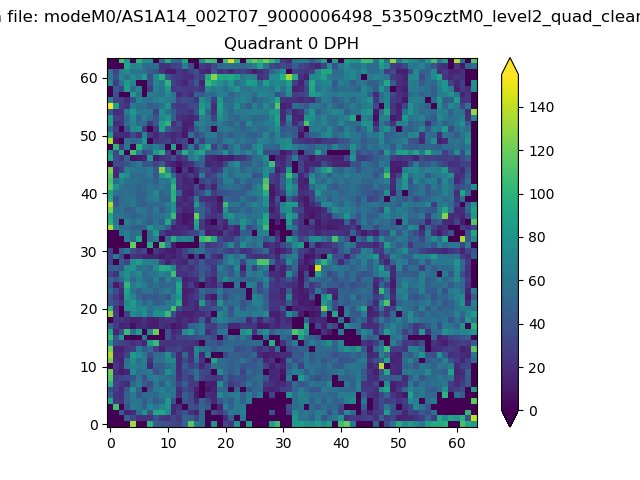 |
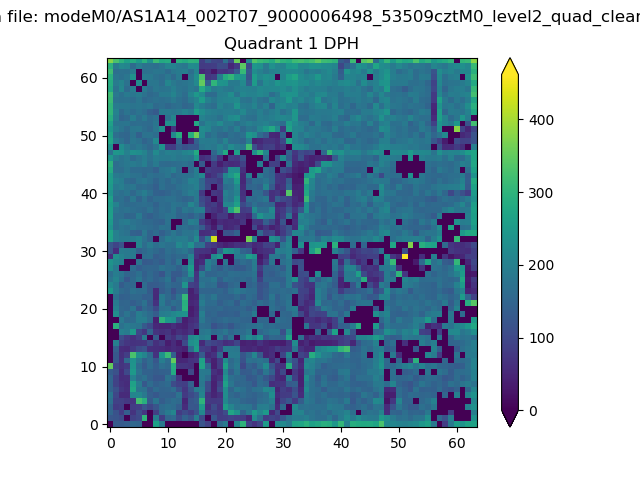 |
Quadrant B |
|---|---|---|---|
| Quadrant D | 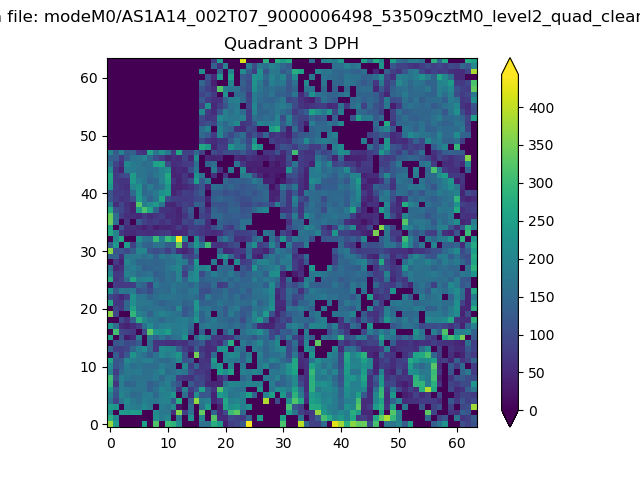 |
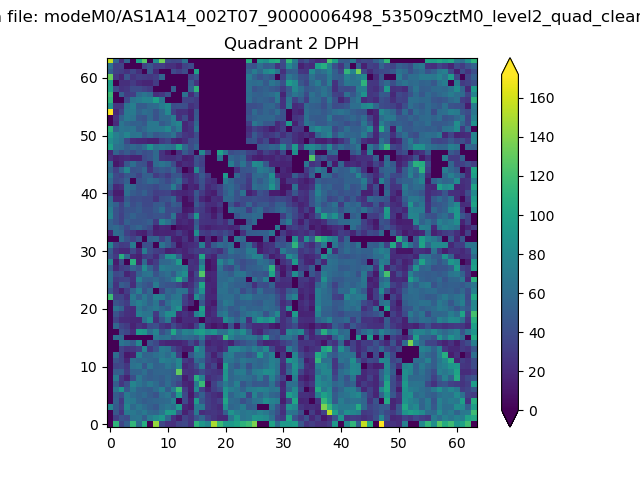 |
Quadrant C |
| Plot type | Count rate plots | Images |
|---|---|---|
| Comparison with Poisson distribution Blue bars denote a histogram of data divided into 1 sec bins. Red curve is a Poisson curve with rate = median count rate of data. |
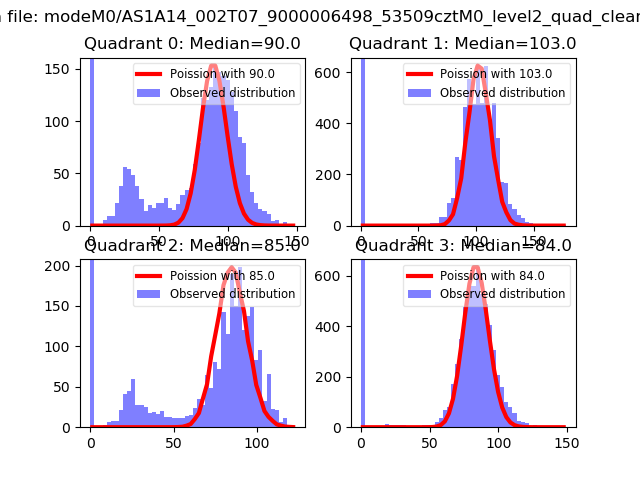 |
 |
| Quadrant-wise count rates Data is divided into 100 sec bins |
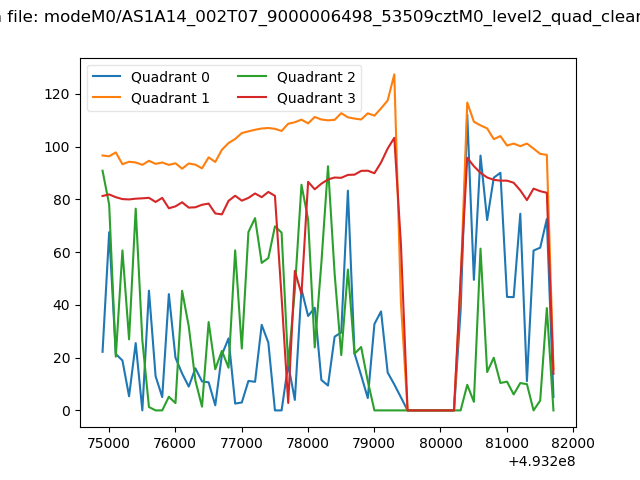 |
|
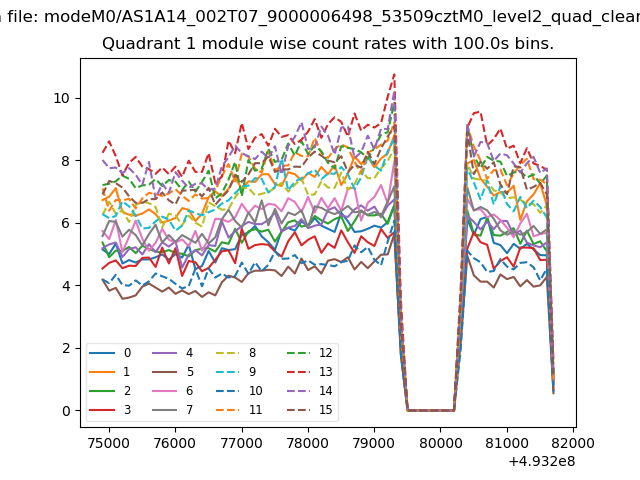
| Module-wise count rates for Quadrant A Data is divided into 100 sec bins |
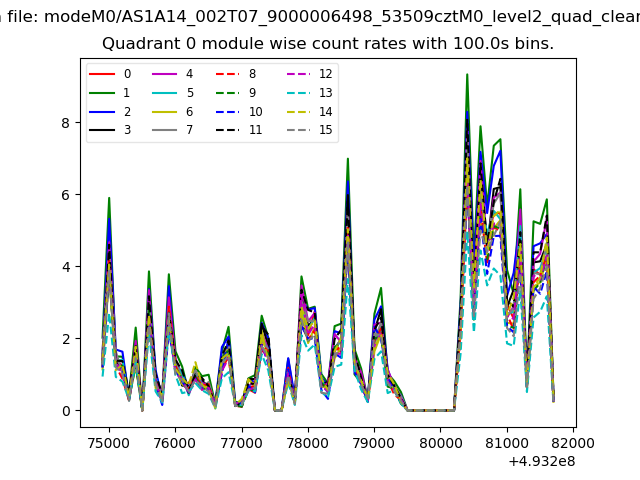 |
 |
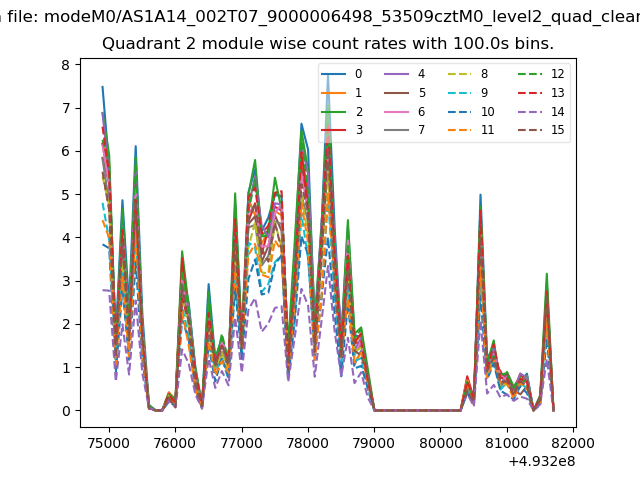
| Module-wise count rates for Quadrant B Data is divided into 100 sec bins |
 |
 |
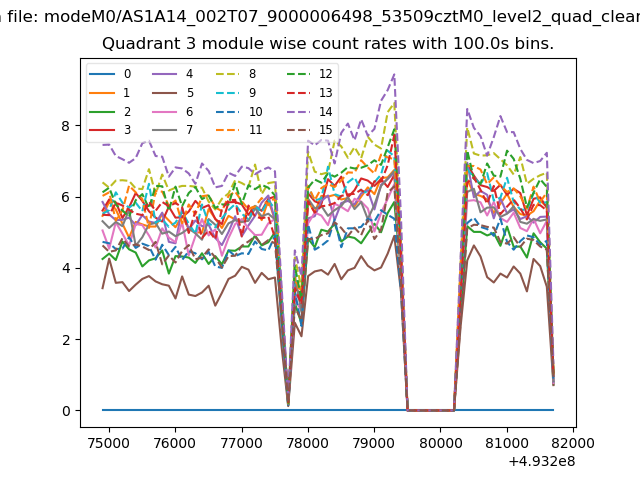
| Module-wise count rates for Quadrant C Data is divided into 100 sec bins |
 |
 |
| Module-wise count rates for Quadrant D Data is divided into 100 sec bins |
 |
 |
| Parameter | Plot |
|---|---|
| CZT HV Monitor | 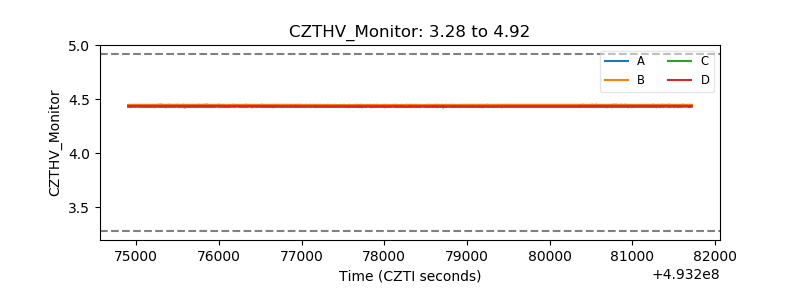 |
| D_VDD | 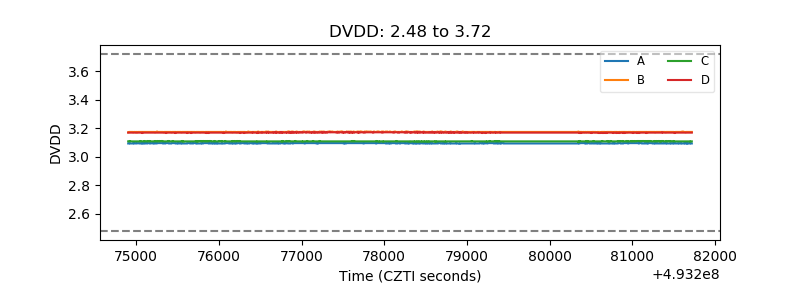 |
| Temperature 1 | 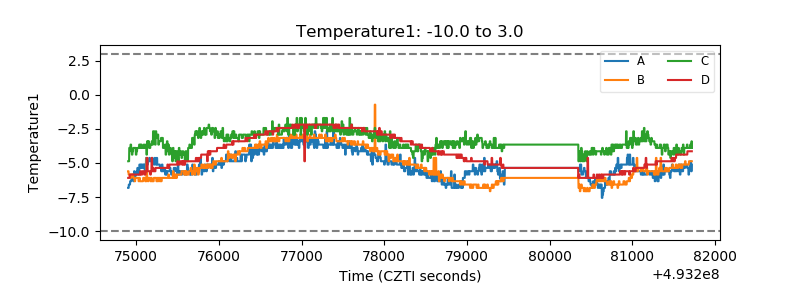 |
| Veto HV Monitor | 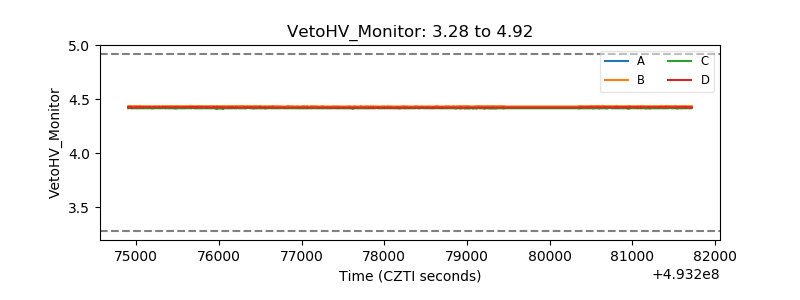 |
| Veto LLD | 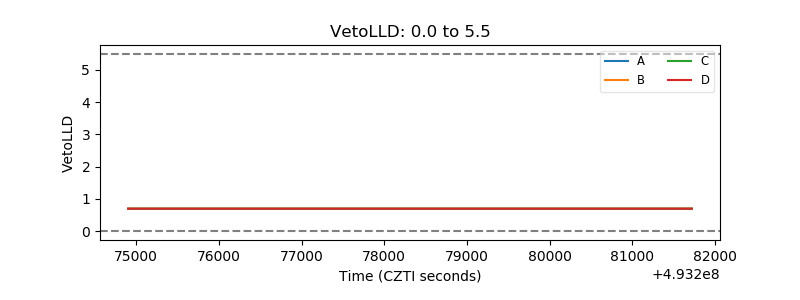 |
| Alpha Counter | 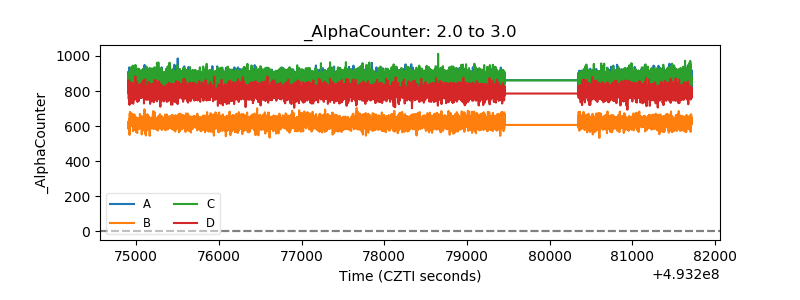 |
| _CPM_Rate | 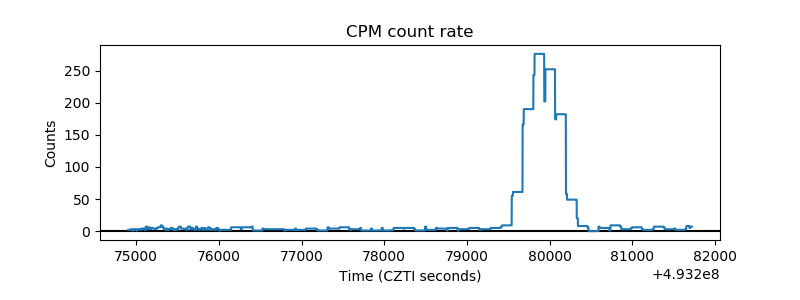 |
| CZT Counter | 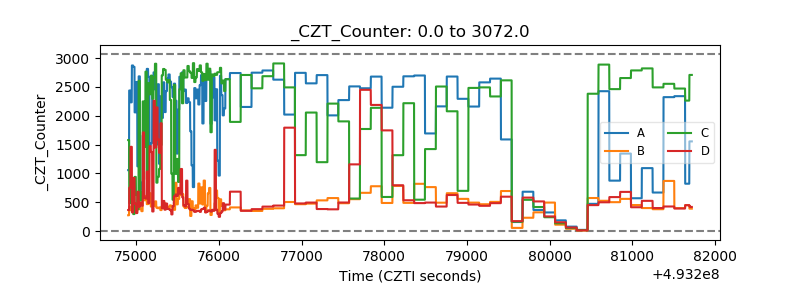 |
| +2.5 Volts monitor |  |
| +5 Volts monitor | 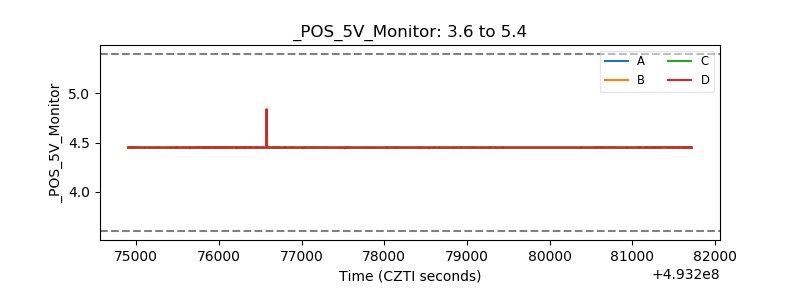 |
| _ROLL_ROT | 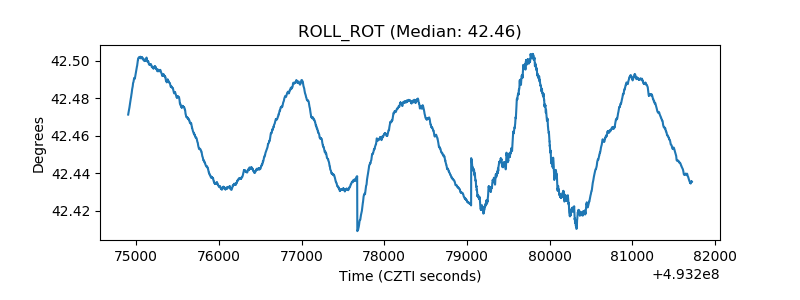 |
| _Roll_DEC | 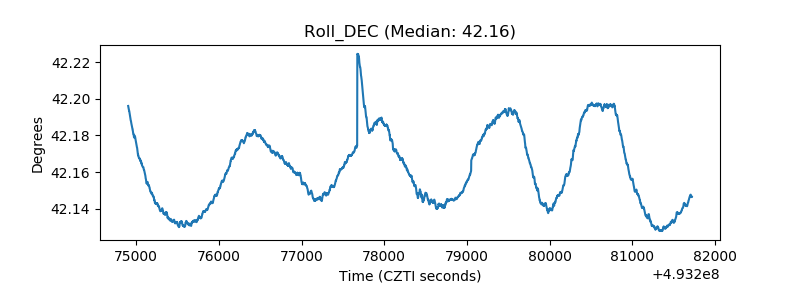 |
| _Roll_RA | 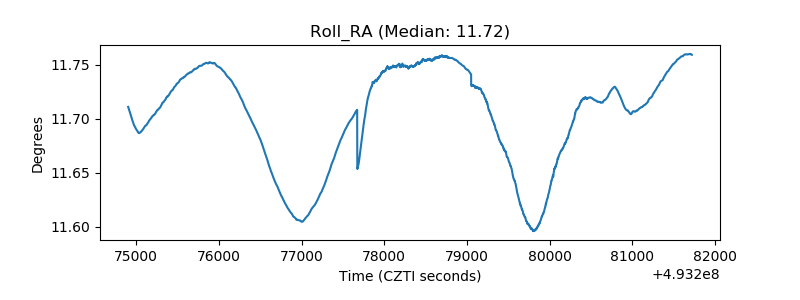 |
| Veto Counter | 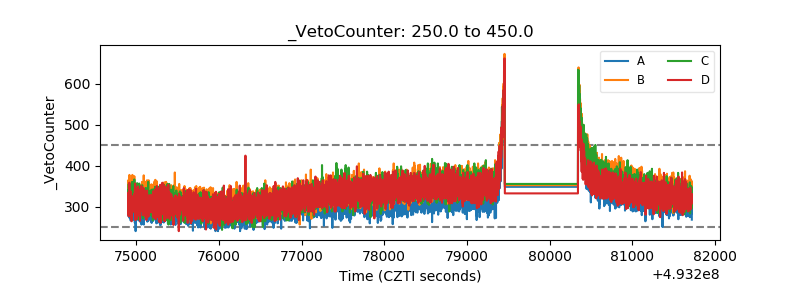 |