| Param | Original file | Final file |
|---|---|---|
| Filename | modeM0/AS1A14_002T07_9000006498_53511cztM0_level2.fits | modeM0/AS1A14_002T07_9000006498_53511cztM0_level2_quad_clean.evt |
| Size (bytes) | 756,233,280 | 78,220,800 |
| Size | 721.2 MB | 74.6 MB |
| Events in quadrant A | 10,685,513 | 379,996 |
| Events in quadrant B | 3,343,482 | 650,204 |
| Events in quadrant C | 10,111,213 | 375,561 |
| Events in quadrant D | 3,374,439 | 530,668 |
| Mode SS | |||
|---|---|---|---|
| Quadrant | BADHDUFLAG | Total packets | Discarded packets |
| A | 0 | 126 | 0 |
| B | 0 | 126 | 0 |
| C | 0 | 126 | 0 |
| D | 0 | 126 | 0 |
| Mode M9 | |||
|---|---|---|---|
| Quadrant | BADHDUFLAG | Total packets | Discarded packets |
| A | 0 | 10 | 0 |
| B | 0 | 10 | 0 |
| C | 0 | 10 | 0 |
| D | 0 | 10 | 0 |
| Mode M0 | |||
|---|---|---|---|
| Quadrant | BADHDUFLAG | Total packets | Discarded packets |
| A | 0 | 36034 | 1 |
| B | 0 | 14157 | 2 |
| C | 0 | 34364 | 1 |
| D | 0 | 14414 | 1 |
| Quadrant | Total seconds | Saturated seconds | Saturation percentage |
|---|---|---|---|
| A | 6184 | 2740 | 44.307891% |
| B | 6183 | 92 | 1.487951% |
| C | 6183 | 2460 | 39.786511% |
| D | 6183 | 124 | 2.005499% |
Noise dominated data is calculated using 1-second bins in cleaned event files. If a bin has >2000 counts, and if more than 50% of those come from <1% of pixels, then it is considered to be noise-dominated and hence unusable.
| Quadrant | # 1 sec bins | Bins with >0 counts | Bins with >2000 counts | High rate bins dominated by noise | Noise dominated (total time) | Noise dominated (detector-on time) | Marked lightcurve |
|---|---|---|---|---|---|---|---|
| A | 7199 | 6185 | 2277 | 2277 | 31.63% | 36.81% | 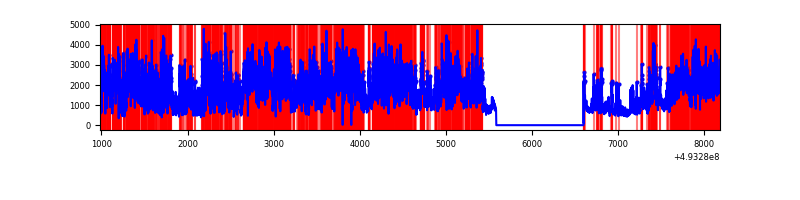 |
| B | 7198 | 6184 | 25 | 25 | 0.35% | 0.40% | 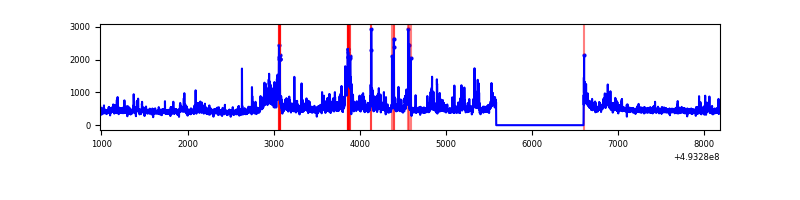 |
| C | 7197 | 6183 | 2108 | 2108 | 29.29% | 34.09% | 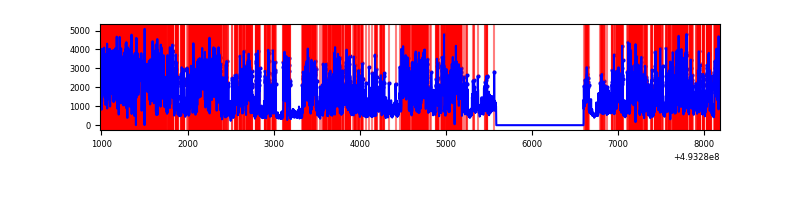 |
| D | 7198 | 6184 | 90 | 90 | 1.25% | 1.46% | 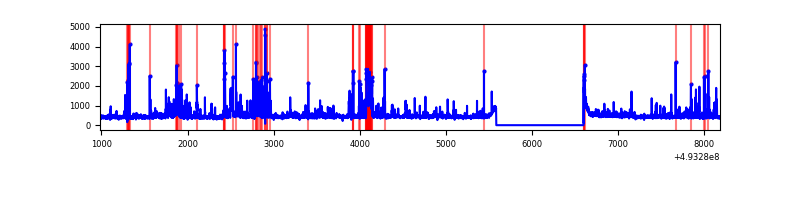 |
Top three noisy pixels from each quadrant. If the there are fewer than three noisy pixels in the level2.evt file, extra rows are filled as -1
| Pixel properties | Quadrant properties | ||||||
|---|---|---|---|---|---|---|---|
| Quadrant | DetID | PixID | Counts | Sigma | Mean | Median | Sigma |
| A | 3 | 62 | 5808054 | 42010.01 | 560 | 546 | 138.2 |
| A | 3 | 63 | 2087745 | 15098.26 | 560 | 546 | 138.2 |
| A | 15 | 174 | 545249 | 3940.24 | 560 | 546 | 138.2 |
| B | 10 | 254 | 202861 | 1408.81 | 668 | 643 | 143.5 |
| B | 7 | 252 | 120145 | 832.55 | 668 | 643 | 143.5 |
| B | 10 | 28 | 75247 | 519.75 | 668 | 643 | 143.5 |
| C | 7 | 64 | 6179397 | 42159.81 | 531 | 526 | 146.6 |
| C | 12 | 254 | 517047 | 3524.34 | 531 | 526 | 146.6 |
| C | 15 | 224 | 371146 | 2528.82 | 531 | 526 | 146.6 |
| D | 2 | 16 | 158530 | 853.38 | 648 | 618 | 185.0 |
| D | 1 | 0 | 149873 | 806.6 | 648 | 618 | 185.0 |
| D | 2 | 153 | 147161 | 791.94 | 648 | 618 | 185.0 |
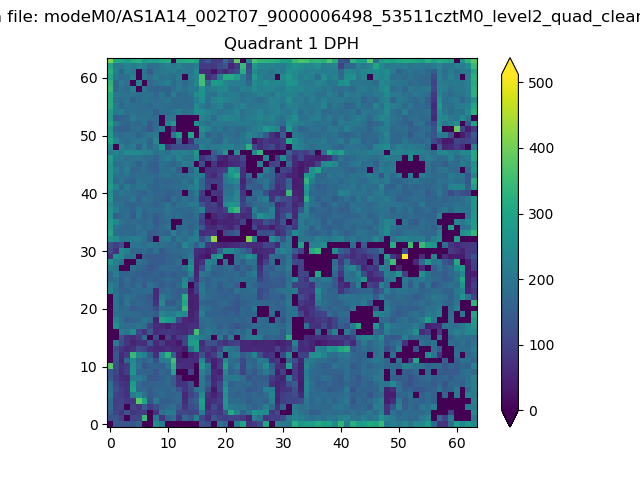
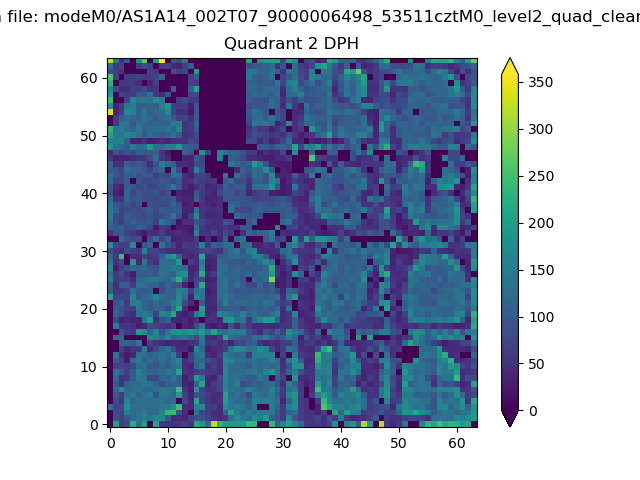
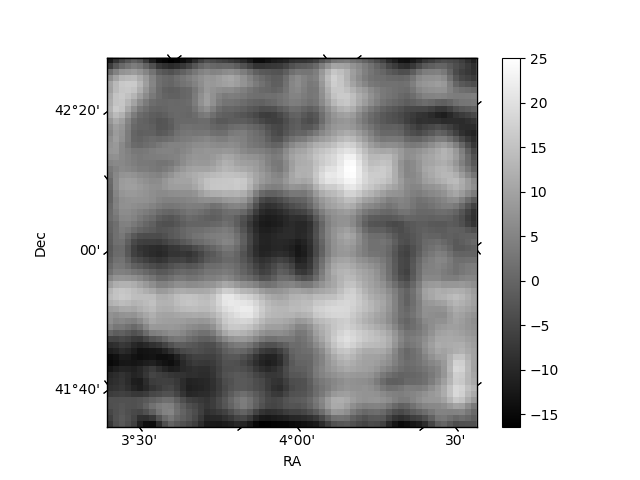
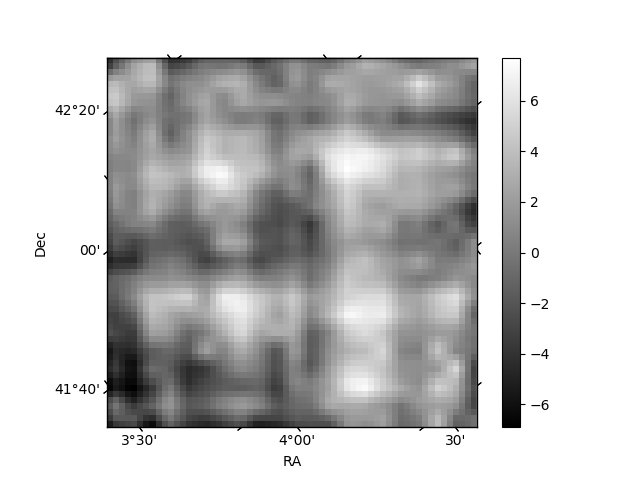
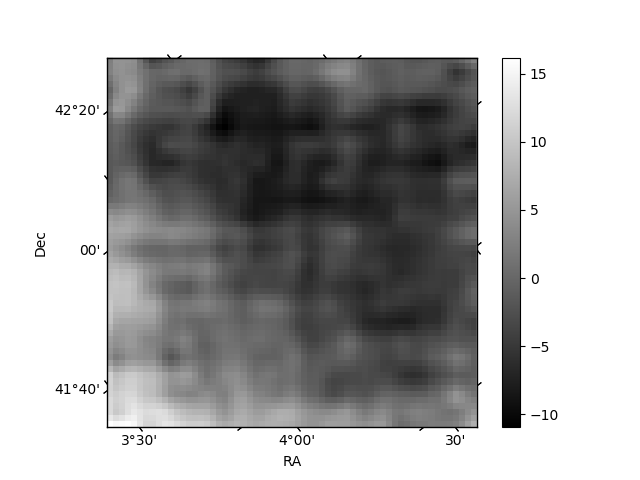
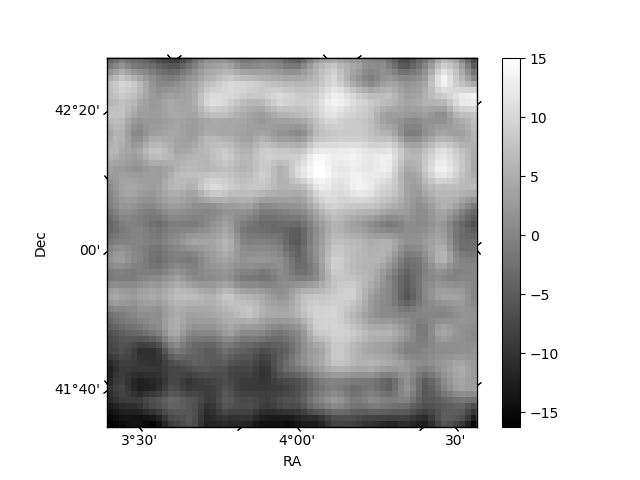
Histogram calculated using DETX and DETY for each event in the final _common_clean file
| Quadrant A |  |
 |
Quadrant B |
|---|---|---|---|
| Quadrant D | 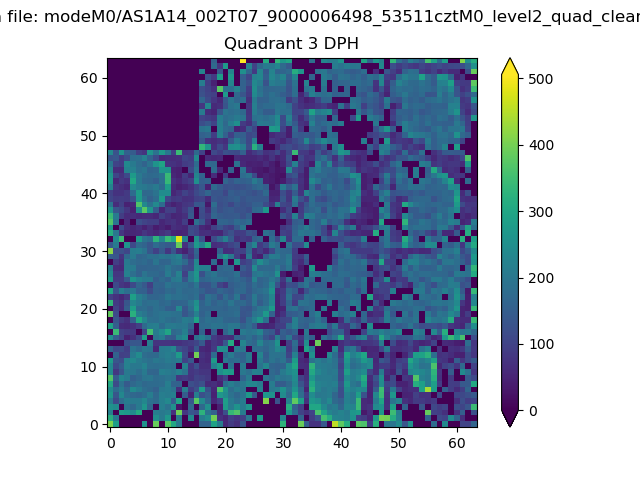 |
 |
Quadrant C |
| Plot type | Count rate plots | Images |
|---|---|---|
| Comparison with Poisson distribution Blue bars denote a histogram of data divided into 1 sec bins. Red curve is a Poisson curve with rate = median count rate of data. |
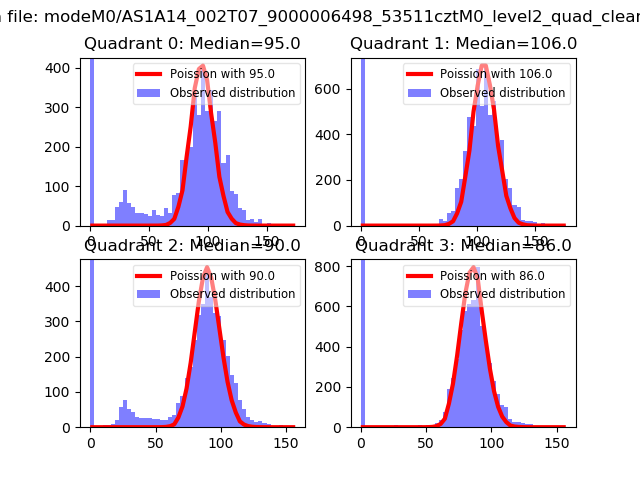 |
 |
| Quadrant-wise count rates Data is divided into 100 sec bins |
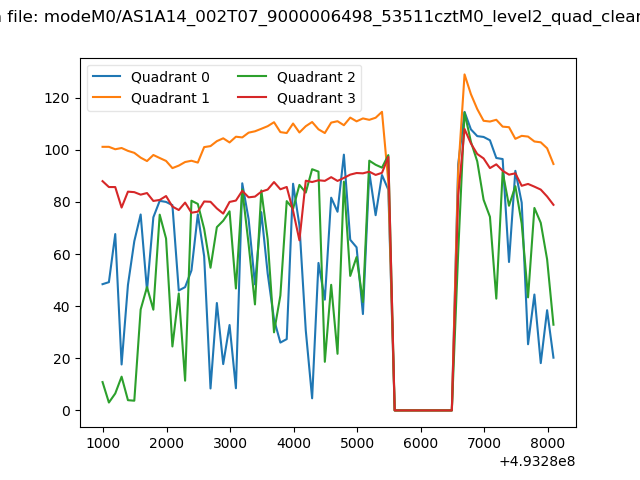 |
|
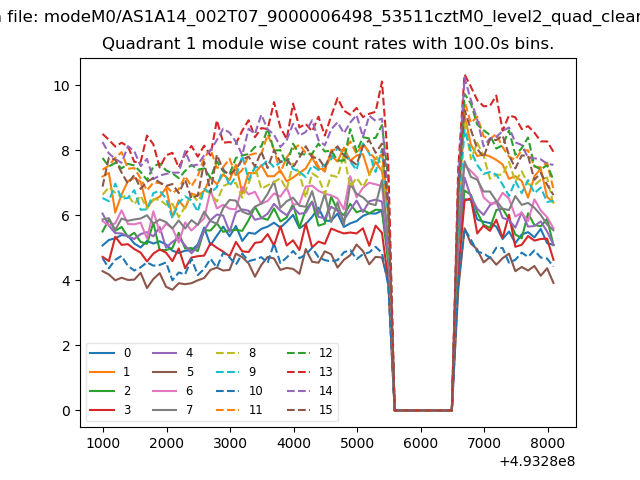
| Module-wise count rates for Quadrant A Data is divided into 100 sec bins |
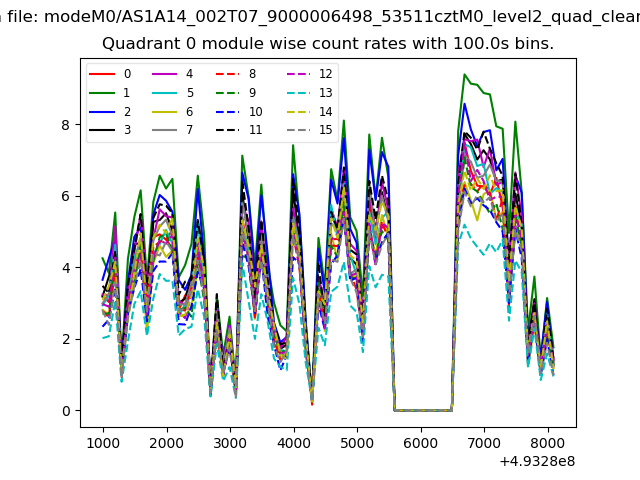 |
 |
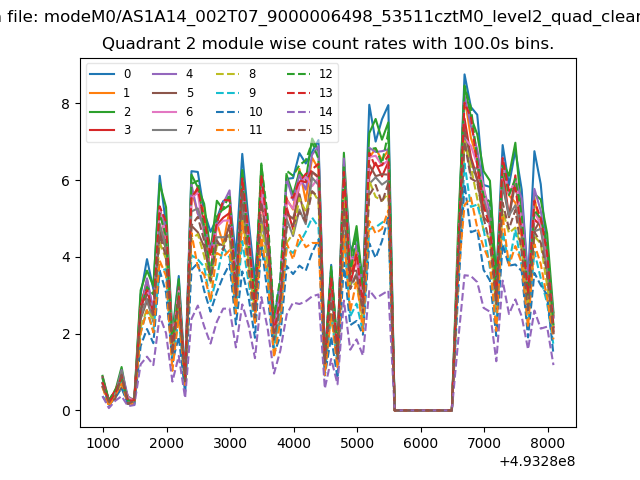
| Module-wise count rates for Quadrant B Data is divided into 100 sec bins |
 |
 |
| Module-wise count rates for Quadrant C Data is divided into 100 sec bins |
 |
 |
| Module-wise count rates for Quadrant D Data is divided into 100 sec bins |
 |
 |
| Parameter | Plot |
|---|---|
| CZT HV Monitor |  |
| D_VDD | 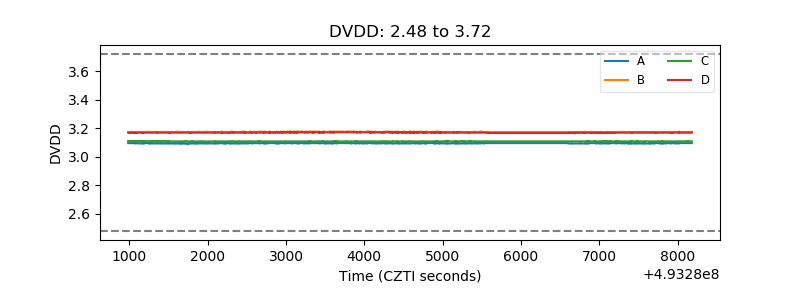 |
| Temperature 1 | 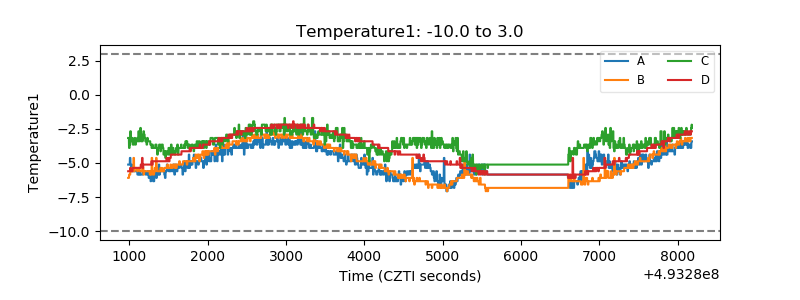 |
| Veto HV Monitor | 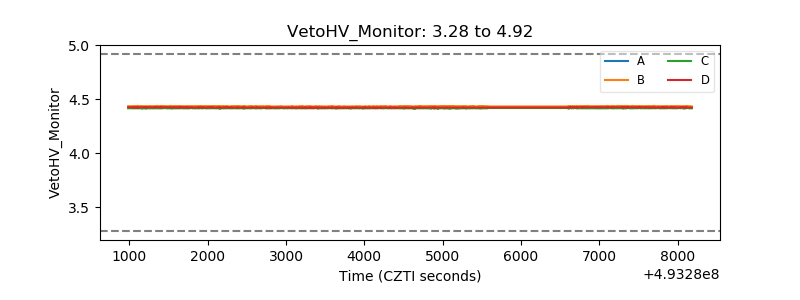 |
| Veto LLD | 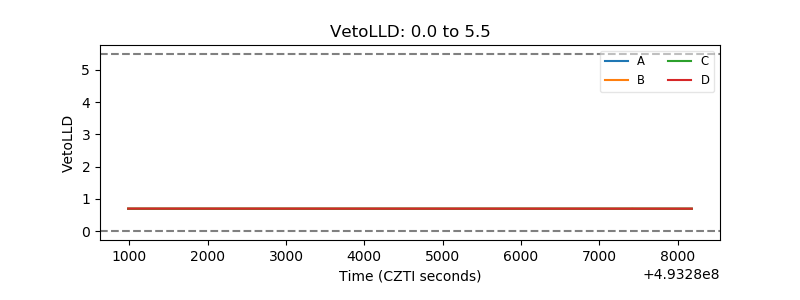 |
| Alpha Counter | 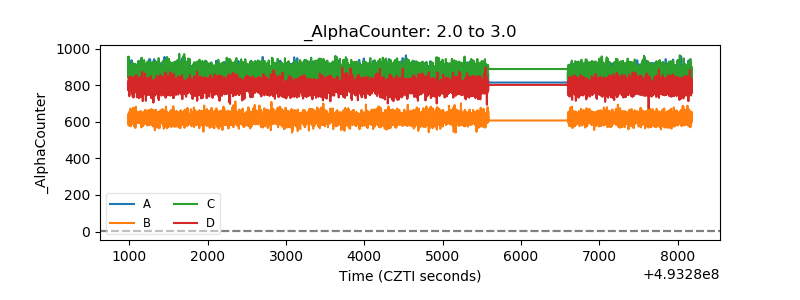 |
| _CPM_Rate | 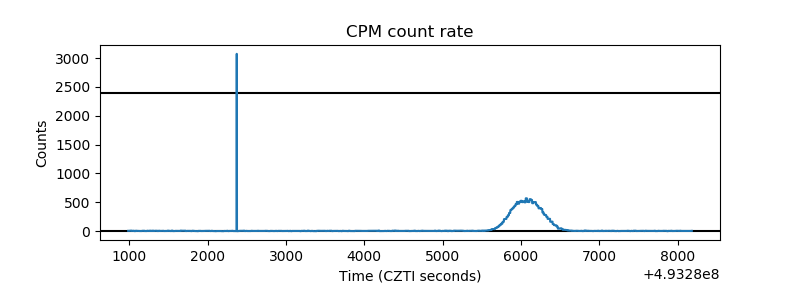 |
| CZT Counter | 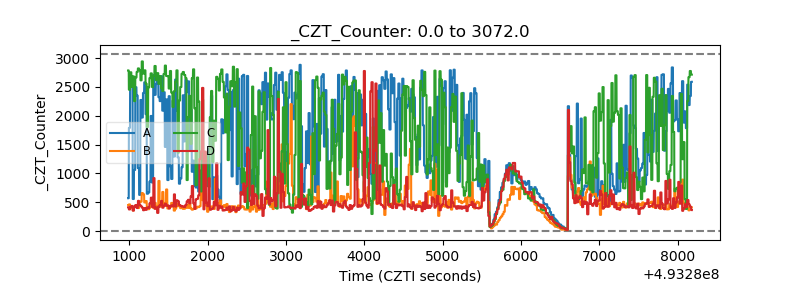 |
| +2.5 Volts monitor | 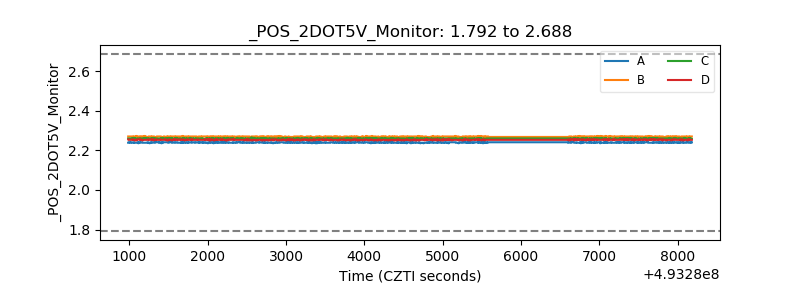 |
| +5 Volts monitor |  |
| _ROLL_ROT | 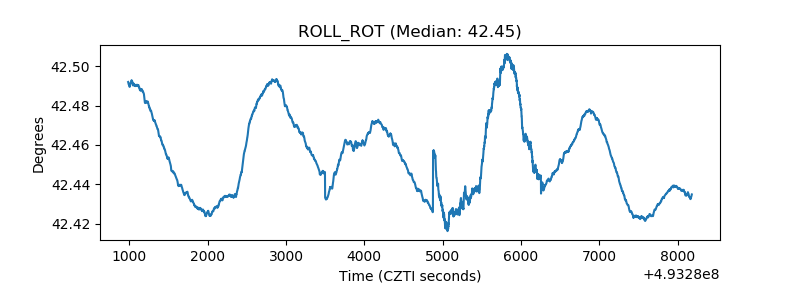 |
| _Roll_DEC | 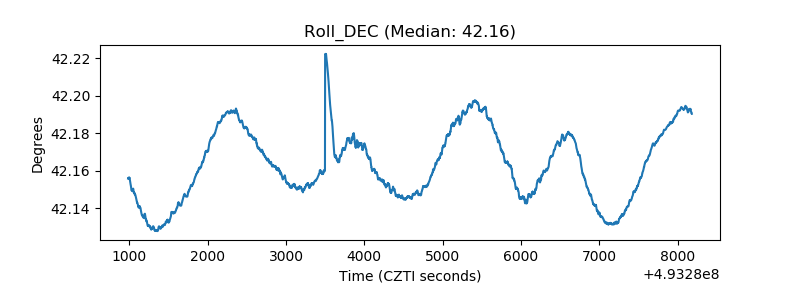 |
| _Roll_RA | 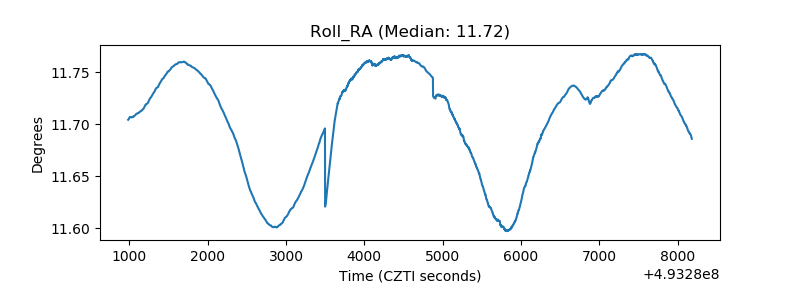 |
| Veto Counter | 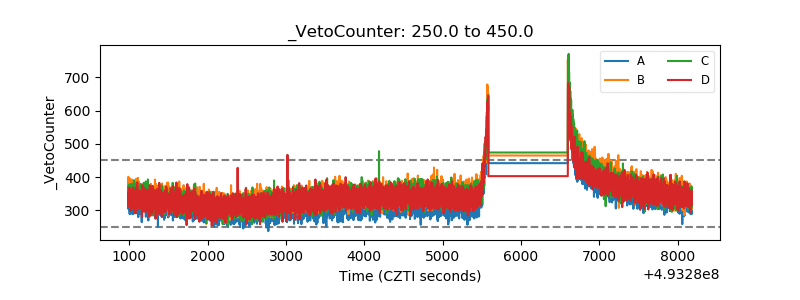 |