| Param | Original file | Final file |
|---|---|---|
| Filename | modeM0/AS1A14_002T07_9000006498_53512cztM0_level2.fits | modeM0/AS1A14_002T07_9000006498_53512cztM0_level2_quad_clean.evt |
| Size (bytes) | 828,619,200 | 85,536,000 |
| Size | 790.2 MB | 81.6 MB |
| Events in quadrant A | 11,320,101 | 426,304 |
| Events in quadrant B | 3,505,988 | 728,241 |
| Events in quadrant C | 11,386,492 | 381,670 |
| Events in quadrant D | 3,945,025 | 589,249 |
| Mode SS | |||
|---|---|---|---|
| Quadrant | BADHDUFLAG | Total packets | Discarded packets |
| A | 0 | 136 | 0 |
| B | 0 | 136 | 0 |
| C | 0 | 136 | 0 |
| D | 0 | 136 | 0 |
| Mode M9 | |||
|---|---|---|---|
| Quadrant | BADHDUFLAG | Total packets | Discarded packets |
| A | 0 | 11 | 0 |
| B | 0 | 11 | 0 |
| C | 0 | 11 | 0 |
| D | 0 | 11 | 0 |
| Mode M0 | |||
|---|---|---|---|
| Quadrant | BADHDUFLAG | Total packets | Discarded packets |
| A | 0 | 38257 | 4 |
| B | 0 | 14827 | 1 |
| C | 0 | 38500 | 1 |
| D | 0 | 16306 | 1 |
| Quadrant | Total seconds | Saturated seconds | Saturation percentage |
|---|---|---|---|
| A | 6656 | 2930 | 44.020433% |
| B | 6657 | 140 | 2.103049% |
| C | 6657 | 3050 | 45.816434% |
| D | 6657 | 220 | 3.304792% |
Noise dominated data is calculated using 1-second bins in cleaned event files. If a bin has >2000 counts, and if more than 50% of those come from <1% of pixels, then it is considered to be noise-dominated and hence unusable.
| Quadrant | # 1 sec bins | Bins with >0 counts | Bins with >2000 counts | High rate bins dominated by noise | Noise dominated (total time) | Noise dominated (detector-on time) | Marked lightcurve |
|---|---|---|---|---|---|---|---|
| A | 7726 | 6656 | 2452 | 2452 | 31.74% | 36.84% | 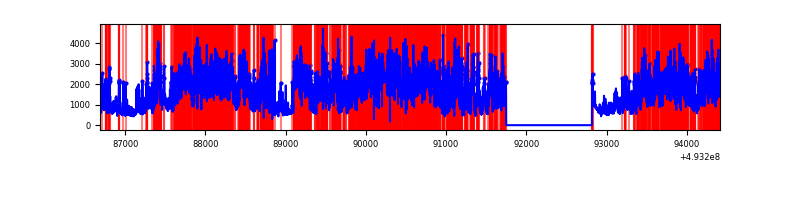 |
| B | 7727 | 6658 | 14 | 14 | 0.18% | 0.21% | 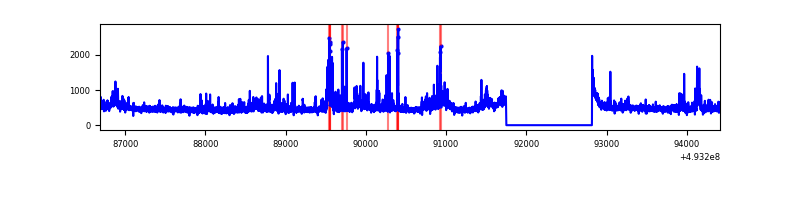 |
| C | 7727 | 6658 | 2580 | 2580 | 33.39% | 38.75% | 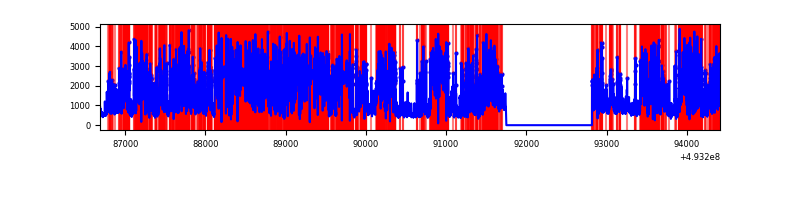 |
| D | 7727 | 6658 | 149 | 149 | 1.93% | 2.24% | 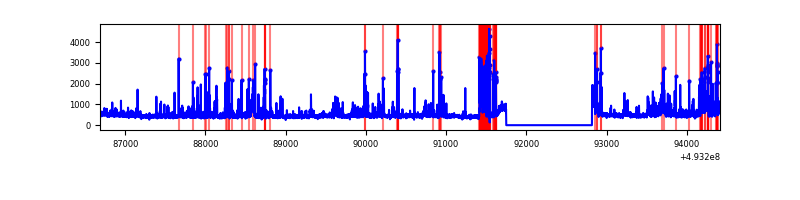 |
Top three noisy pixels from each quadrant. If the there are fewer than three noisy pixels in the level2.evt file, extra rows are filled as -1
| Pixel properties | Quadrant properties | ||||||
|---|---|---|---|---|---|---|---|
| Quadrant | DetID | PixID | Counts | Sigma | Mean | Median | Sigma |
| A | 3 | 63 | 4335820 | 28090.0 | 629 | 616 | 154.3 |
| A | 3 | 62 | 3467841 | 22465.92 | 629 | 616 | 154.3 |
| A | 15 | 174 | 974208 | 6308.4 | 629 | 616 | 154.3 |
| B | 5 | 185 | 131640 | 815.75 | 745 | 719 | 160.5 |
| B | 2 | 249 | 98364 | 608.41 | 745 | 719 | 160.5 |
| B | 4 | 171 | 81548 | 503.63 | 745 | 719 | 160.5 |
| C | 7 | 64 | 5257698 | 34526.85 | 556 | 552 | 152.3 |
| C | 12 | 254 | 1718843 | 11285.05 | 556 | 552 | 152.3 |
| C | 1 | 241 | 1680885 | 11035.76 | 556 | 552 | 152.3 |
| D | 2 | 153 | 495913 | 2439.68 | 723 | 693 | 203.0 |
| D | 3 | 12 | 258448 | 1269.82 | 723 | 693 | 203.0 |
| D | 1 | 0 | 56538 | 275.12 | 723 | 693 | 203.0 |
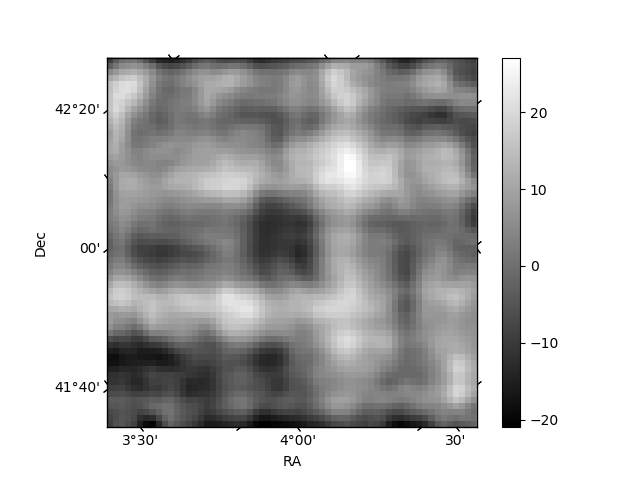
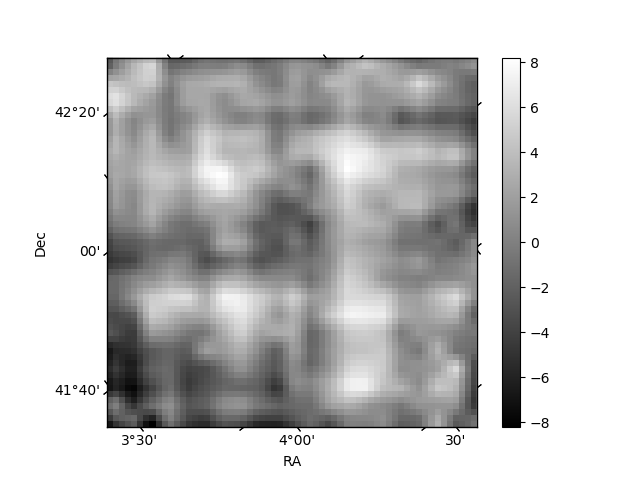
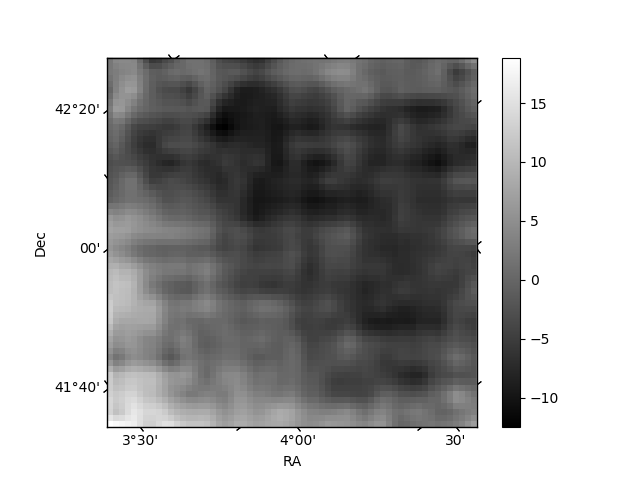
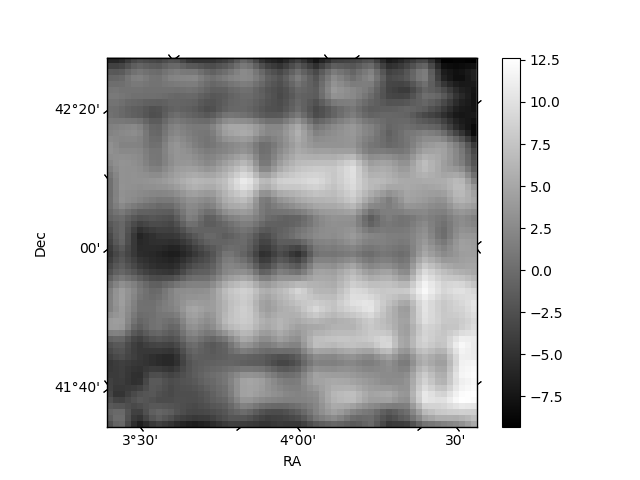
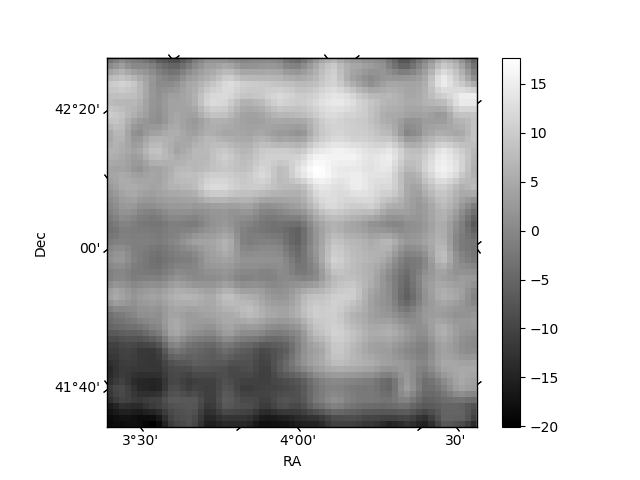
Histogram calculated using DETX and DETY for each event in the final _common_clean file
| Quadrant A | 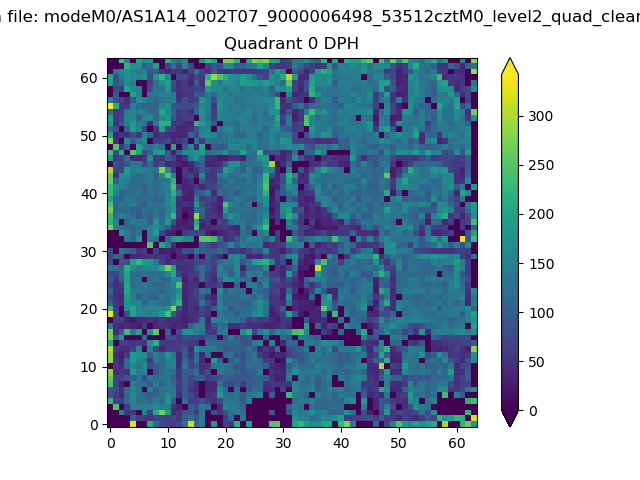 |
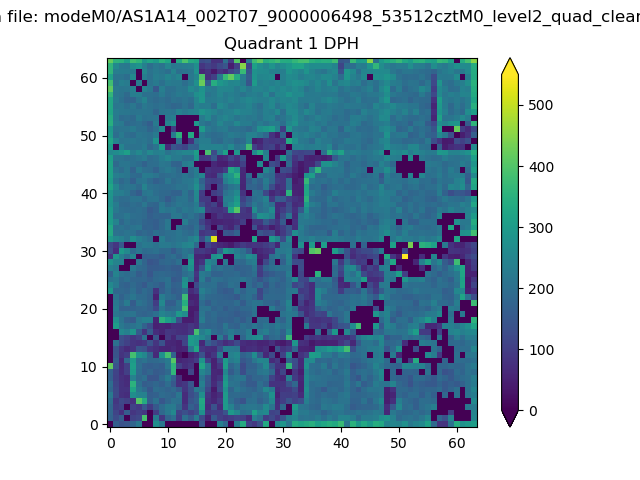 |
Quadrant B |
|---|---|---|---|
| Quadrant D | 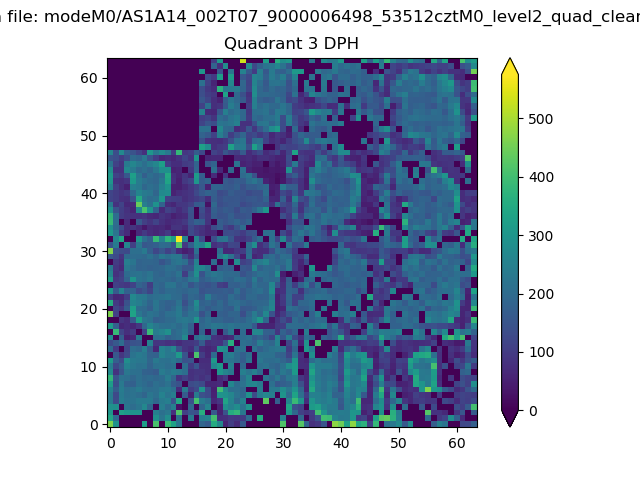 |
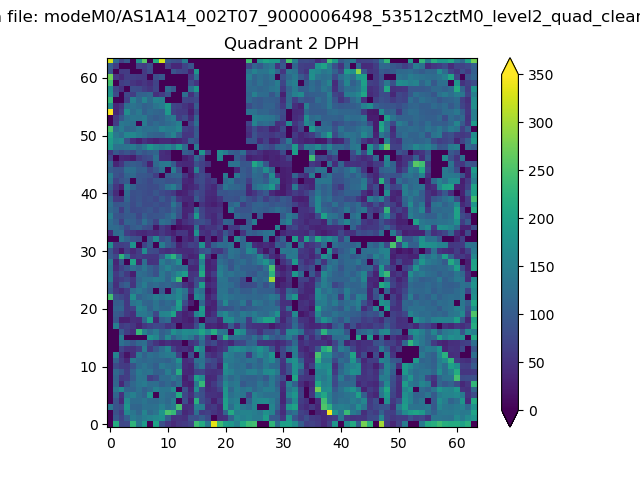 |
Quadrant C |
| Plot type | Count rate plots | Images |
|---|---|---|
| Comparison with Poisson distribution Blue bars denote a histogram of data divided into 1 sec bins. Red curve is a Poisson curve with rate = median count rate of data. |
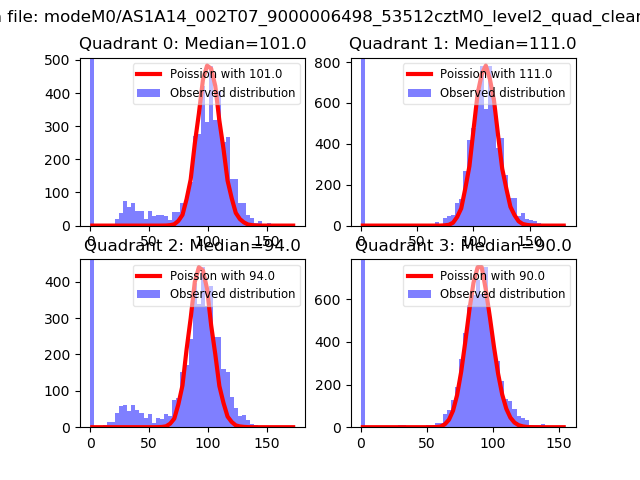 |
 |
| Quadrant-wise count rates Data is divided into 100 sec bins |
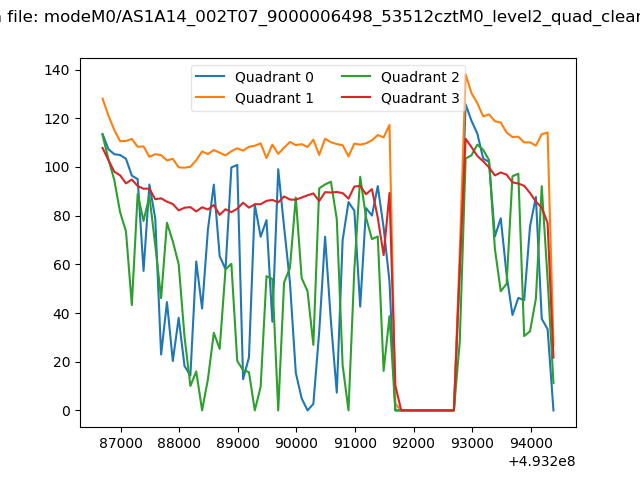 |
|
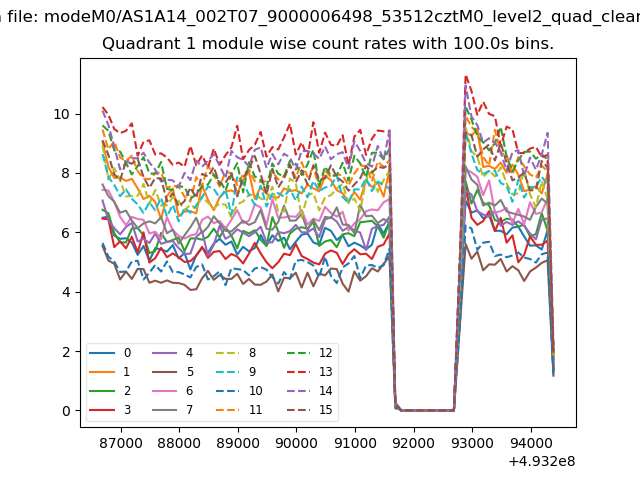
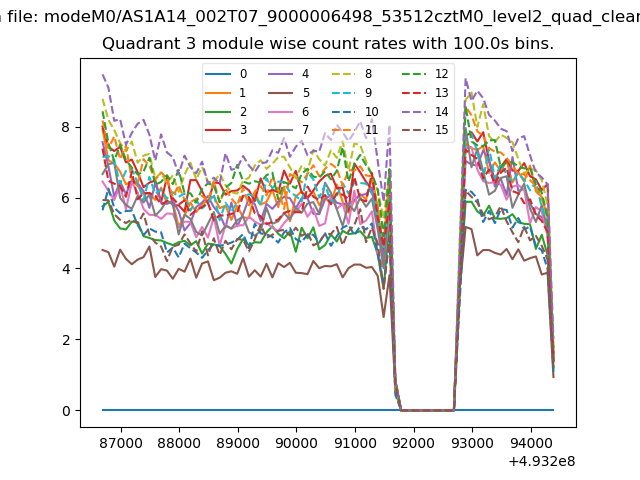
| Module-wise count rates for Quadrant A Data is divided into 100 sec bins |
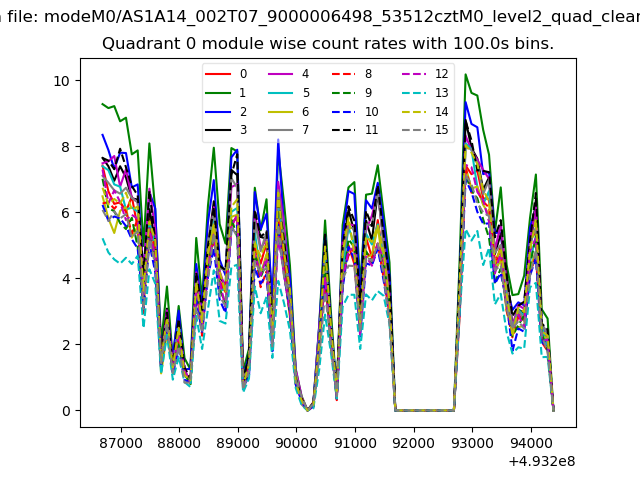 |
 |
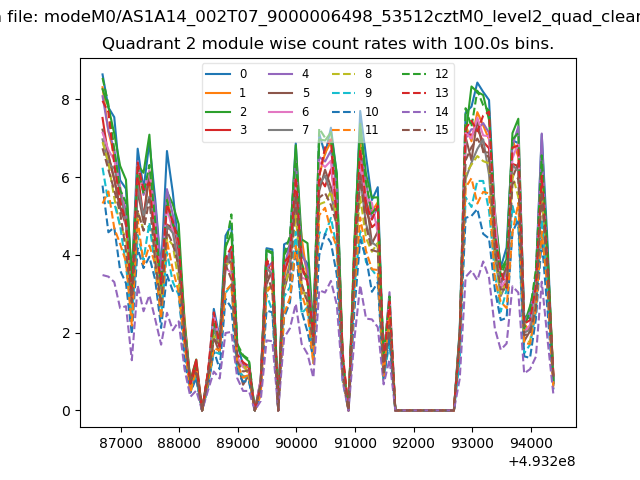
| Module-wise count rates for Quadrant B Data is divided into 100 sec bins |
 |
 |
| Module-wise count rates for Quadrant C Data is divided into 100 sec bins |
 |
 |
| Module-wise count rates for Quadrant D Data is divided into 100 sec bins |
 |
 |
| Parameter | Plot |
|---|---|
| CZT HV Monitor | 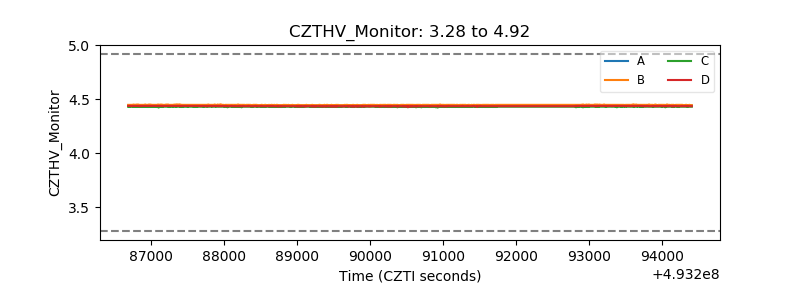 |
| D_VDD | 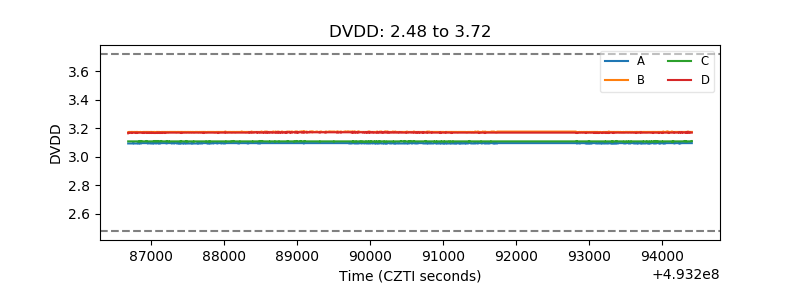 |
| Temperature 1 | 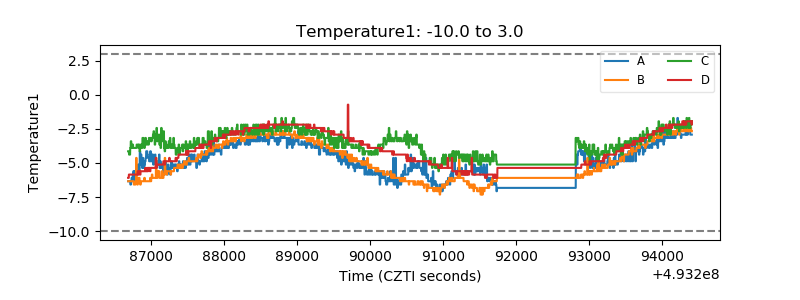 |
| Veto HV Monitor | 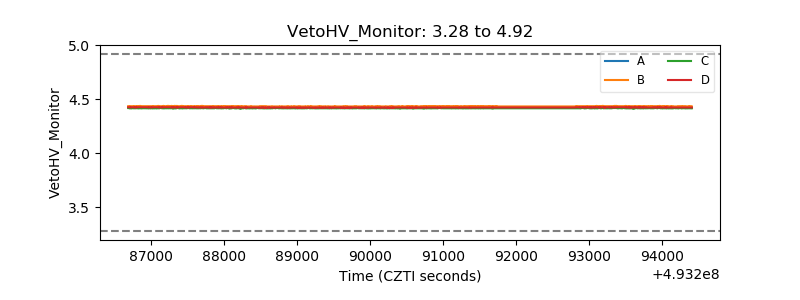 |
| Veto LLD | 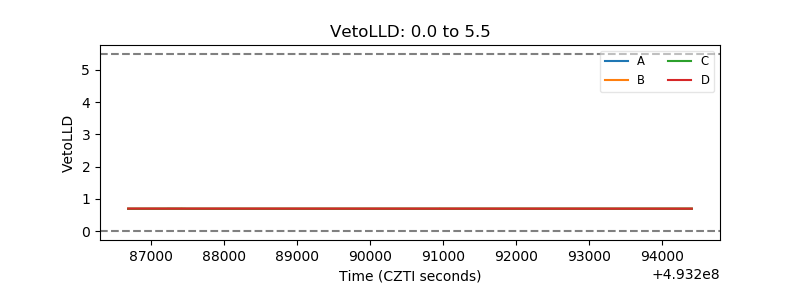 |
| Alpha Counter | 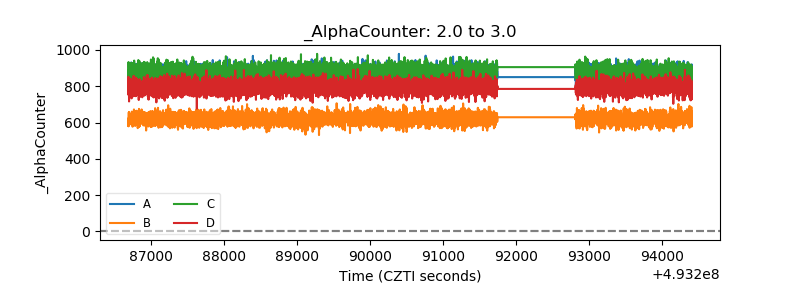 |
| _CPM_Rate | 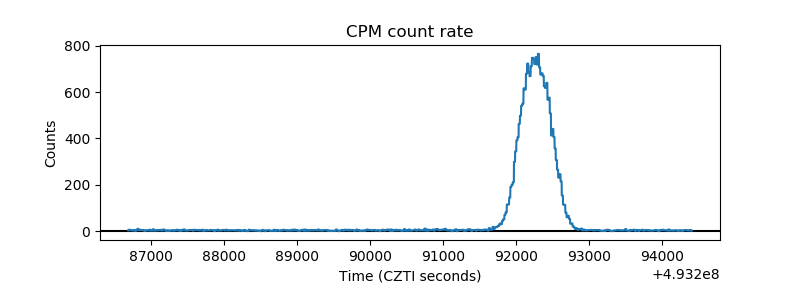 |
| CZT Counter | 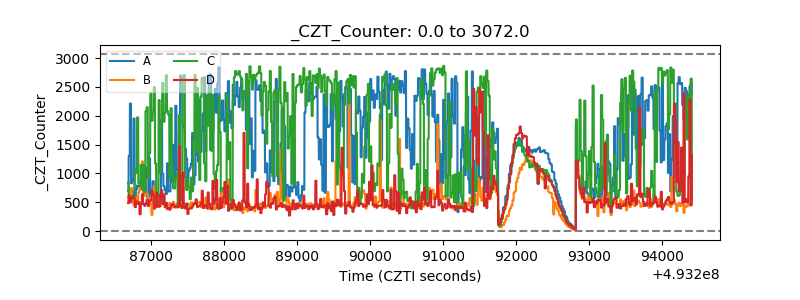 |
| +2.5 Volts monitor | 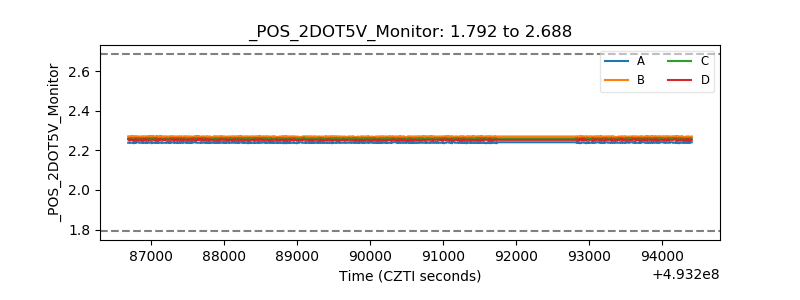 |
| +5 Volts monitor | 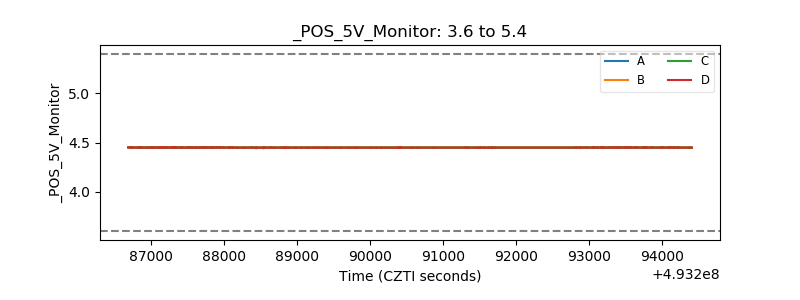 |
| _ROLL_ROT | 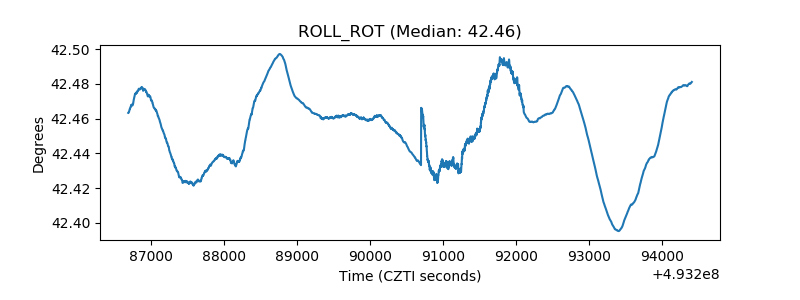 |
| _Roll_DEC | 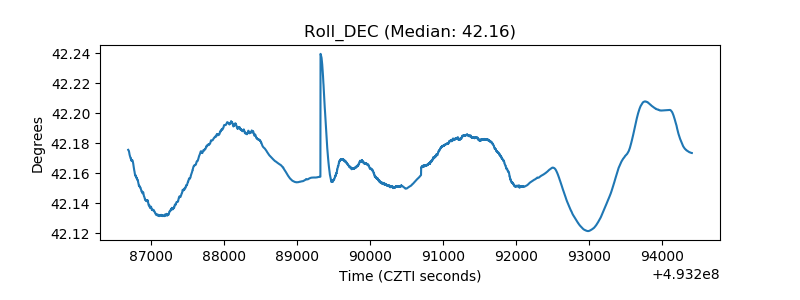 |
| _Roll_RA | 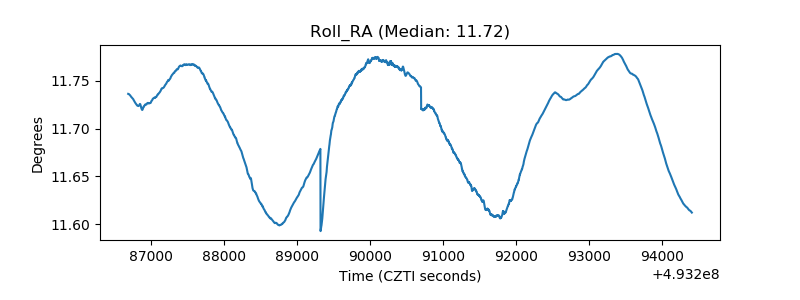 |
| Veto Counter | 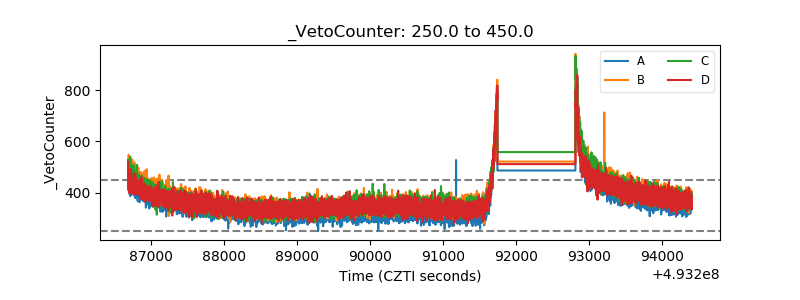 |