| Param | Original file | Final file |
|---|---|---|
| Filename | modeM0/AS1A14_002T07_9000006498_53513cztM0_level2.fits | modeM0/AS1A14_002T07_9000006498_53513cztM0_level2_quad_clean.evt |
| Size (bytes) | 326,750,400 | 38,427,840 |
| Size | 311.6 MB | 36.6 MB |
| Events in quadrant A | 4,613,335 | 207,215 |
| Events in quadrant B | 1,470,742 | 313,325 |
| Events in quadrant C | 4,091,637 | 194,930 |
| Events in quadrant D | 1,701,740 | 249,270 |
| Mode SS | |||
|---|---|---|---|
| Quadrant | BADHDUFLAG | Total packets | Discarded packets |
| A | 0 | 54 | 0 |
| B | 0 | 54 | 0 |
| C | 0 | 54 | 0 |
| D | 0 | 54 | 0 |
| Mode M0 | |||
|---|---|---|---|
| Quadrant | BADHDUFLAG | Total packets | Discarded packets |
| A | 0 | 15685 | 0 |
| B | 0 | 6187 | 0 |
| C | 0 | 14097 | 0 |
| D | 0 | 6913 | 0 |
| Quadrant | Total seconds | Saturated seconds | Saturation percentage |
|---|---|---|---|
| A | 2786 | 990 | 35.534817% |
| B | 2787 | 18 | 0.645856% |
| C | 2787 | 901 | 32.328669% |
| D | 2787 | 46 | 1.650520% |
Noise dominated data is calculated using 1-second bins in cleaned event files. If a bin has >2000 counts, and if more than 50% of those come from <1% of pixels, then it is considered to be noise-dominated and hence unusable.
| Quadrant | # 1 sec bins | Bins with >0 counts | Bins with >2000 counts | High rate bins dominated by noise | Noise dominated (total time) | Noise dominated (detector-on time) | Marked lightcurve |
|---|---|---|---|---|---|---|---|
| A | 2786 | 2786 | 850 | 850 | 30.51% | 30.51% | 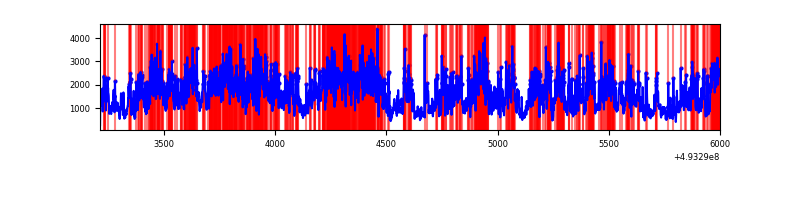 |
| B | 2787 | 2787 | 10 | 10 | 0.36% | 0.36% | 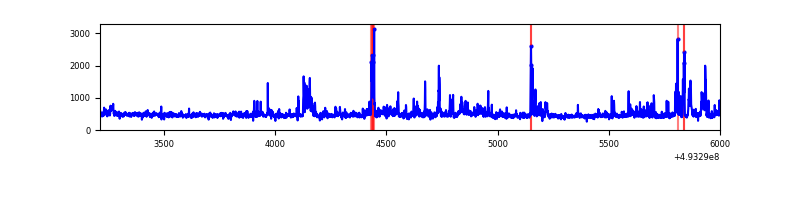 |
| C | 2787 | 2787 | 764 | 764 | 27.41% | 27.41% | 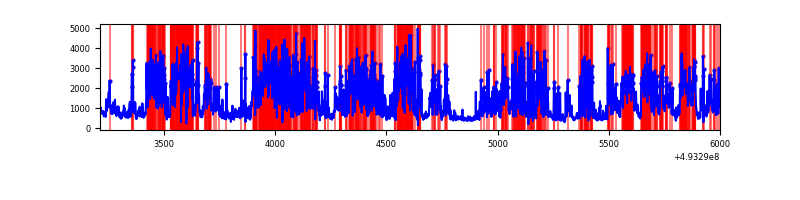 |
| D | 2787 | 2787 | 42 | 42 | 1.51% | 1.51% | 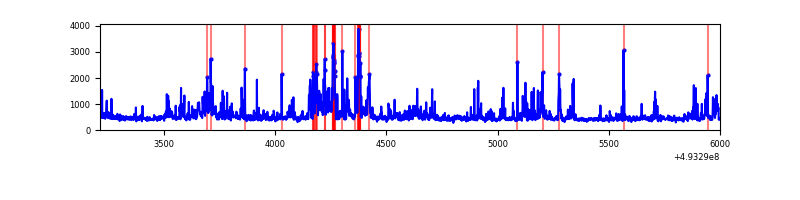 |
Top three noisy pixels from each quadrant. If the there are fewer than three noisy pixels in the level2.evt file, extra rows are filled as -1
| Pixel properties | Quadrant properties | ||||||
|---|---|---|---|---|---|---|---|
| Quadrant | DetID | PixID | Counts | Sigma | Mean | Median | Sigma |
| A | 3 | 62 | 2522002 | 36198.2 | 276 | 271 | 69.7 |
| A | 3 | 63 | 700015 | 10044.48 | 276 | 271 | 69.7 |
| A | 15 | 174 | 247112 | 3543.28 | 276 | 271 | 69.7 |
| B | 5 | 185 | 139982 | 2097.94 | 306 | 296 | 66.6 |
| B | 4 | 171 | 43177 | 644.03 | 306 | 296 | 66.6 |
| B | 10 | 28 | 25479 | 378.22 | 306 | 296 | 66.6 |
| C | 7 | 64 | 1285292 | 18192.92 | 255 | 253 | 70.6 |
| C | 12 | 254 | 1003253 | 14199.96 | 255 | 253 | 70.6 |
| C | 1 | 241 | 679897 | 9622.05 | 255 | 253 | 70.6 |
| D | 2 | 153 | 201935 | 2373.71 | 295 | 281 | 85.0 |
| D | 3 | 12 | 130804 | 1536.42 | 295 | 281 | 85.0 |
| D | 2 | 16 | 36605 | 427.58 | 295 | 281 | 85.0 |
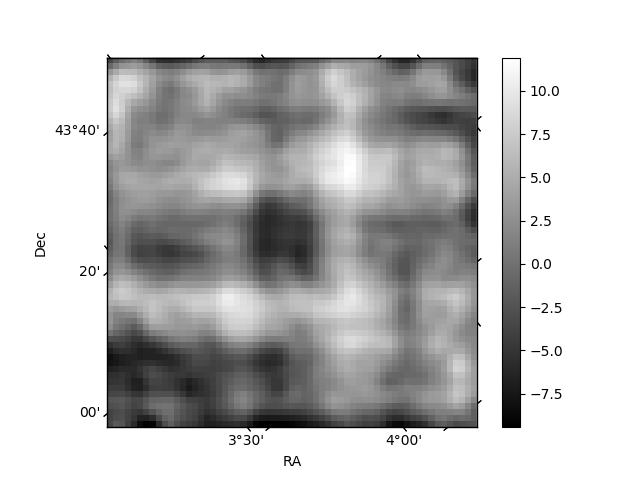
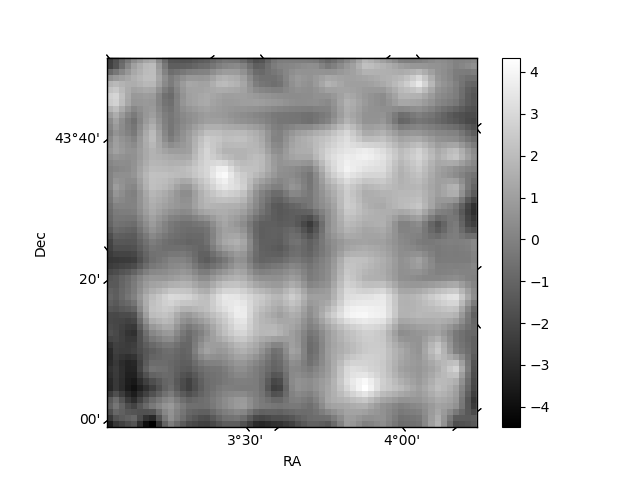
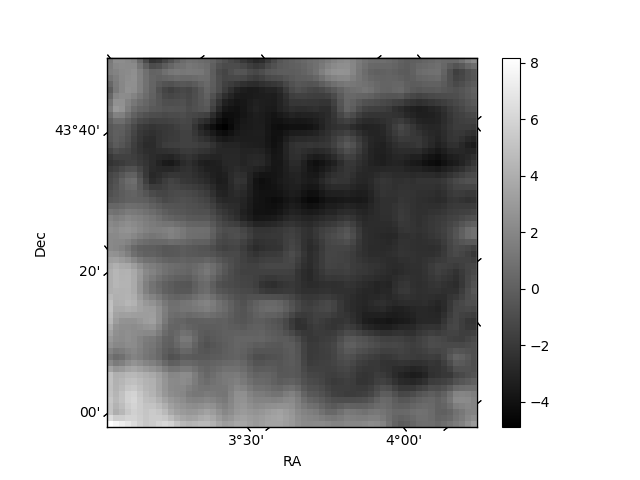
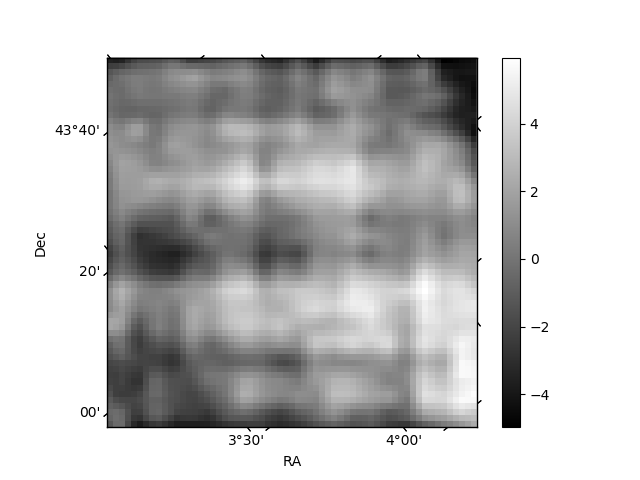
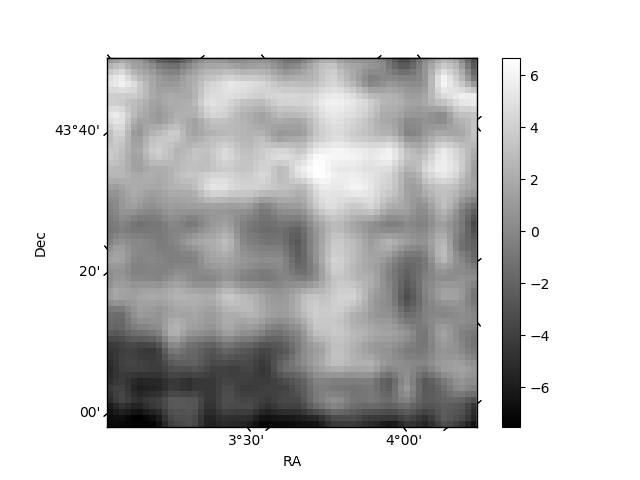
Histogram calculated using DETX and DETY for each event in the final _common_clean file
| Quadrant A | 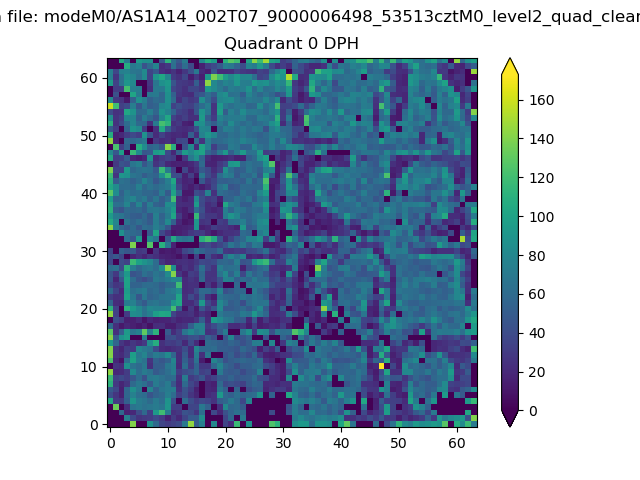 |
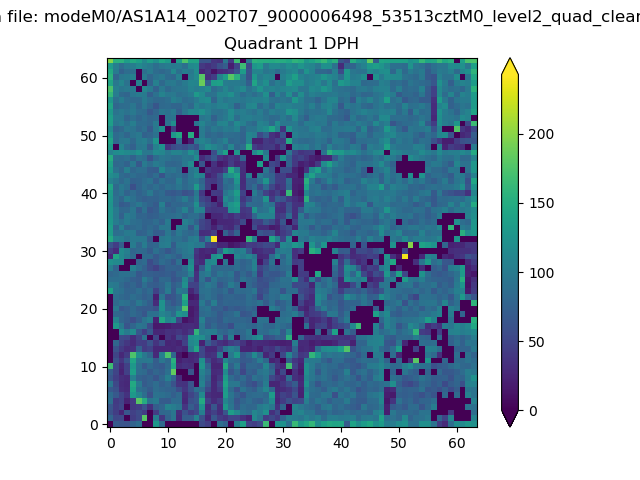 |
Quadrant B |
|---|---|---|---|
| Quadrant D | 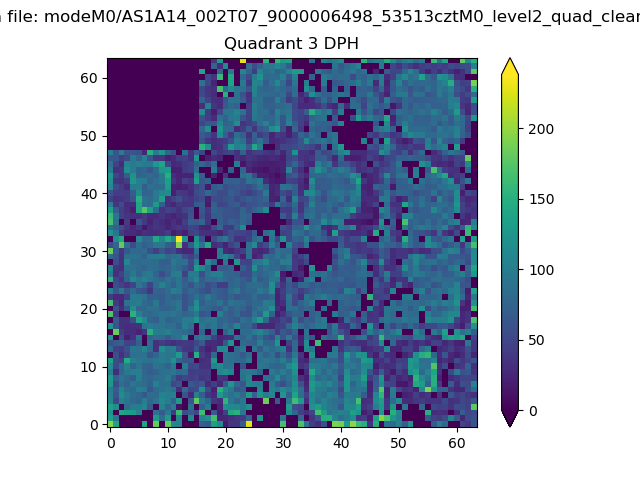 |
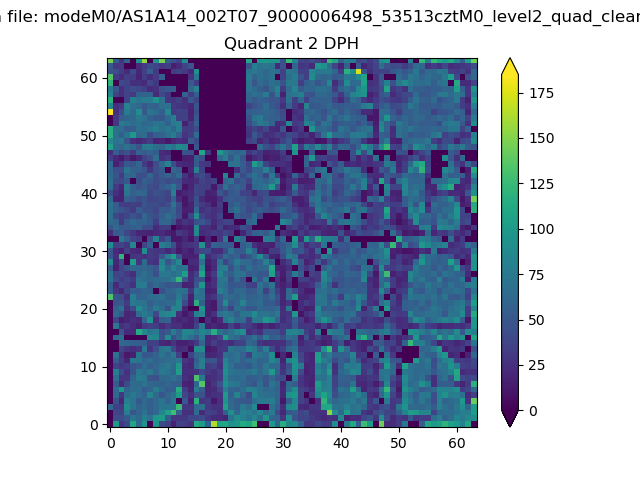 |
Quadrant C |
| Plot type | Count rate plots | Images |
|---|---|---|
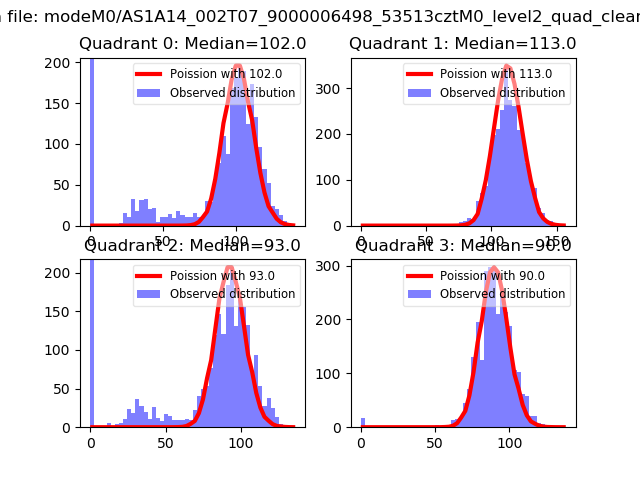
| Comparison with Poisson distribution Blue bars denote a histogram of data divided into 1 sec bins. Red curve is a Poisson curve with rate = median count rate of data. |
 |
 |
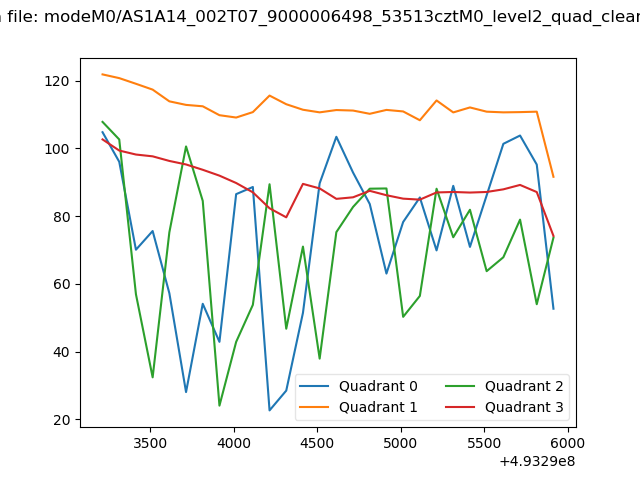
| Quadrant-wise count rates Data is divided into 100 sec bins |
 |
|
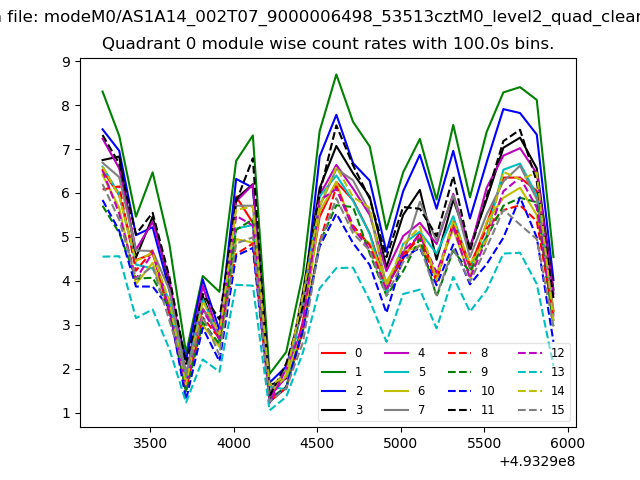
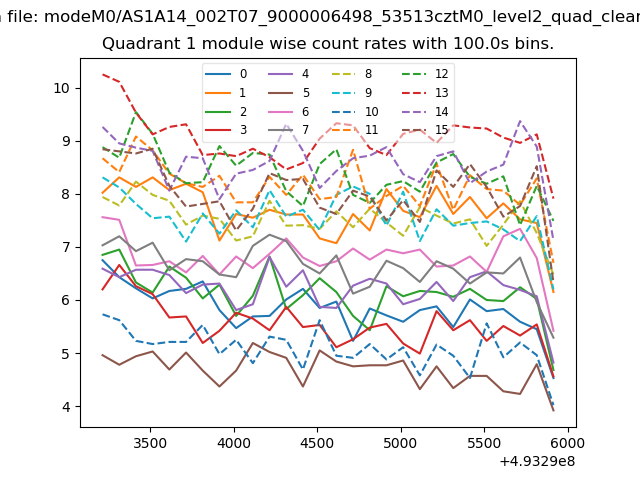
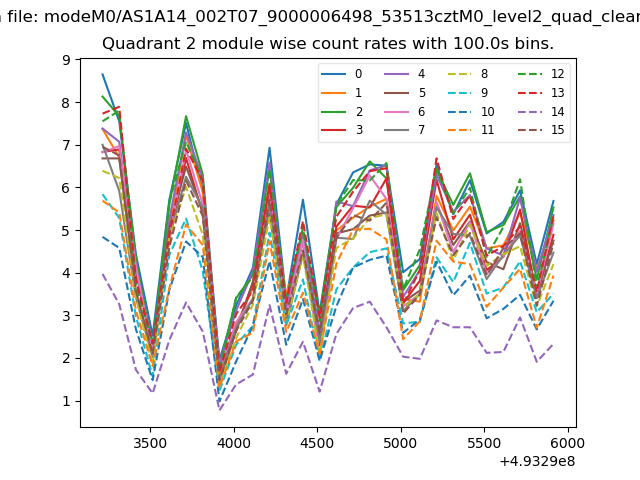
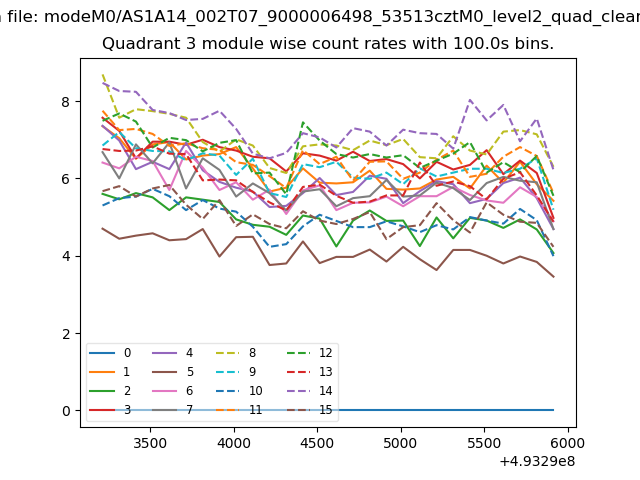
| Module-wise count rates for Quadrant A Data is divided into 100 sec bins |
 |
 |
| Module-wise count rates for Quadrant B Data is divided into 100 sec bins |
 |
 |
| Module-wise count rates for Quadrant C Data is divided into 100 sec bins |
 |
 |
| Module-wise count rates for Quadrant D Data is divided into 100 sec bins |
 |
 |
| Parameter | Plot |
|---|---|
| CZT HV Monitor | 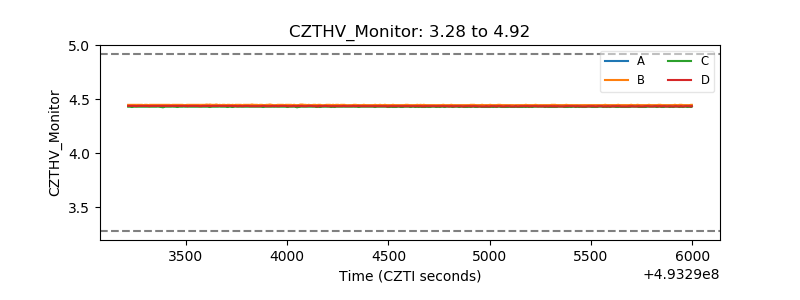 |
| D_VDD | 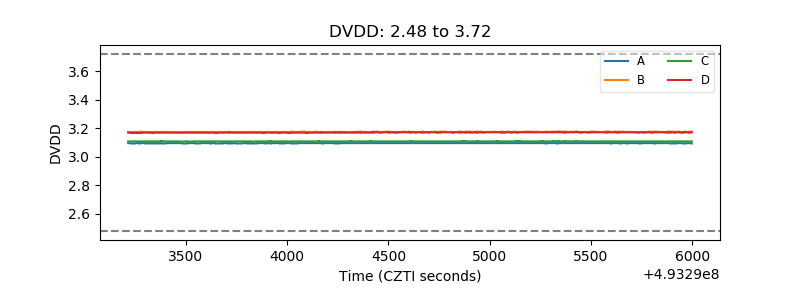 |
| Temperature 1 | 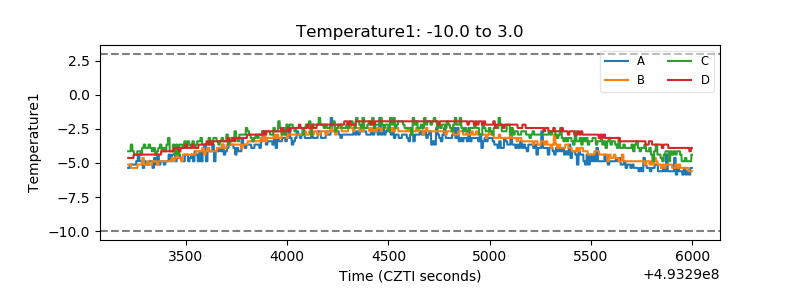 |
| Veto HV Monitor | 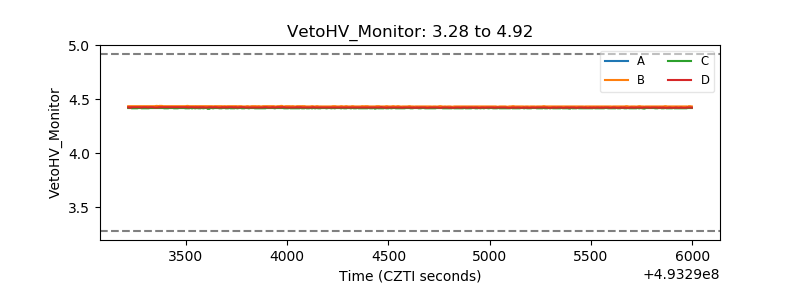 |
| Veto LLD | 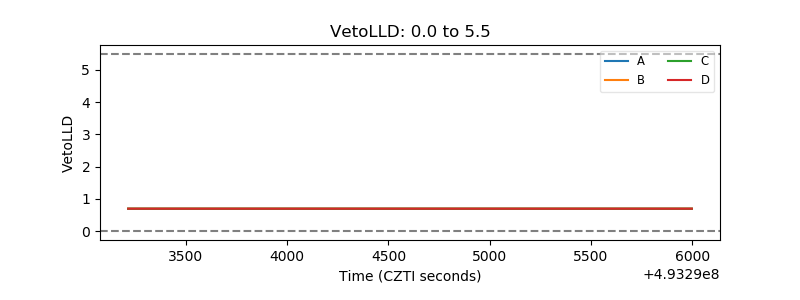 |
| Alpha Counter | 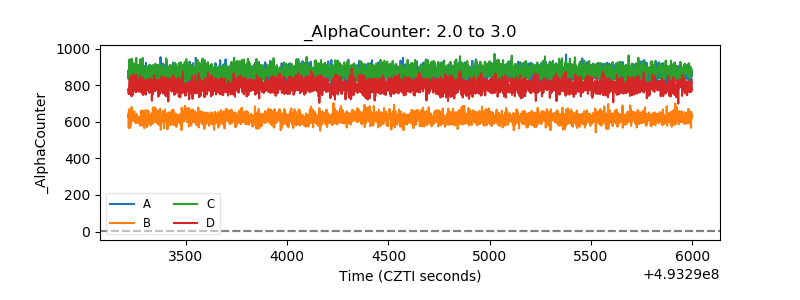 |
| _CPM_Rate | 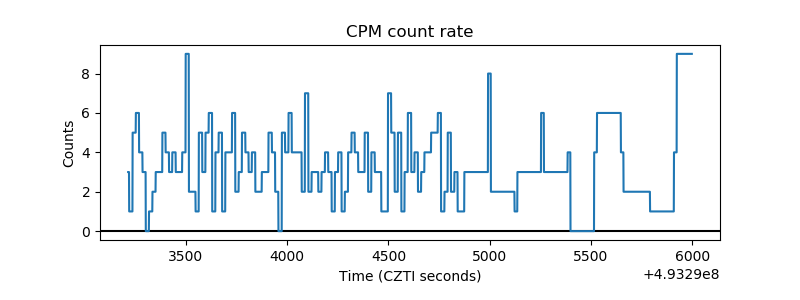 |
| CZT Counter | 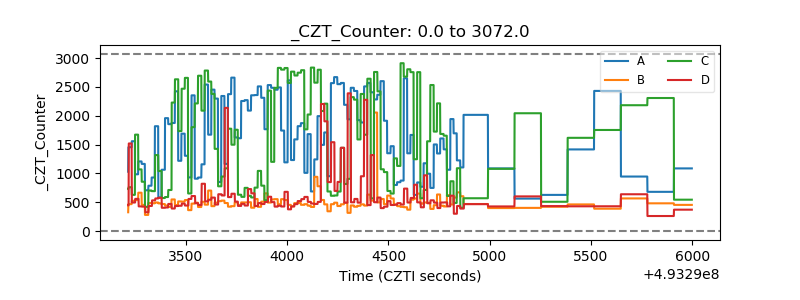 |
| +2.5 Volts monitor | 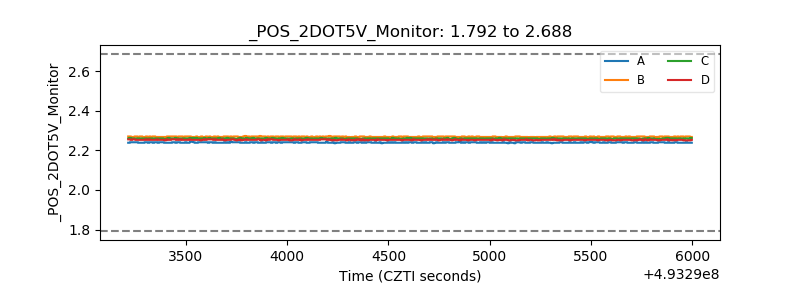 |
| +5 Volts monitor |  |
| _ROLL_ROT | 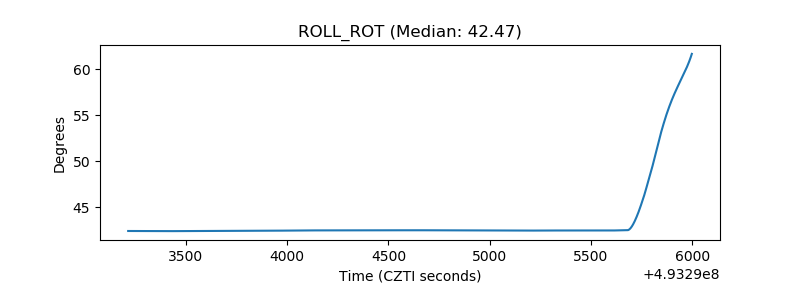 |
| _Roll_DEC | 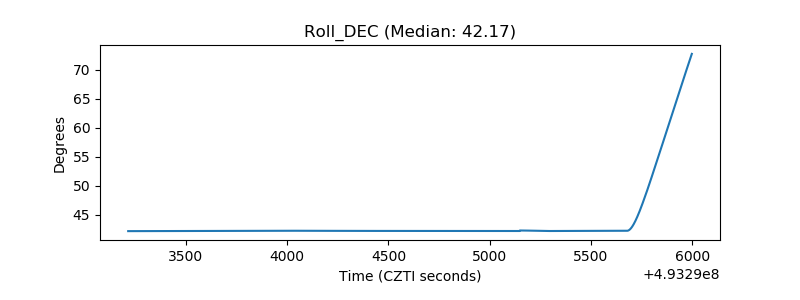 |
| _Roll_RA | 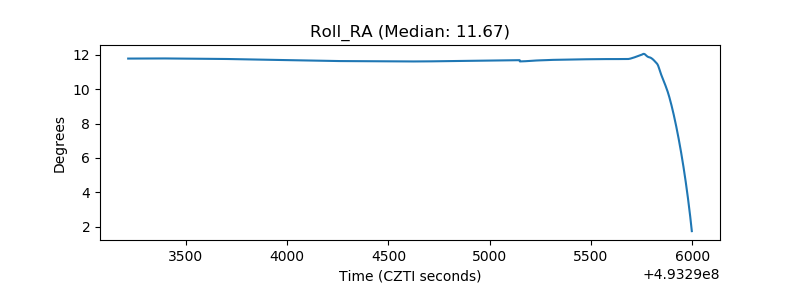 |
| Veto Counter | 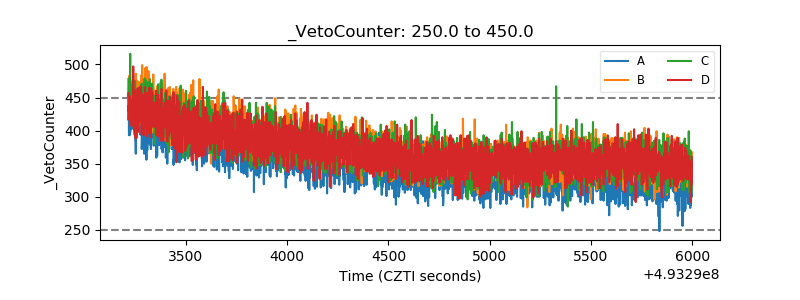 |