| Param | Original file | Final file |
|---|---|---|
| Filename | modeM0/AS1A14_004T04_9000006500cztM0_level2.fits | modeM0/AS1A14_004T04_9000006500cztM0_level2_quad_clean.evt |
| Size (bytes) | 533,401,920 | 152,487,360 |
| Size | 508.7 MB | 145.4 MB |
| Events in quadrant A | 3,288,262 | 282 |
| Events in quadrant B | 3,213,446 | 404 |
| Events in quadrant C | 2,114,784 | 337 |
| Events in quadrant D | 2,903,888 | 333 |
| Mode SS | |||
|---|---|---|---|
| Quadrant | BADHDUFLAG | Total packets | Discarded packets |
| A | 0 | 1362 | 0 |
| B | 0 | 1362 | 0 |
| C | 0 | 1362 | 0 |
| D | 0 | 1362 | 0 |
| Mode M0 | |||
|---|---|---|---|
| Quadrant | BADHDUFLAG | Total packets | Discarded packets |
| A | 0 | 245409 | 0 |
| B | 0 | 171407 | 0 |
| C | 0 | 407705 | 0 |
| D | 0 | 184771 | 0 |
| Mode M9 | |||
|---|---|---|---|
| Quadrant | BADHDUFLAG | Total packets | Discarded packets |
| A | 0 | 77 | 0 |
| B | 0 | 77 | 0 |
| C | 0 | 77 | 0 |
| D | 0 | 77 | 0 |
| Quadrant | Total seconds | Saturated seconds | Saturation percentage |
|---|---|---|---|
| A | 67233 | 8409 | 12.507251% |
| B | 67233 | 2758 | 4.102152% |
| C | 67232 | 35390 | 52.638624% |
| D | 67233 | 3168 | 4.711972% |
Noise dominated data is calculated using 1-second bins in cleaned event files. If a bin has >2000 counts, and if more than 50% of those come from <1% of pixels, then it is considered to be noise-dominated and hence unusable.
| Quadrant | # 1 sec bins | Bins with >0 counts | Bins with >2000 counts | High rate bins dominated by noise | Noise dominated (total time) | Noise dominated (detector-on time) | Marked lightcurve |
|---|---|---|---|---|---|---|---|
| A | 74743 | 67182 | 0 | 0 | 0.00% | 0.00% | 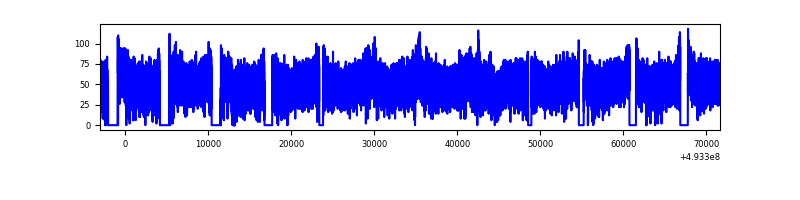 |
| B | 74743 | 67214 | 0 | 0 | 0.00% | 0.00% | 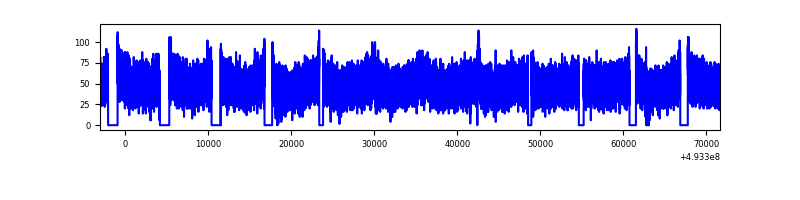 |
| C | 74743 | 64792 | 0 | 0 | 0.00% | 0.00% | 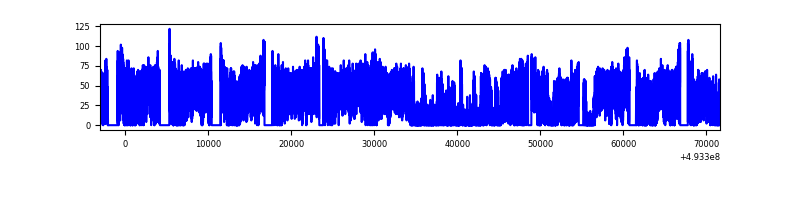 |
| D | 74743 | 67194 | 0 | 0 | 0.00% | 0.00% | 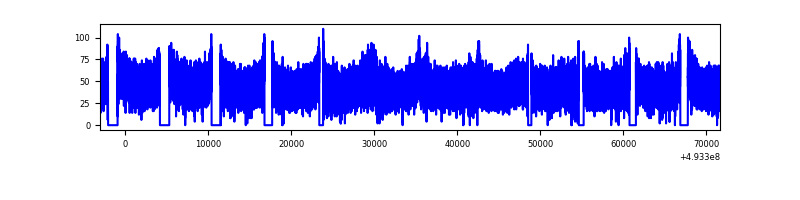 |
Top three noisy pixels from each quadrant. If the there are fewer than three noisy pixels in the level2.evt file, extra rows are filled as -1
| Pixel properties | Quadrant properties | ||||||
|---|---|---|---|---|---|---|---|
| Quadrant | DetID | PixID | Counts | Sigma | Mean | Median | Sigma |
| A | 14 | 188 | 3809 | 10.35 | 863 | 796 | 291.2 |
| A | 9 | 255 | 3307 | 8.62 | 863 | 796 | 291.2 |
| A | 14 | 204 | 3014 | 7.62 | 863 | 796 | 291.2 |
| B | 2 | 9 | 3601 | 13.93 | 850 | 802 | 200.9 |
| B | 2 | 8 | 3284 | 12.36 | 850 | 802 | 200.9 |
| B | 9 | 173 | 2578 | 8.84 | 850 | 802 | 200.9 |
| C | 2 | 31 | 1664 | 5.84 | 568 | 515 | 196.8 |
| C | 7 | 111 | 1588 | 5.45 | 568 | 515 | 196.8 |
| C | 6 | 179 | 1579 | 5.41 | 568 | 515 | 196.8 |
| D | 6 | 218 | 3658 | 10.39 | 830 | 733 | 281.4 |
| D | 15 | 11 | 2947 | 7.87 | 830 | 733 | 281.4 |
| D | 8 | 12 | 2684 | 6.93 | 830 | 733 | 281.4 |
Histogram calculated using DETX and DETY for each event in the final _common_clean file
| Quadrant A |  |
 |
Quadrant B |
|---|---|---|---|
| Quadrant D |  |
 |
Quadrant C |
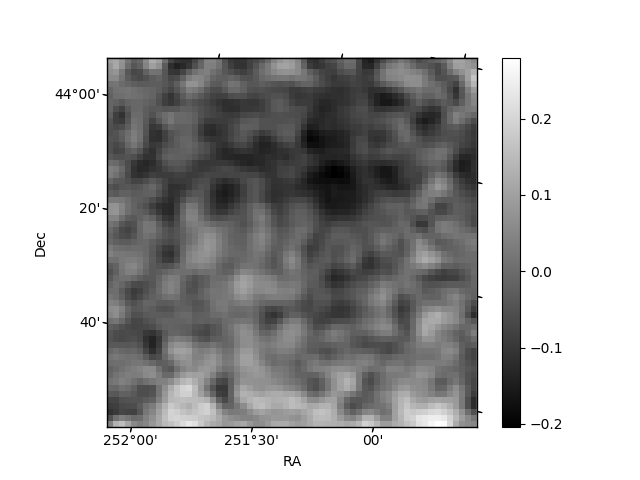
| Plot type | Count rate plots | Images |
|---|---|---|
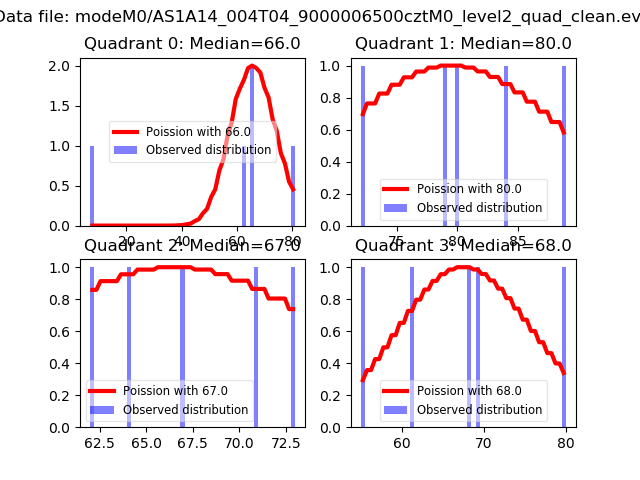
| Comparison with Poisson distribution Blue bars denote a histogram of data divided into 1 sec bins. Red curve is a Poisson curve with rate = median count rate of data. |
 |
 |
| Quadrant-wise count rates Data is divided into 100 sec bins |
 |
|
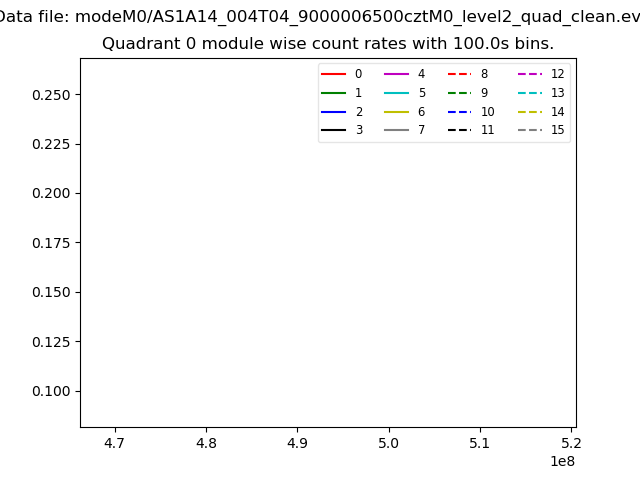
| Module-wise count rates for Quadrant A Data is divided into 100 sec bins |
 |
 |
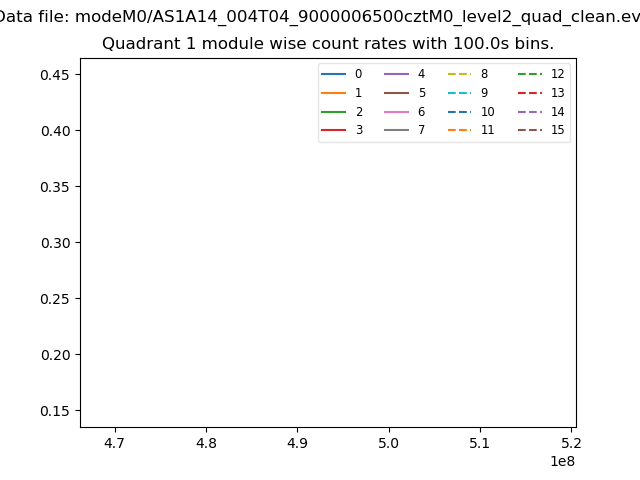
| Module-wise count rates for Quadrant B Data is divided into 100 sec bins |
 |
 |
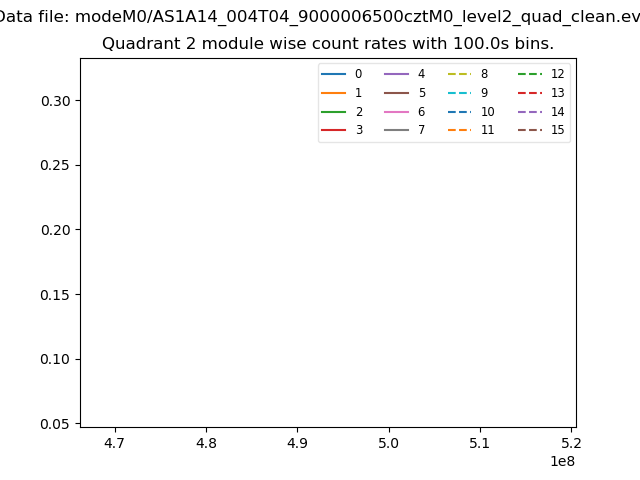
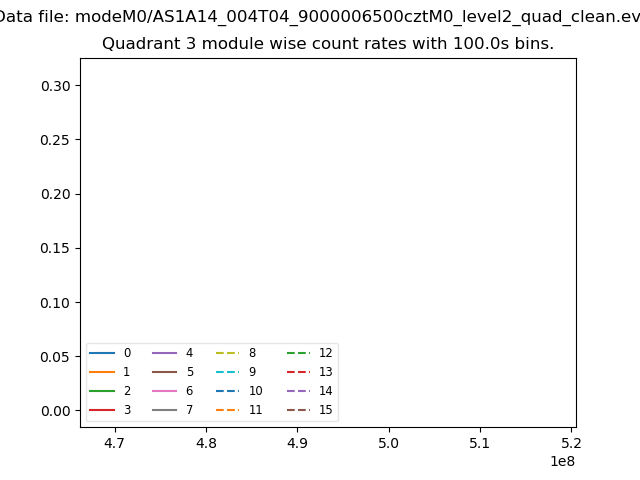
| Module-wise count rates for Quadrant C Data is divided into 100 sec bins |
 |
 |
| Module-wise count rates for Quadrant D Data is divided into 100 sec bins |
 |
 |
| Parameter | Plot |
|---|---|
| CZT HV Monitor | 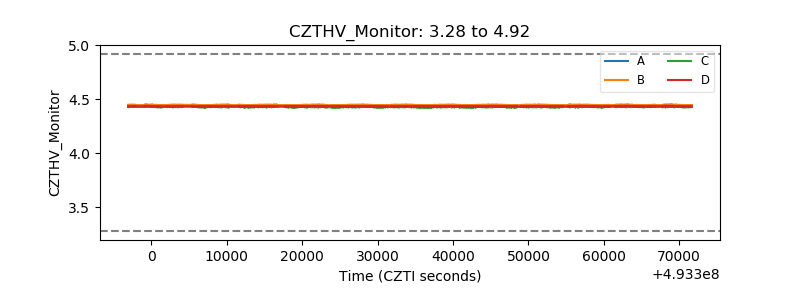 |
| D_VDD | 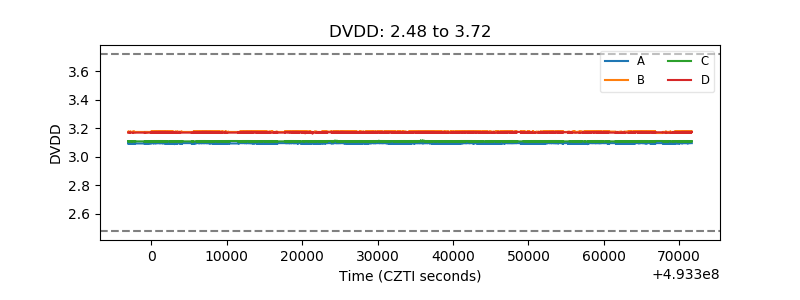 |
| Temperature 1 | 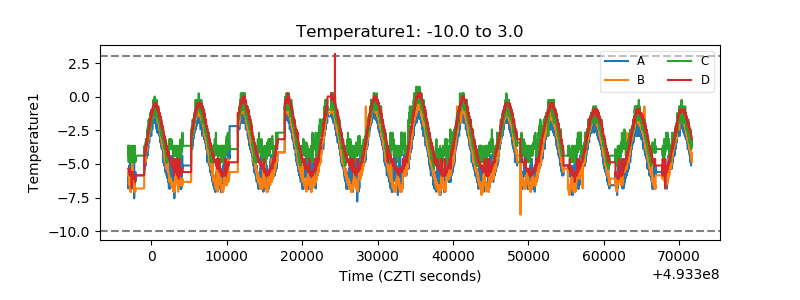 |
| Veto HV Monitor | 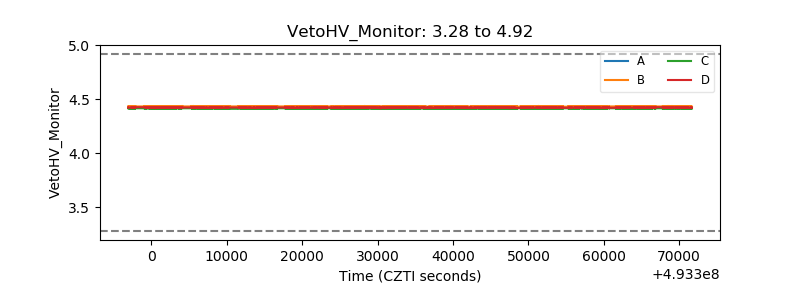 |
| Veto LLD | 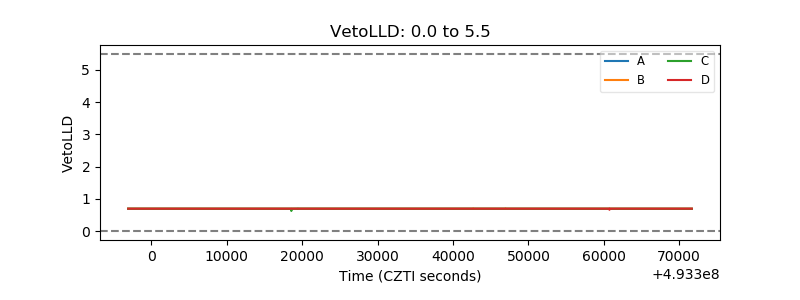 |
| Alpha Counter | 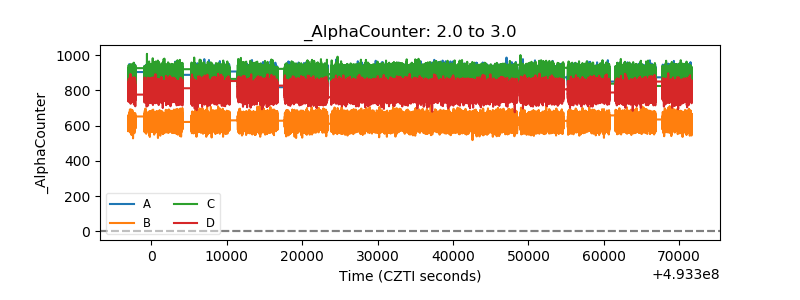 |
| _CPM_Rate | 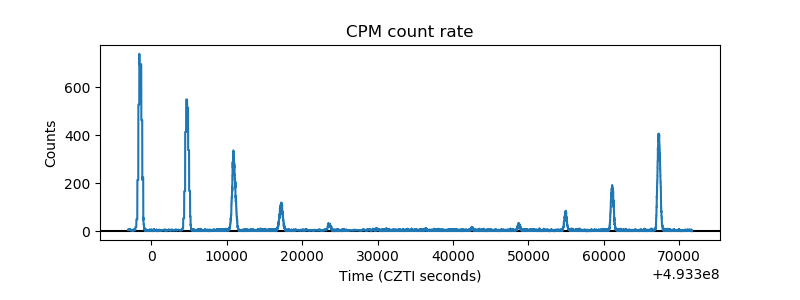 |
| CZT Counter | 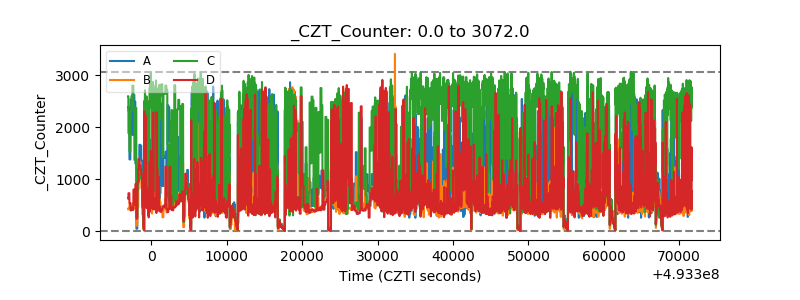 |
| +2.5 Volts monitor | 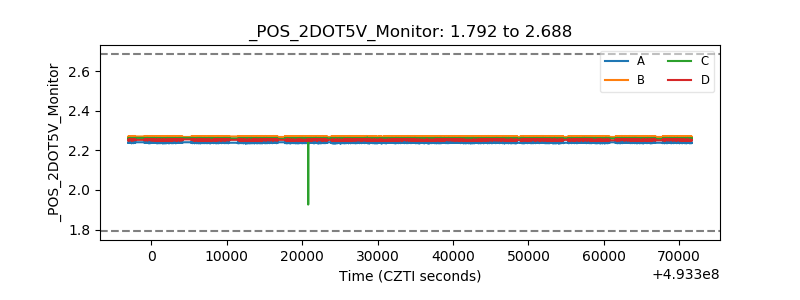 |
| +5 Volts monitor | 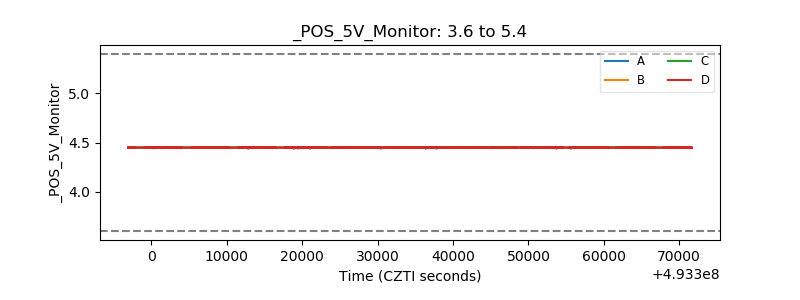 |
| _ROLL_ROT | 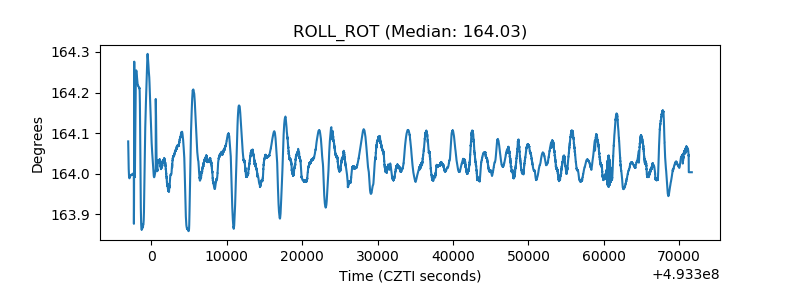 |
| _Roll_DEC | 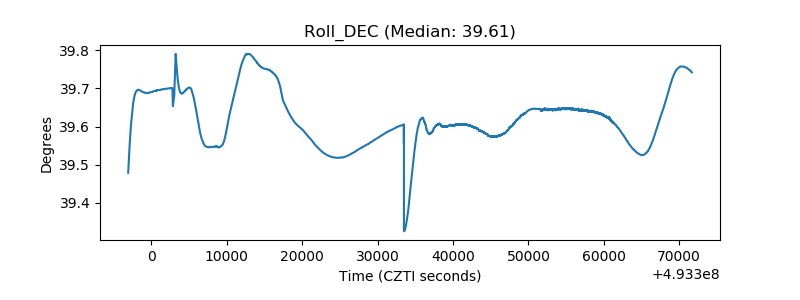 |
| _Roll_RA | 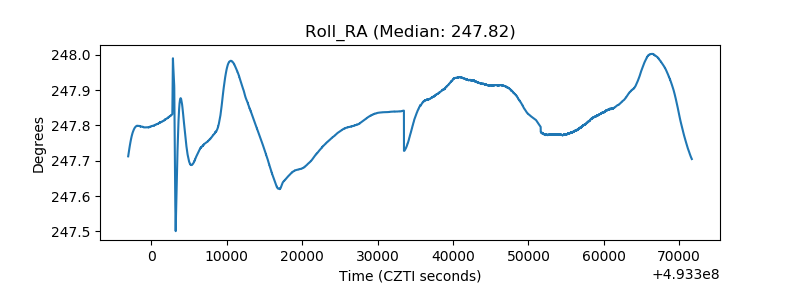 |
| Veto Counter | 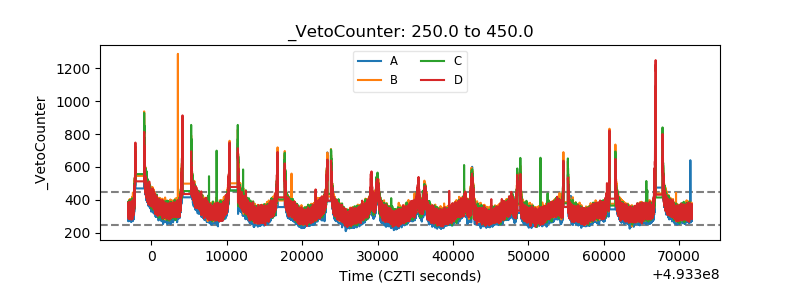 |