| Param | Original file | Final file |
|---|---|---|
| Filename | modeM0/AS1A14_004T04_9000006500_53513cztM0_level2.fits | modeM0/AS1A14_004T04_9000006500_53513cztM0_level2_quad_clean.evt |
| Size (bytes) | 343,656,000 | 35,303,040 |
| Size | 327.7 MB | 33.7 MB |
| Events in quadrant A | 3,907,833 | 214,406 |
| Events in quadrant B | 1,827,523 | 295,824 |
| Events in quadrant C | 5,193,223 | 114,170 |
| Events in quadrant D | 1,585,081 | 255,073 |
| Mode SS | |||
|---|---|---|---|
| Quadrant | BADHDUFLAG | Total packets | Discarded packets |
| A | 0 | 54 | 0 |
| B | 0 | 54 | 0 |
| C | 0 | 54 | 0 |
| D | 0 | 54 | 0 |
| Mode M0 | |||
|---|---|---|---|
| Quadrant | BADHDUFLAG | Total packets | Discarded packets |
| A | 0 | 13496 | 1 |
| B | 0 | 7169 | 1 |
| C | 0 | 17247 | 1 |
| D | 0 | 6416 | 2 |
| Mode M9 | |||
|---|---|---|---|
| Quadrant | BADHDUFLAG | Total packets | Discarded packets |
| A | 0 | 12 | 0 |
| B | 0 | 12 | 0 |
| C | 0 | 12 | 0 |
| D | 0 | 12 | 0 |
| Quadrant | Total seconds | Saturated seconds | Saturation percentage |
|---|---|---|---|
| A | 2651 | 858 | 32.365145% |
| B | 2651 | 186 | 7.016220% |
| C | 2651 | 1660 | 62.617880% |
| D | 2650 | 107 | 4.037736% |
Noise dominated data is calculated using 1-second bins in cleaned event files. If a bin has >2000 counts, and if more than 50% of those come from <1% of pixels, then it is considered to be noise-dominated and hence unusable.
| Quadrant | # 1 sec bins | Bins with >0 counts | Bins with >2000 counts | High rate bins dominated by noise | Noise dominated (total time) | Noise dominated (detector-on time) | Marked lightcurve |
|---|---|---|---|---|---|---|---|
| A | 3806 | 2652 | 650 | 650 | 17.08% | 24.51% | 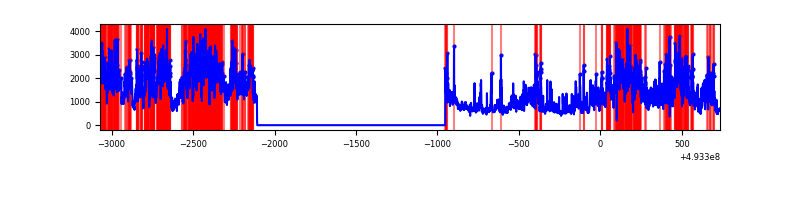 |
| B | 3806 | 2652 | 55 | 55 | 1.45% | 2.07% | 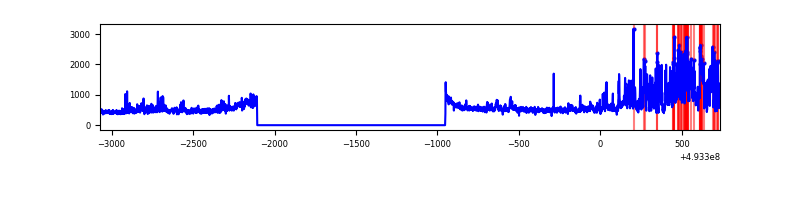 |
| C | 3806 | 2651 | 1392 | 1392 | 36.57% | 52.51% | 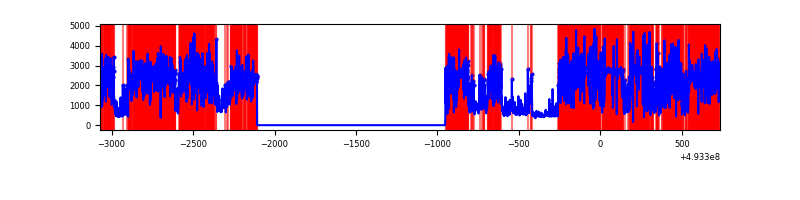 |
| D | 3805 | 2651 | 32 | 32 | 0.84% | 1.21% | 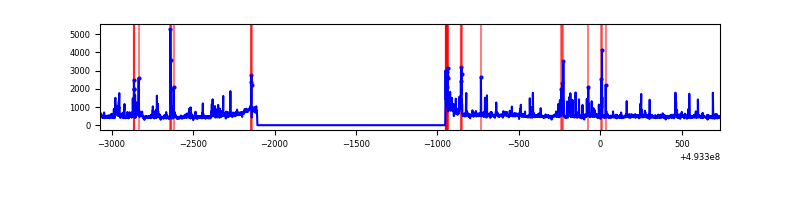 |
Top three noisy pixels from each quadrant. If the there are fewer than three noisy pixels in the level2.evt file, extra rows are filled as -1
| Pixel properties | Quadrant properties | ||||||
|---|---|---|---|---|---|---|---|
| Quadrant | DetID | PixID | Counts | Sigma | Mean | Median | Sigma |
| A | 3 | 62 | 1991803 | 27692.01 | 288 | 281 | 71.9 |
| A | 3 | 63 | 465065 | 6462.8 | 288 | 281 | 71.9 |
| A | 15 | 174 | 300087 | 4168.79 | 288 | 281 | 71.9 |
| B | 4 | 171 | 304246 | 4370.39 | 318 | 306 | 69.5 |
| B | 5 | 185 | 108139 | 1550.55 | 318 | 306 | 69.5 |
| B | 10 | 28 | 60785 | 869.64 | 318 | 306 | 69.5 |
| C | 7 | 64 | 2992234 | 51577.07 | 208 | 206 | 58.0 |
| C | 1 | 241 | 727486 | 12536.97 | 208 | 206 | 58.0 |
| C | 15 | 147 | 203071 | 3497.02 | 208 | 206 | 58.0 |
| D | 3 | 12 | 100121 | 1118.02 | 316 | 303 | 89.3 |
| D | 2 | 153 | 60073 | 669.46 | 316 | 303 | 89.3 |
| D | 8 | 176 | 47449 | 528.06 | 316 | 303 | 89.3 |
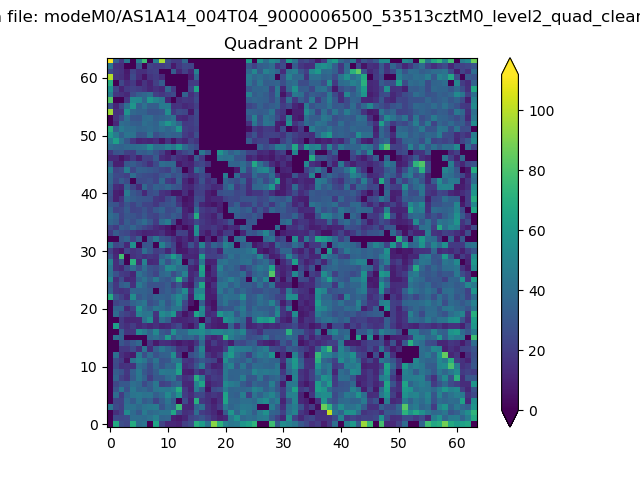
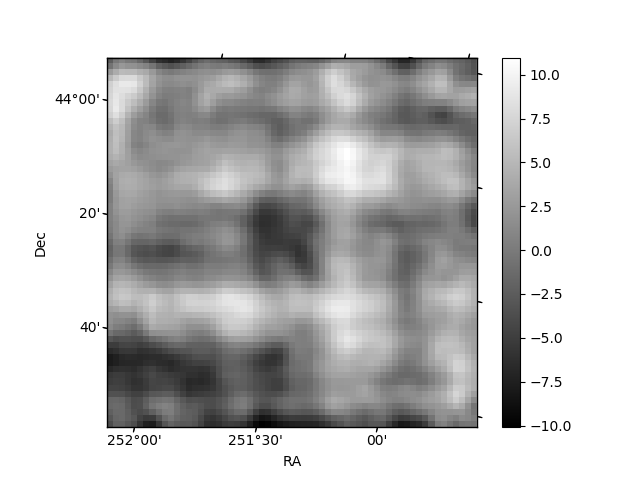
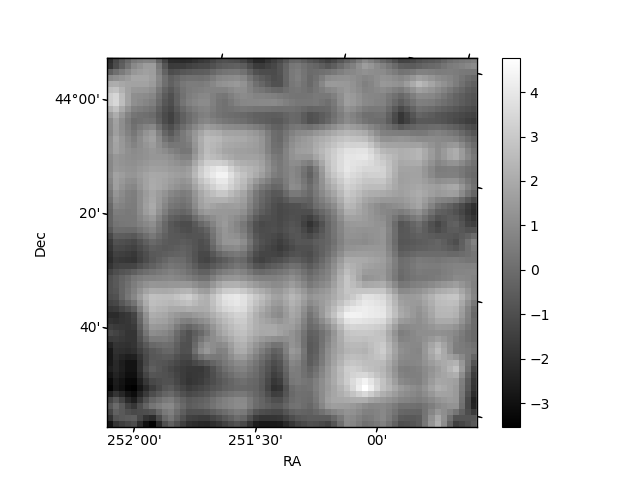
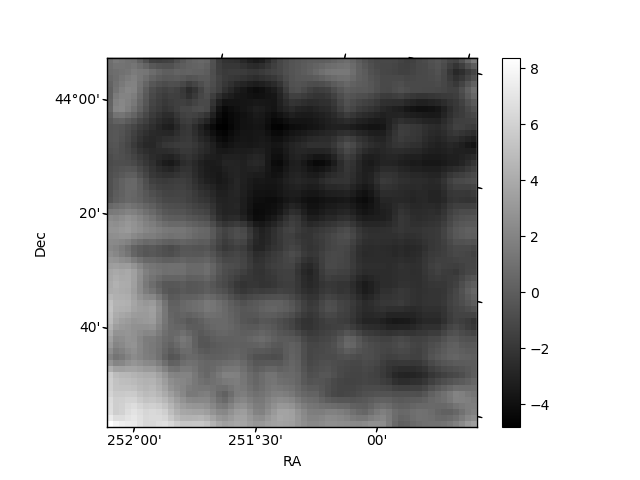
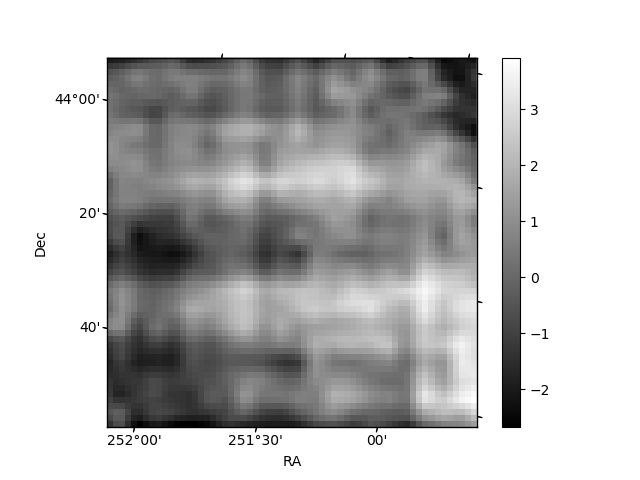
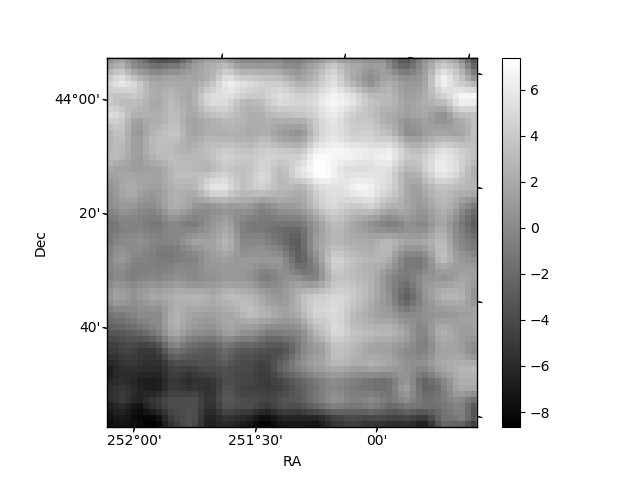
Histogram calculated using DETX and DETY for each event in the final _common_clean file
| Quadrant A | 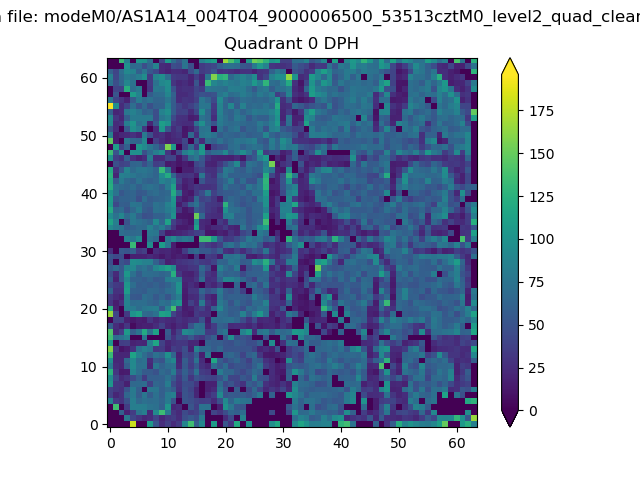 |
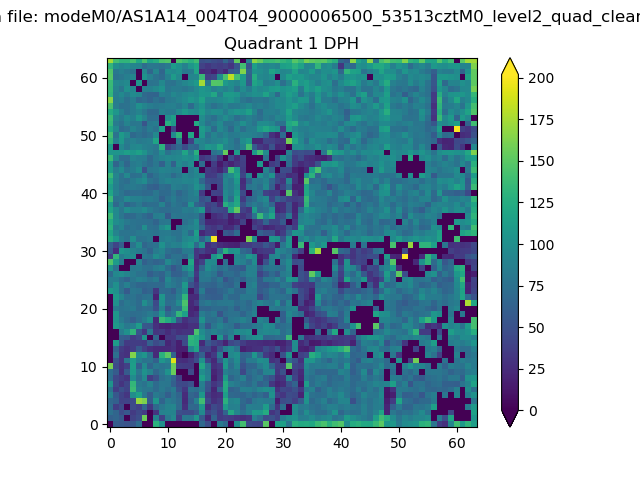 |
Quadrant B |
|---|---|---|---|
| Quadrant D | 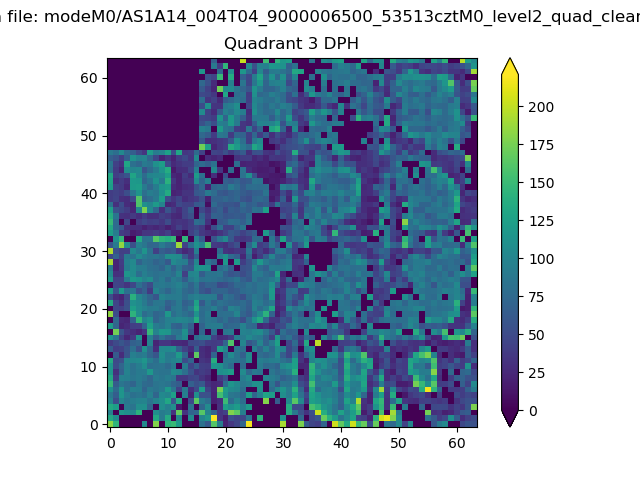 |
 |
Quadrant C |
| Plot type | Count rate plots | Images |
|---|---|---|
| Comparison with Poisson distribution Blue bars denote a histogram of data divided into 1 sec bins. Red curve is a Poisson curve with rate = median count rate of data. |
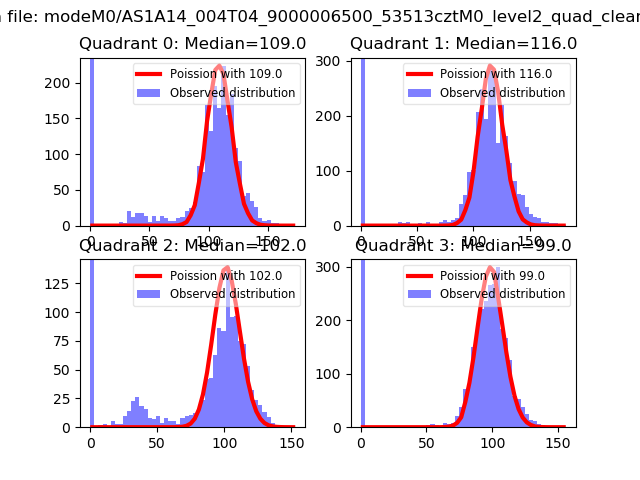 |
 |
| Quadrant-wise count rates Data is divided into 100 sec bins |
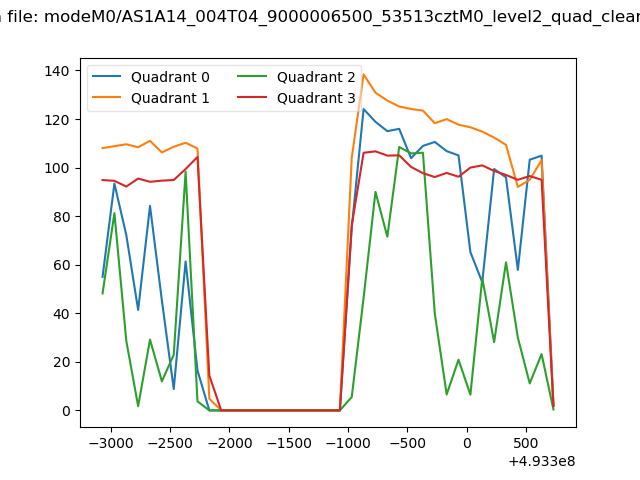 |
|
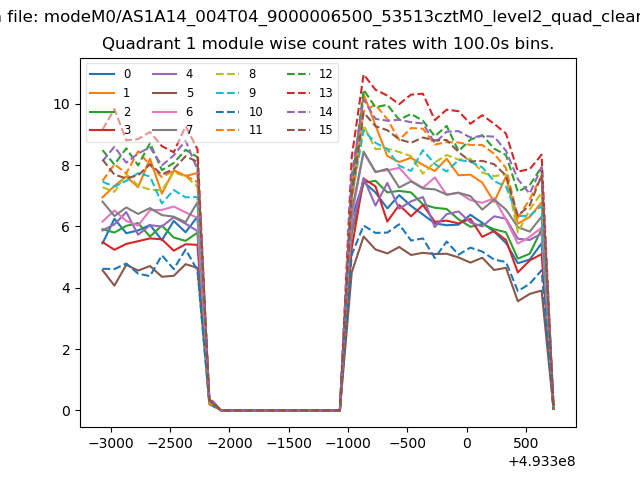
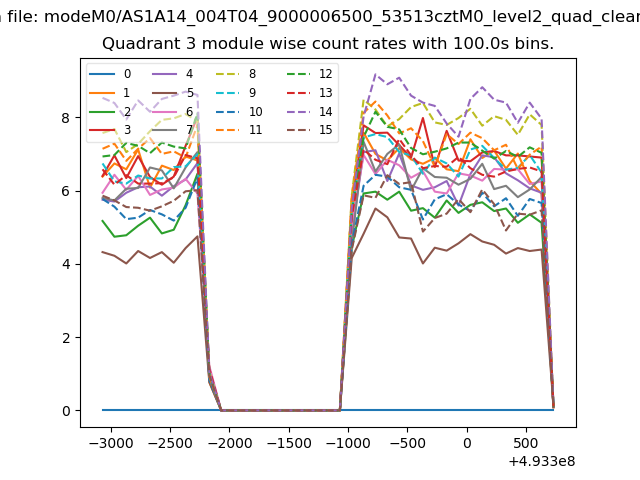
| Module-wise count rates for Quadrant A Data is divided into 100 sec bins |
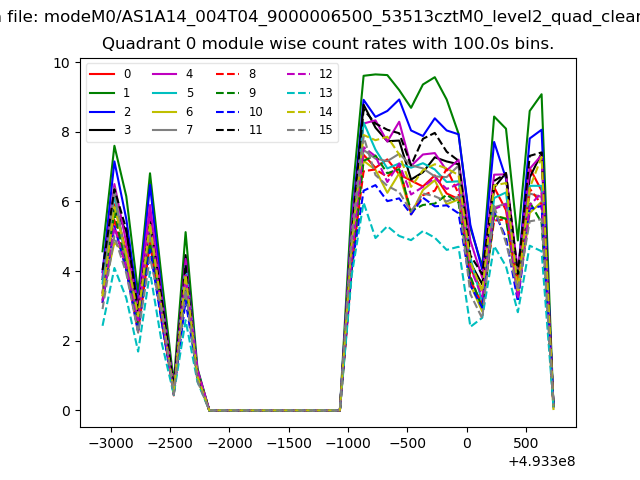 |
 |
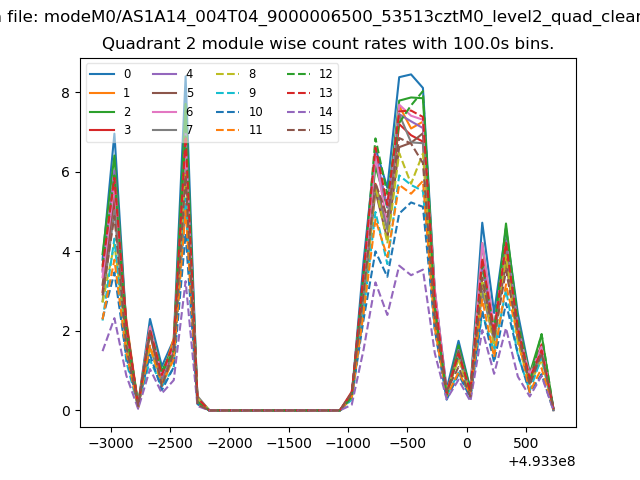
| Module-wise count rates for Quadrant B Data is divided into 100 sec bins |
 |
 |
| Module-wise count rates for Quadrant C Data is divided into 100 sec bins |
 |
 |
| Module-wise count rates for Quadrant D Data is divided into 100 sec bins |
 |
 |
| Parameter | Plot |
|---|---|
| CZT HV Monitor |  |
| D_VDD | 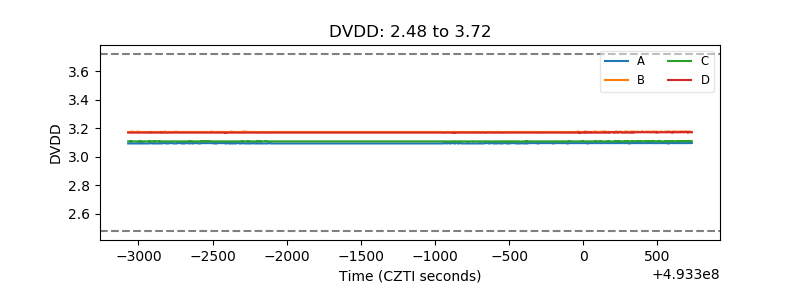 |
| Temperature 1 | 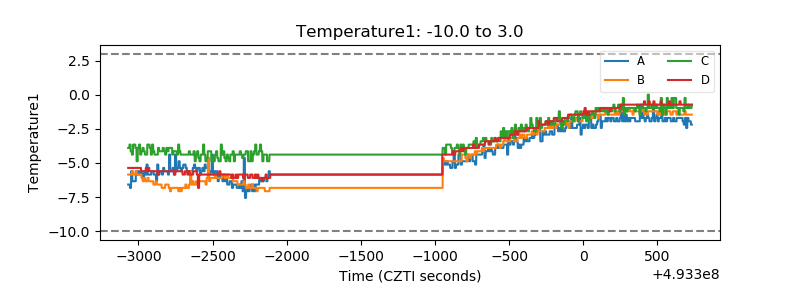 |
| Veto HV Monitor | 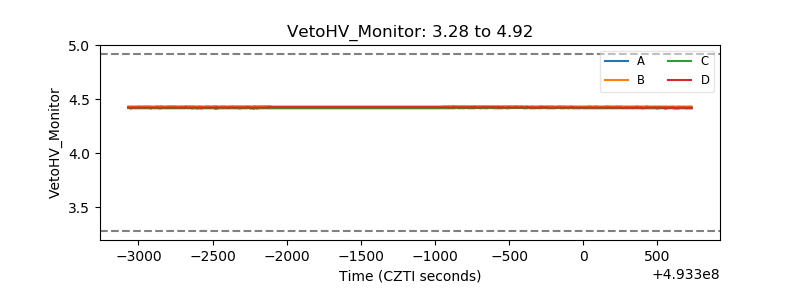 |
| Veto LLD | 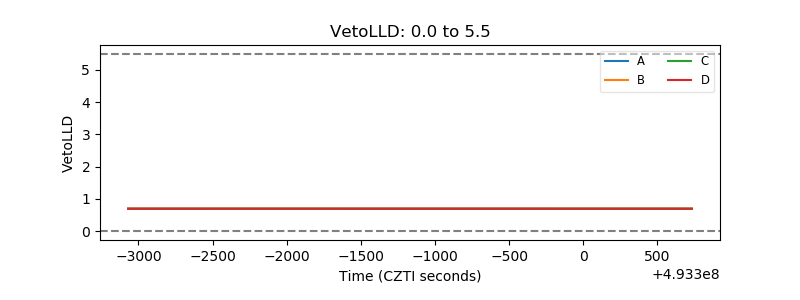 |
| Alpha Counter | 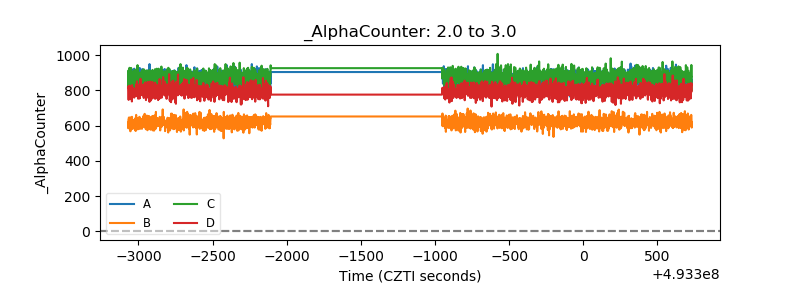 |
| _CPM_Rate | 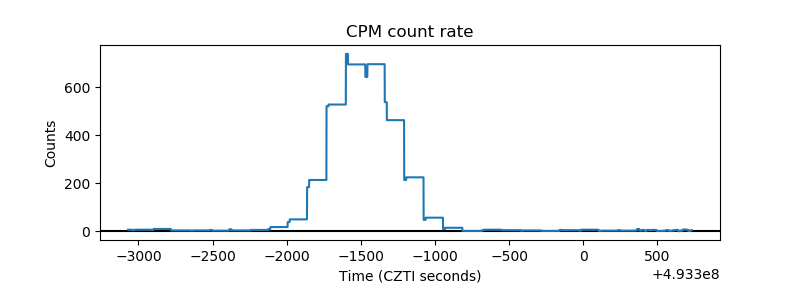 |
| CZT Counter | 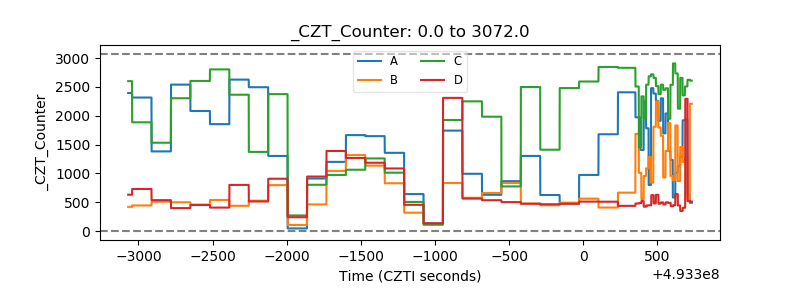 |
| +2.5 Volts monitor | 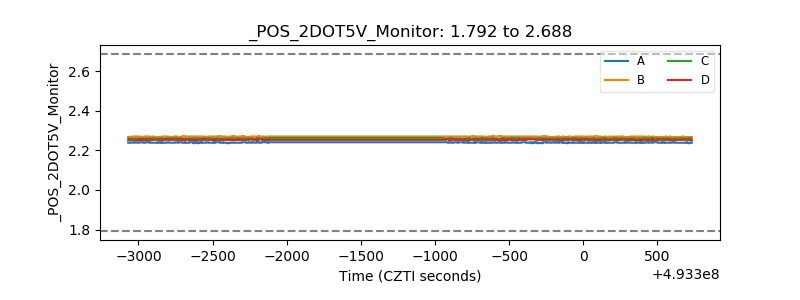 |
| +5 Volts monitor | 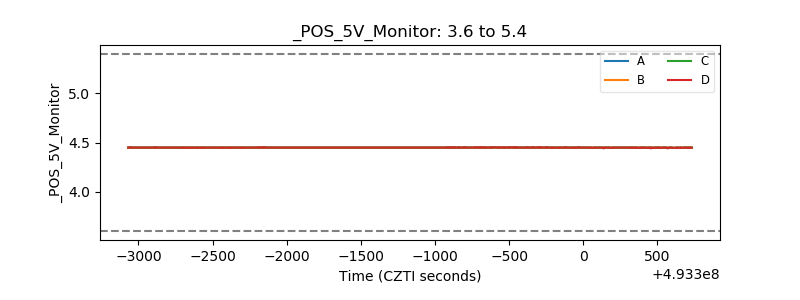 |
| _ROLL_ROT | 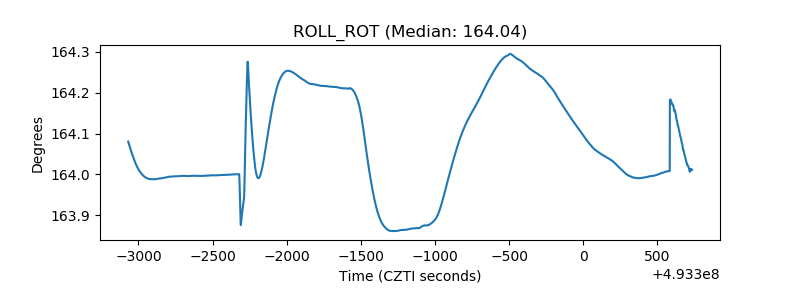 |
| _Roll_DEC | 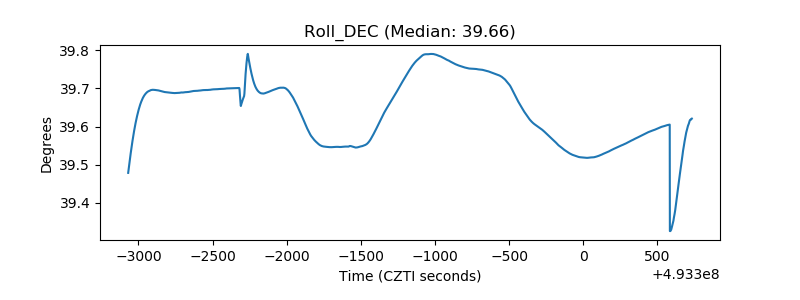 |
| _Roll_RA | 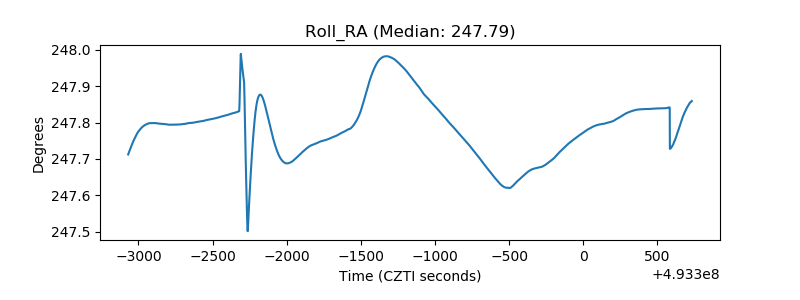 |
| Veto Counter | 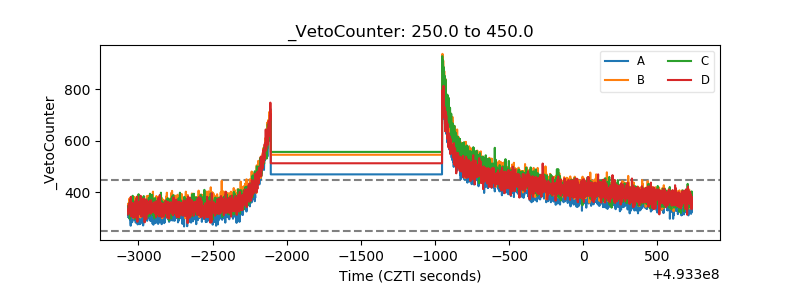 |