| Param | Original file | Final file |
|---|---|---|
| Filename | modeM0/AS1A14_004T04_9000006500_53514cztM0_level2.fits | modeM0/AS1A14_004T04_9000006500_53514cztM0_level2_quad_clean.evt |
| Size (bytes) | 790,531,200 | 82,676,160 |
| Size | 753.9 MB | 78.8 MB |
| Events in quadrant A | 8,176,067 | 543,473 |
| Events in quadrant B | 4,979,394 | 661,595 |
| Events in quadrant C | 11,897,871 | 283,754 |
| Events in quadrant D | 3,725,912 | 577,802 |
| Mode SS | |||
|---|---|---|---|
| Quadrant | BADHDUFLAG | Total packets | Discarded packets |
| A | 0 | 128 | 0 |
| B | 0 | 128 | 0 |
| C | 0 | 128 | 0 |
| D | 0 | 128 | 0 |
| Mode M0 | |||
|---|---|---|---|
| Quadrant | BADHDUFLAG | Total packets | Discarded packets |
| A | 0 | 28651 | 1 |
| B | 0 | 19132 | 1 |
| C | 0 | 39589 | 8 |
| D | 0 | 15192 | 1 |
| Mode M9 | |||
|---|---|---|---|
| Quadrant | BADHDUFLAG | Total packets | Discarded packets |
| A | 0 | 11 | 0 |
| B | 0 | 11 | 0 |
| C | 0 | 11 | 0 |
| D | 0 | 11 | 0 |
| Quadrant | Total seconds | Saturated seconds | Saturation percentage |
|---|---|---|---|
| A | 6251 | 1412 | 22.588386% |
| B | 6251 | 477 | 7.630779% |
| C | 6250 | 3643 | 58.288000% |
| D | 6250 | 169 | 2.704000% |
Noise dominated data is calculated using 1-second bins in cleaned event files. If a bin has >2000 counts, and if more than 50% of those come from <1% of pixels, then it is considered to be noise-dominated and hence unusable.
| Quadrant | # 1 sec bins | Bins with >0 counts | Bins with >2000 counts | High rate bins dominated by noise | Noise dominated (total time) | Noise dominated (detector-on time) | Marked lightcurve |
|---|---|---|---|---|---|---|---|
| A | 7386 | 6252 | 1147 | 1147 | 15.53% | 18.35% | 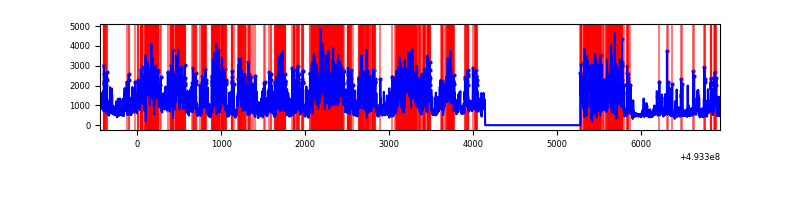 |
| B | 7386 | 6252 | 161 | 161 | 2.18% | 2.58% | 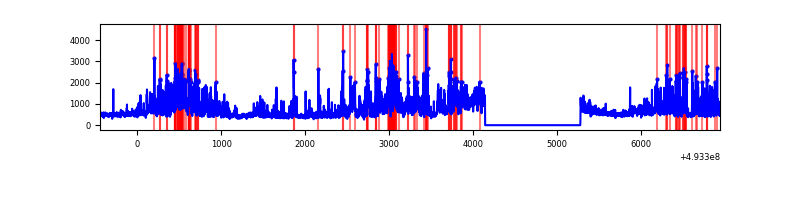 |
| C | 7385 | 6251 | 3109 | 3109 | 42.10% | 49.74% | 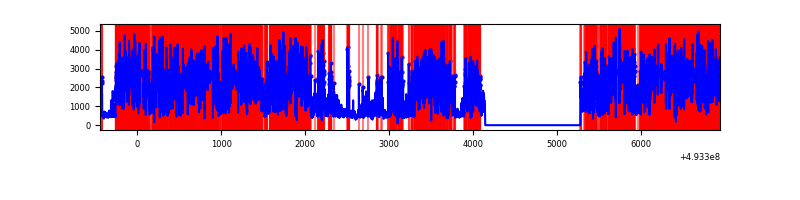 |
| D | 7385 | 6251 | 52 | 52 | 0.70% | 0.83% | 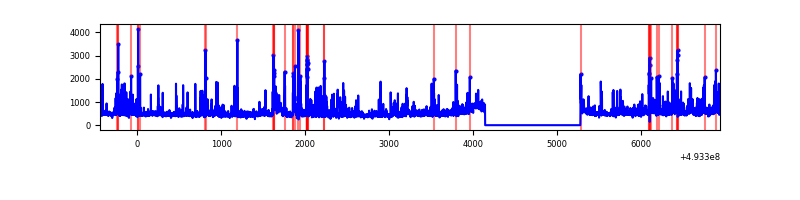 |
Top three noisy pixels from each quadrant. If the there are fewer than three noisy pixels in the level2.evt file, extra rows are filled as -1
| Pixel properties | Quadrant properties | ||||||
|---|---|---|---|---|---|---|---|
| Quadrant | DetID | PixID | Counts | Sigma | Mean | Median | Sigma |
| A | 3 | 62 | 3827996 | 23363.41 | 658 | 642 | 163.8 |
| A | 15 | 174 | 1084449 | 6615.91 | 658 | 642 | 163.8 |
| A | 3 | 63 | 627584 | 3827.06 | 658 | 642 | 163.8 |
| B | 2 | 249 | 791721 | 5441.17 | 684 | 662 | 145.4 |
| B | 4 | 171 | 785569 | 5398.86 | 684 | 662 | 145.4 |
| B | 10 | 254 | 175018 | 1199.28 | 684 | 662 | 145.4 |
| C | 7 | 64 | 5632031 | 43916.48 | 465 | 461 | 128.2 |
| C | 1 | 241 | 2455936 | 19148.45 | 465 | 461 | 128.2 |
| C | 15 | 224 | 1133759 | 8837.76 | 465 | 461 | 128.2 |
| D | 2 | 153 | 264743 | 1317.29 | 698 | 666 | 200.5 |
| D | 2 | 120 | 222031 | 1104.23 | 698 | 666 | 200.5 |
| D | 3 | 12 | 101643 | 503.7 | 698 | 666 | 200.5 |
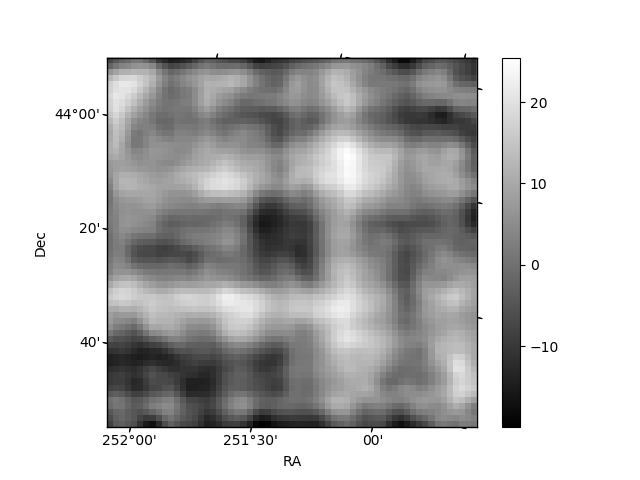
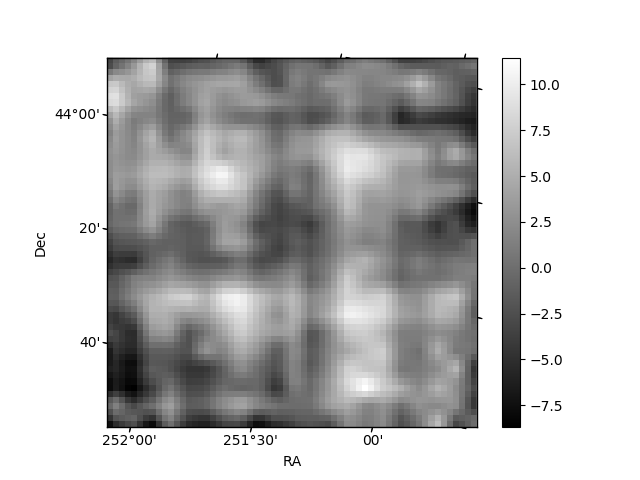
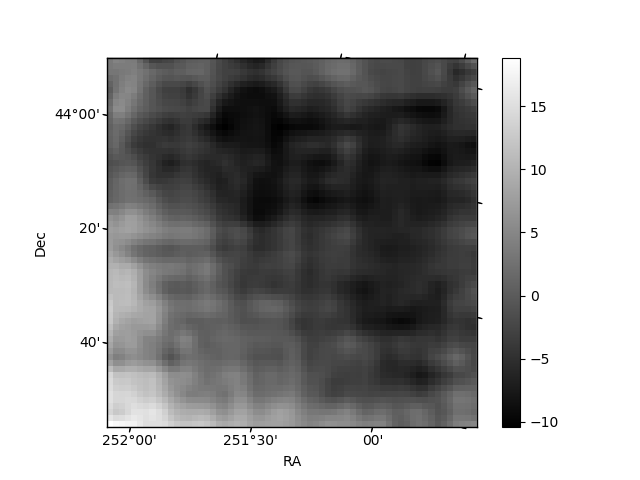
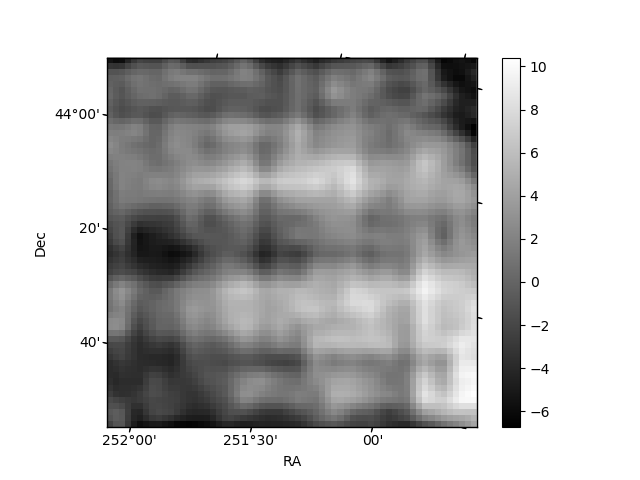
Histogram calculated using DETX and DETY for each event in the final _common_clean file
| Quadrant A | 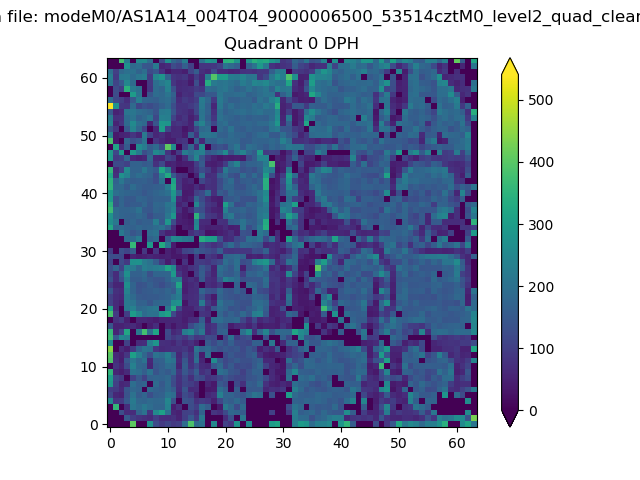 |
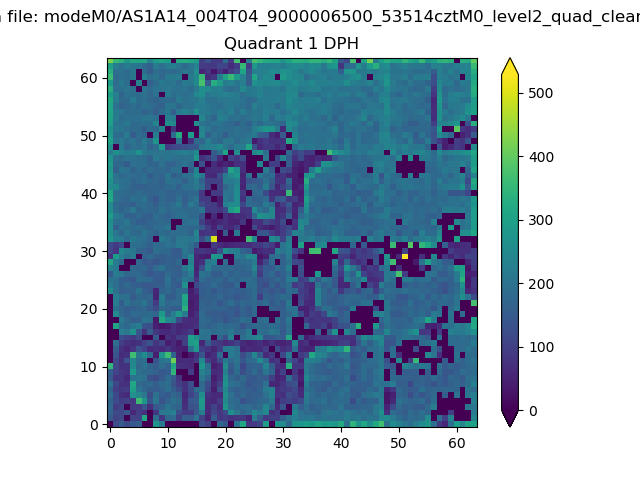 |
Quadrant B |
|---|---|---|---|
| Quadrant D | 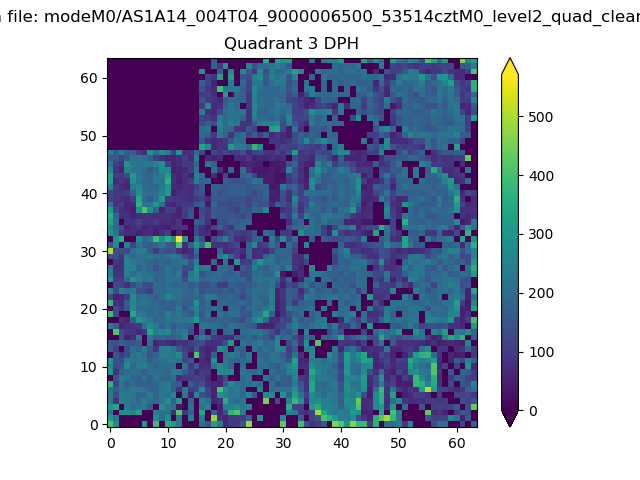 |
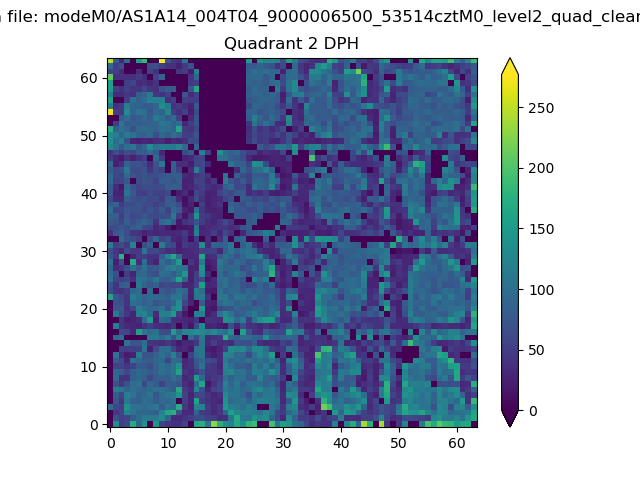 |
Quadrant C |
| Plot type | Count rate plots | Images |
|---|---|---|
| Comparison with Poisson distribution Blue bars denote a histogram of data divided into 1 sec bins. Red curve is a Poisson curve with rate = median count rate of data. |
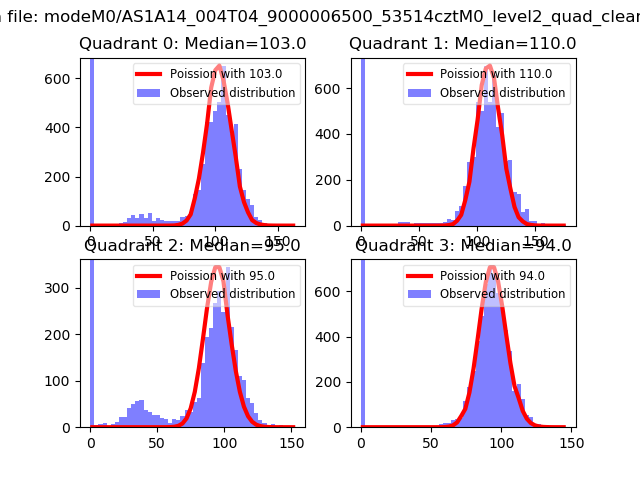 |
 |
| Quadrant-wise count rates Data is divided into 100 sec bins |
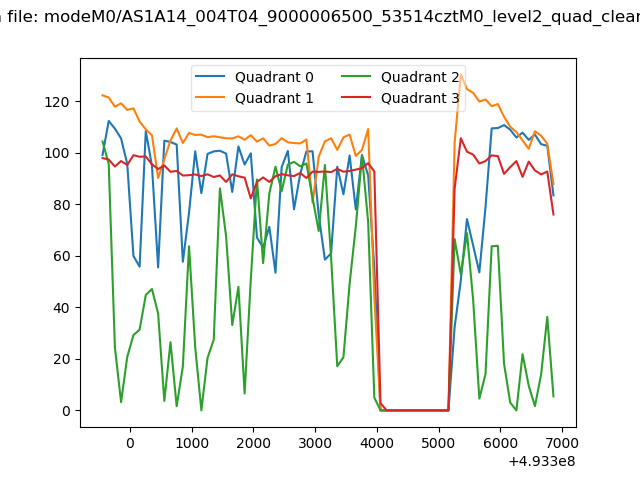 |
|
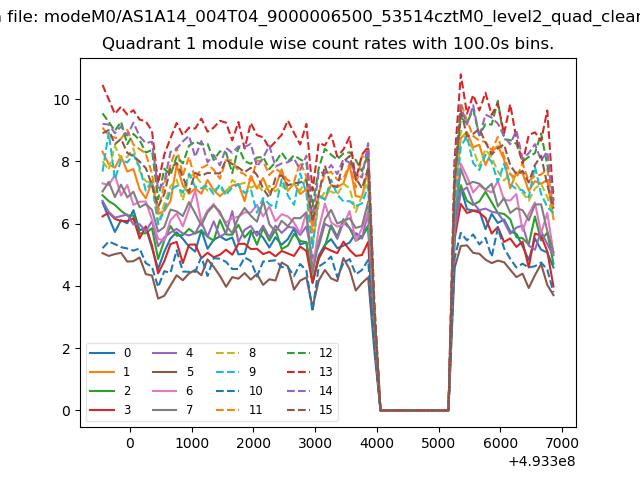
| Module-wise count rates for Quadrant A Data is divided into 100 sec bins |
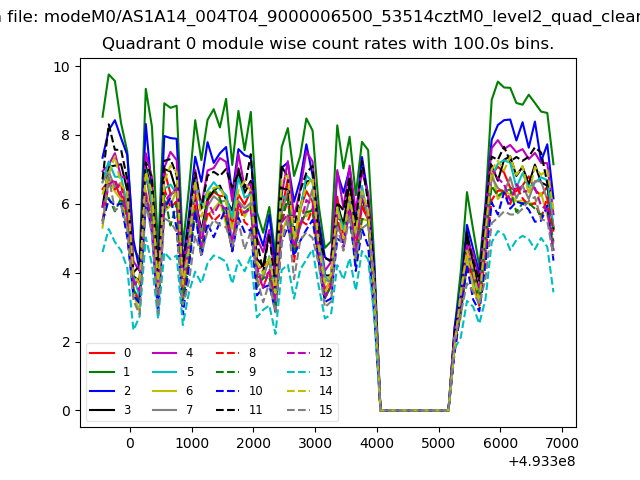 |
 |
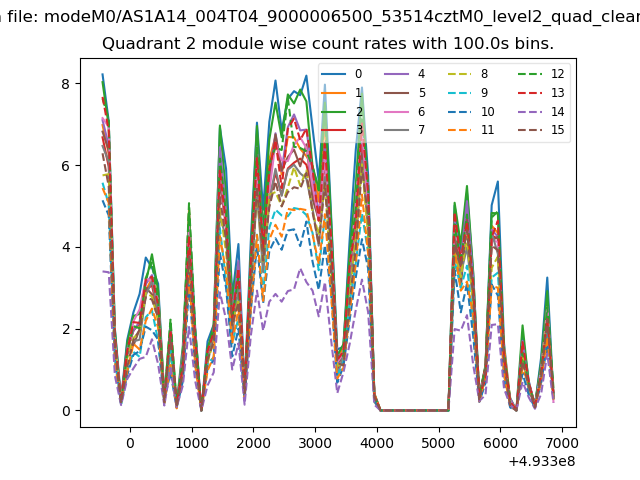
| Module-wise count rates for Quadrant B Data is divided into 100 sec bins |
 |
 |
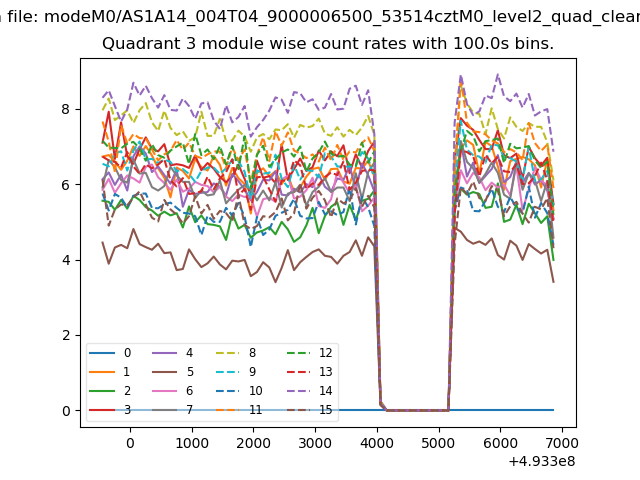
| Module-wise count rates for Quadrant C Data is divided into 100 sec bins |
 |
 |
| Module-wise count rates for Quadrant D Data is divided into 100 sec bins |
 |
 |
| Parameter | Plot |
|---|---|
| CZT HV Monitor | 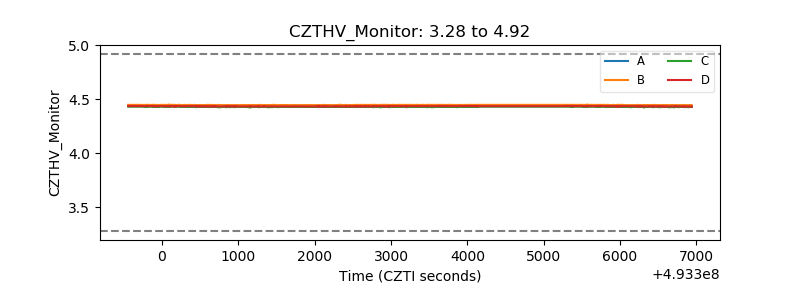 |
| D_VDD | 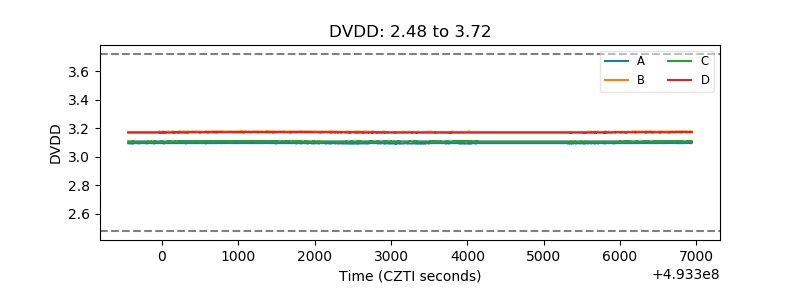 |
| Temperature 1 | 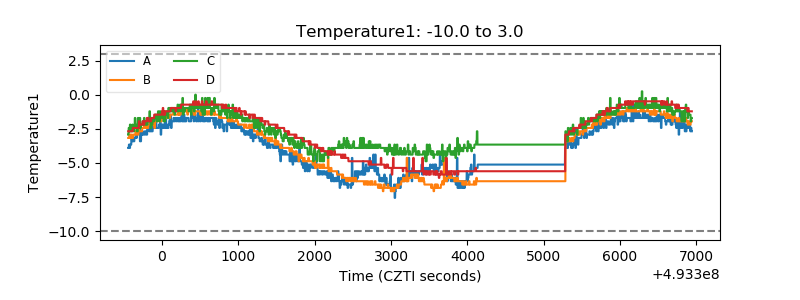 |
| Veto HV Monitor | 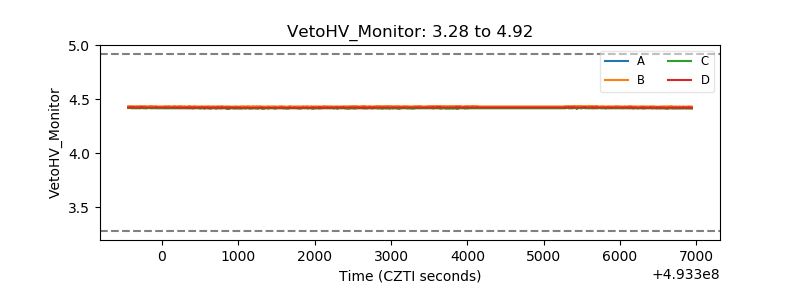 |
| Veto LLD | 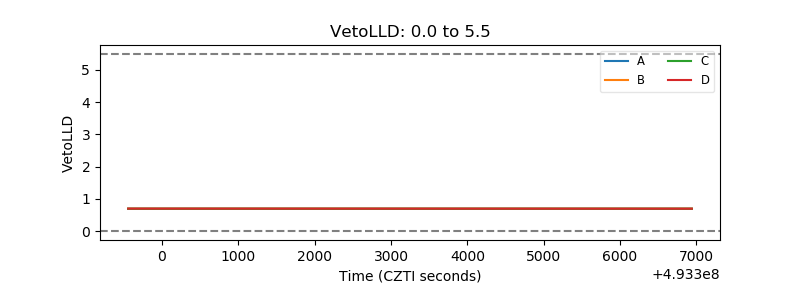 |
| Alpha Counter | 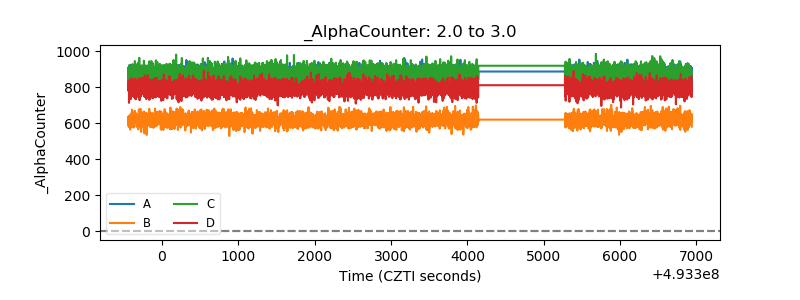 |
| _CPM_Rate | 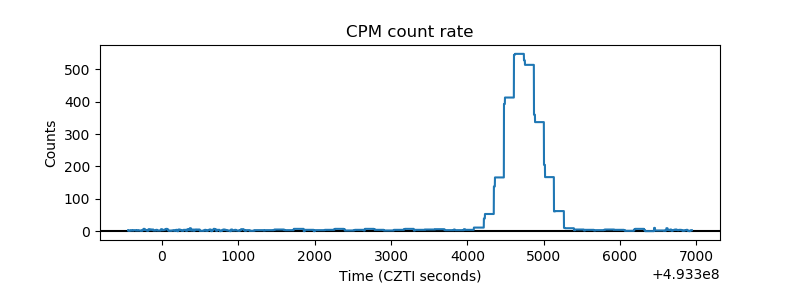 |
| CZT Counter | 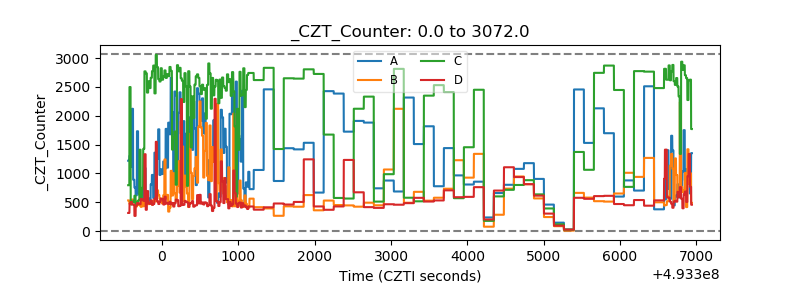 |
| +2.5 Volts monitor | 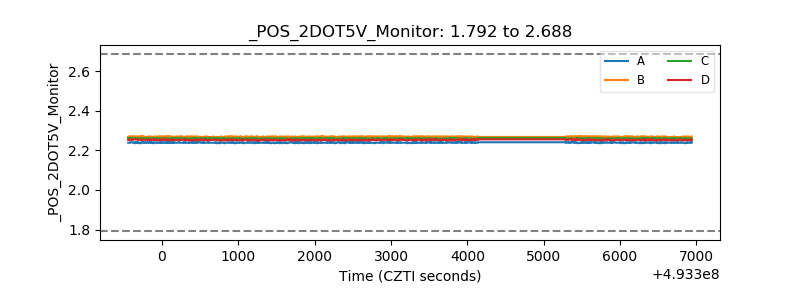 |
| +5 Volts monitor |  |
| _ROLL_ROT | 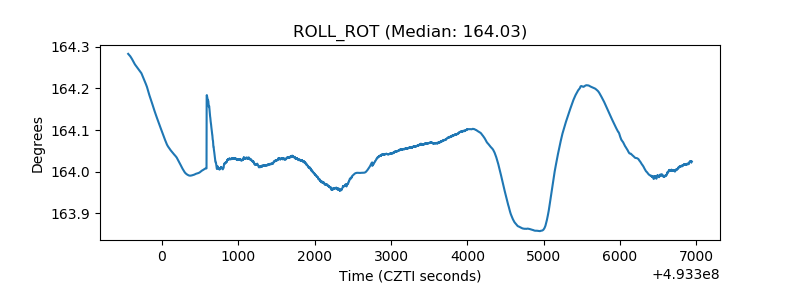 |
| _Roll_DEC | 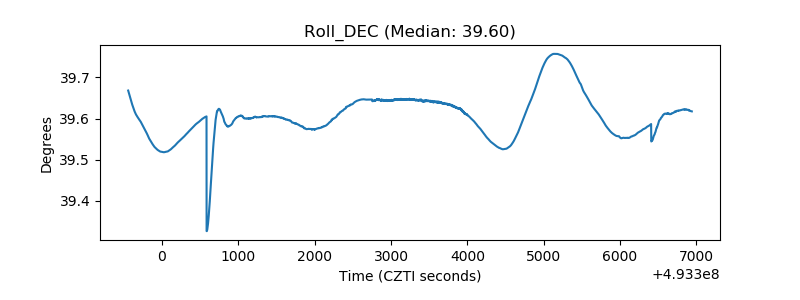 |
| _Roll_RA | 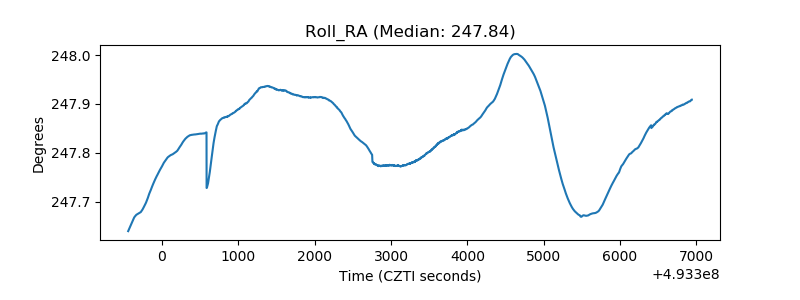 |
| Veto Counter | 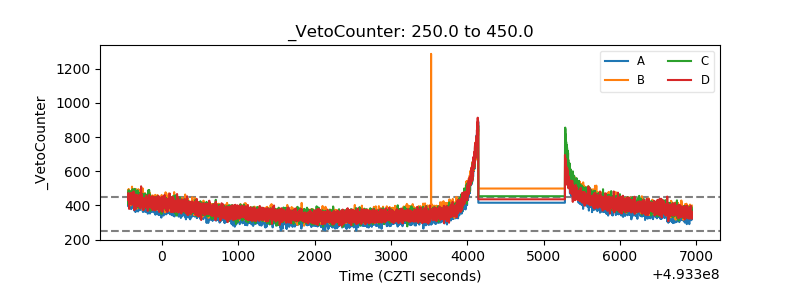 |