| Param | Original file | Final file |
|---|---|---|
| Filename | modeM0/AS1A14_004T04_9000006500_53515cztM0_level2.fits | modeM0/AS1A14_004T04_9000006500_53515cztM0_level2_quad_clean.evt |
| Size (bytes) | 688,412,160 | 84,916,800 |
| Size | 656.5 MB | 81.0 MB |
| Events in quadrant A | 6,099,184 | 572,284 |
| Events in quadrant B | 4,236,934 | 655,330 |
| Events in quadrant C | 10,240,039 | 355,103 |
| Events in quadrant D | 4,423,622 | 553,399 |
| Mode SS | |||
|---|---|---|---|
| Quadrant | BADHDUFLAG | Total packets | Discarded packets |
| A | 0 | 128 | 0 |
| B | 0 | 128 | 0 |
| C | 0 | 128 | 0 |
| D | 0 | 128 | 0 |
| Mode M0 | |||
|---|---|---|---|
| Quadrant | BADHDUFLAG | Total packets | Discarded packets |
| A | 0 | 22430 | 1 |
| B | 0 | 16834 | 1 |
| C | 0 | 34700 | 9 |
| D | 0 | 17364 | 1 |
| Mode M9 | |||
|---|---|---|---|
| Quadrant | BADHDUFLAG | Total packets | Discarded packets |
| A | 0 | 12 | 0 |
| B | 0 | 12 | 0 |
| C | 0 | 12 | 0 |
| D | 0 | 12 | 0 |
| Quadrant | Total seconds | Saturated seconds | Saturation percentage |
|---|---|---|---|
| A | 6235 | 806 | 12.927025% |
| B | 6236 | 288 | 4.618345% |
| C | 6235 | 2777 | 44.538893% |
| D | 6235 | 330 | 5.292702% |
Noise dominated data is calculated using 1-second bins in cleaned event files. If a bin has >2000 counts, and if more than 50% of those come from <1% of pixels, then it is considered to be noise-dominated and hence unusable.
| Quadrant | # 1 sec bins | Bins with >0 counts | Bins with >2000 counts | High rate bins dominated by noise | Noise dominated (total time) | Noise dominated (detector-on time) | Marked lightcurve |
|---|---|---|---|---|---|---|---|
| A | 7334 | 6236 | 560 | 560 | 7.64% | 8.98% | 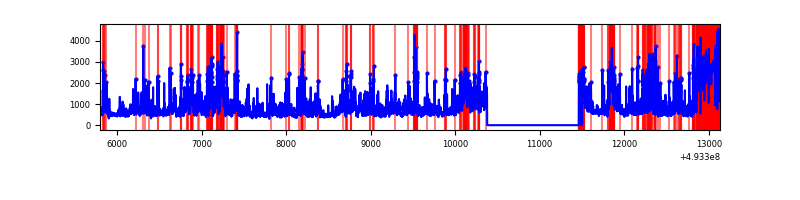 |
| B | 7336 | 6238 | 104 | 104 | 1.42% | 1.67% | 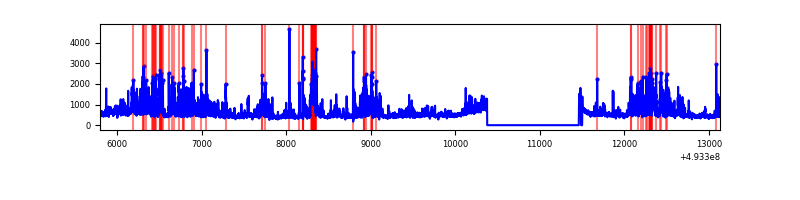 |
| C | 7335 | 6237 | 2339 | 2339 | 31.89% | 37.50% | 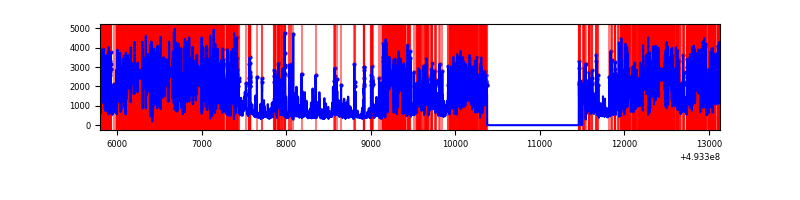 |
| D | 7334 | 6236 | 252 | 252 | 3.44% | 4.04% | 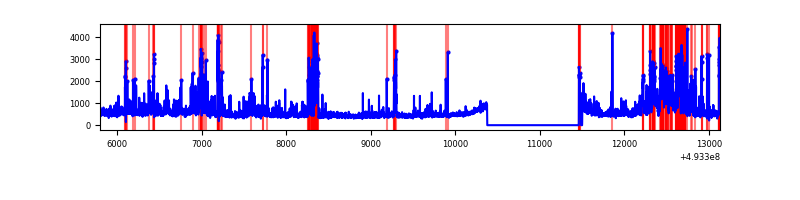 |
Top three noisy pixels from each quadrant. If the there are fewer than three noisy pixels in the level2.evt file, extra rows are filled as -1
| Pixel properties | Quadrant properties | ||||||
|---|---|---|---|---|---|---|---|
| Quadrant | DetID | PixID | Counts | Sigma | Mean | Median | Sigma |
| A | 3 | 62 | 2023152 | 12372.21 | 658 | 641 | 163.5 |
| A | 15 | 174 | 992735 | 6068.89 | 658 | 641 | 163.5 |
| A | 3 | 63 | 363039 | 2216.88 | 658 | 641 | 163.5 |
| B | 4 | 171 | 707038 | 4913.02 | 678 | 655 | 143.8 |
| B | 2 | 249 | 240147 | 1665.71 | 678 | 655 | 143.8 |
| B | 10 | 28 | 147399 | 1020.63 | 678 | 655 | 143.8 |
| C | 1 | 241 | 2716443 | 19025.53 | 512 | 506 | 142.8 |
| C | 7 | 64 | 2483491 | 17393.66 | 512 | 506 | 142.8 |
| C | 12 | 254 | 967129 | 6771.33 | 512 | 506 | 142.8 |
| D | 2 | 153 | 780967 | 4004.54 | 676 | 647 | 194.9 |
| D | 2 | 16 | 220800 | 1129.81 | 676 | 647 | 194.9 |
| D | 2 | 120 | 212022 | 1084.76 | 676 | 647 | 194.9 |
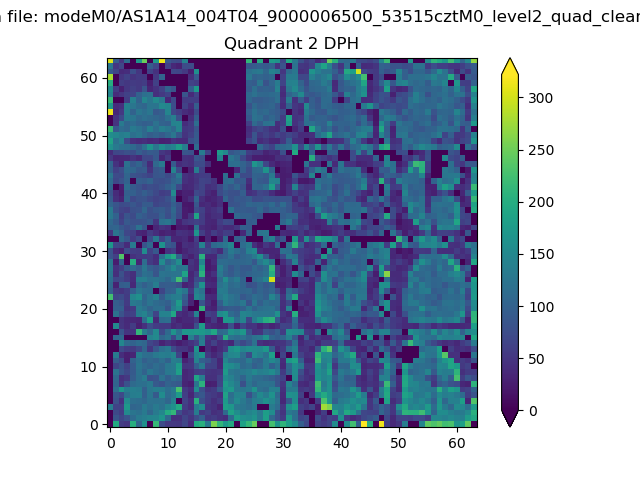
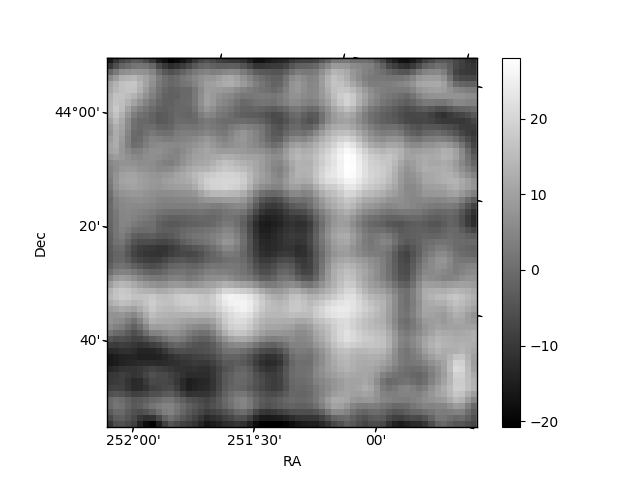
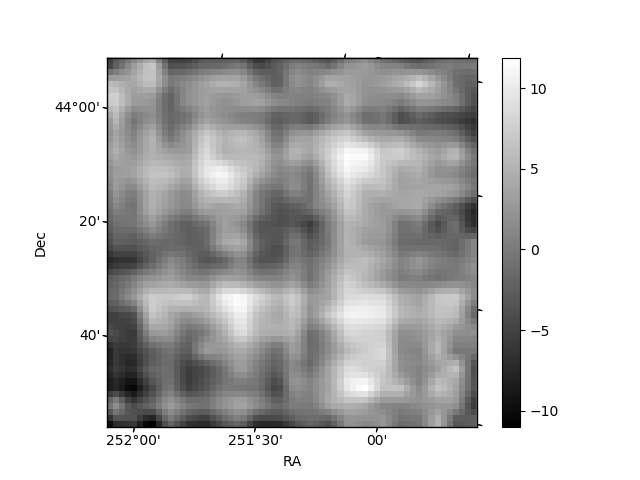
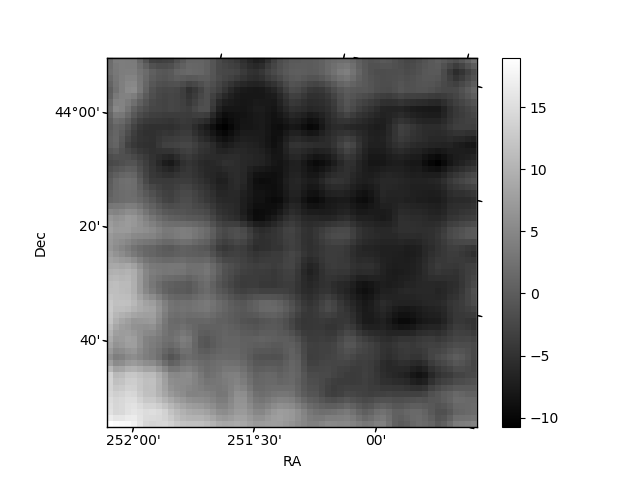
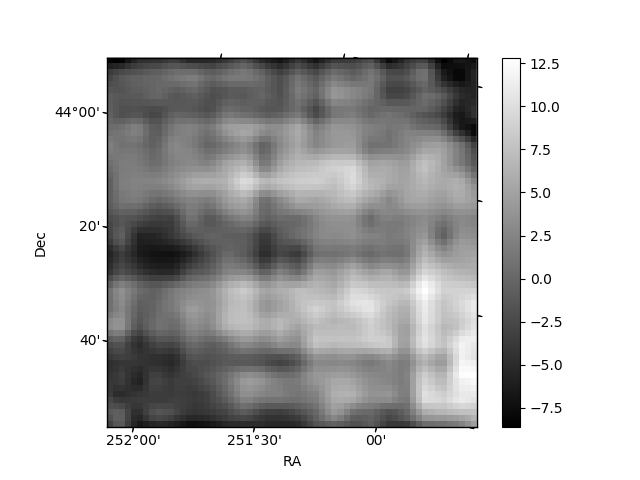
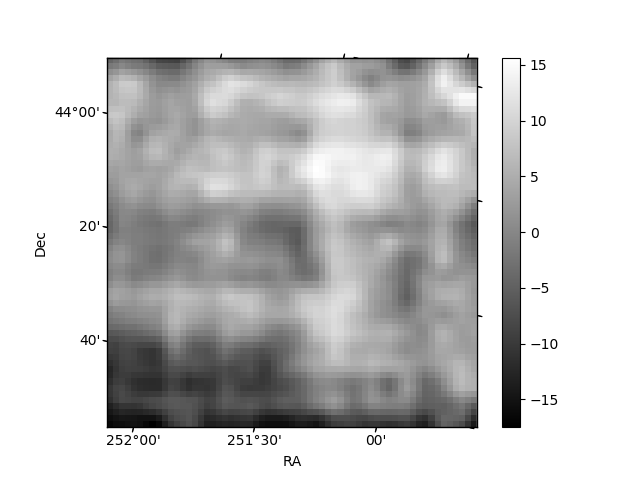
Histogram calculated using DETX and DETY for each event in the final _common_clean file
| Quadrant A | 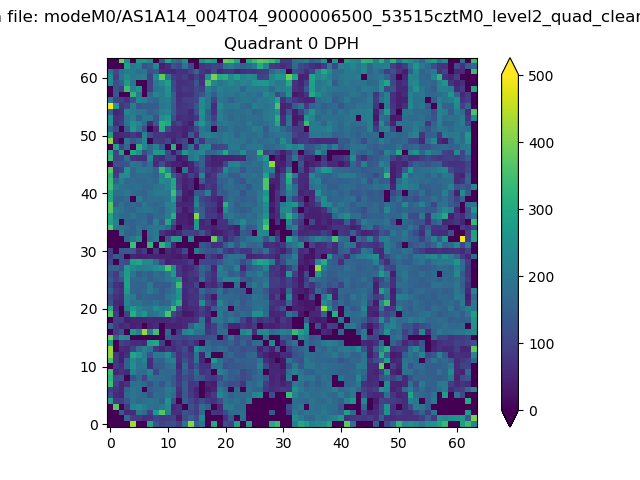 |
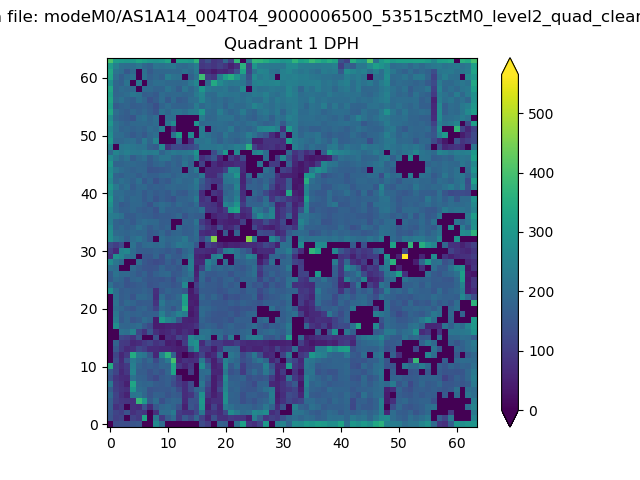 |
Quadrant B |
|---|---|---|---|
| Quadrant D | 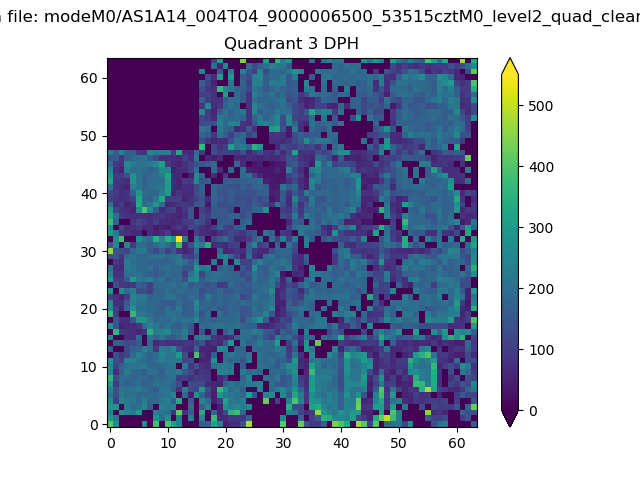 |
 |
Quadrant C |
| Plot type | Count rate plots | Images |
|---|---|---|
| Comparison with Poisson distribution Blue bars denote a histogram of data divided into 1 sec bins. Red curve is a Poisson curve with rate = median count rate of data. |
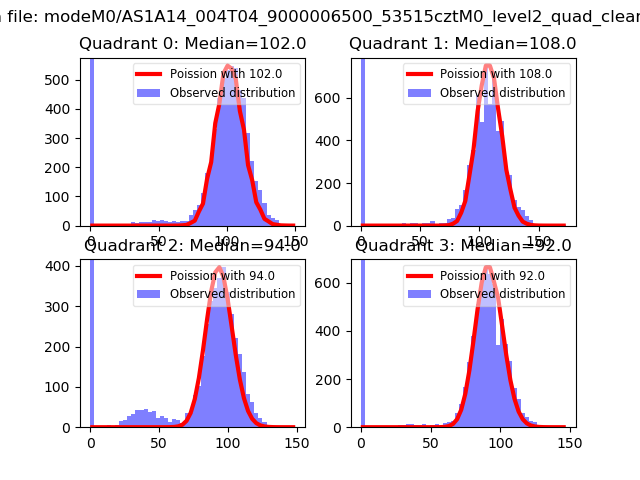 |
 |
| Quadrant-wise count rates Data is divided into 100 sec bins |
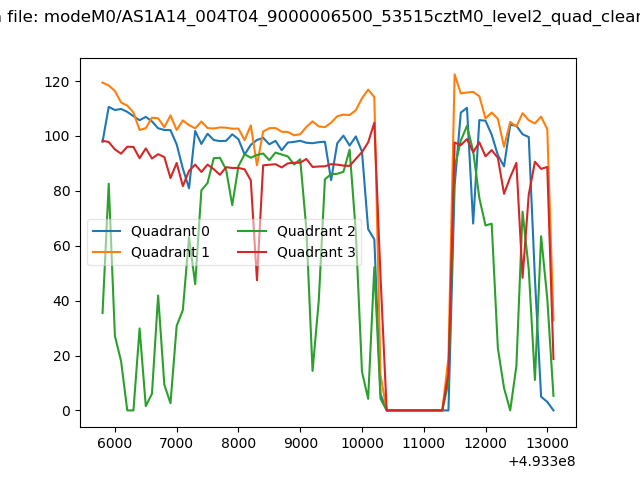 |
|
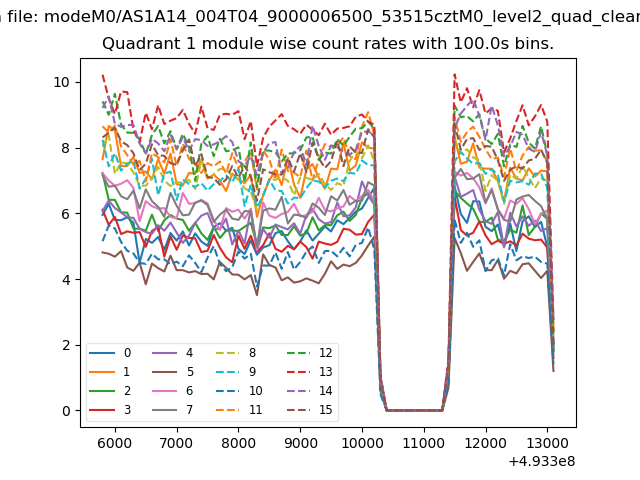
| Module-wise count rates for Quadrant A Data is divided into 100 sec bins |
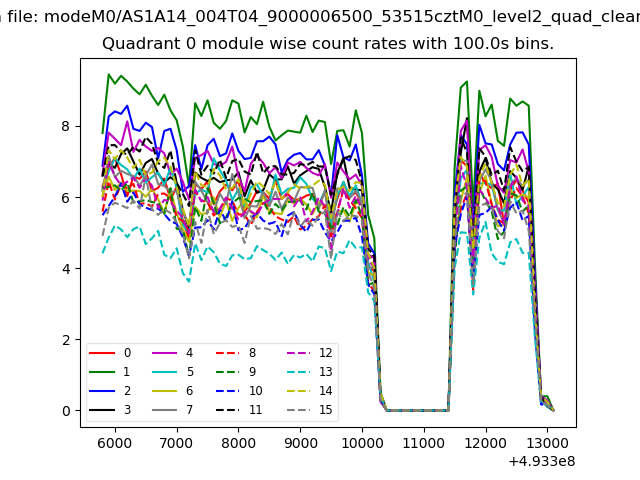 |
 |
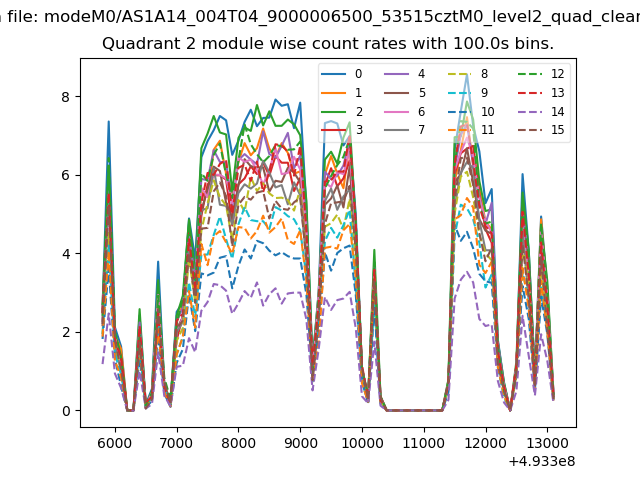
| Module-wise count rates for Quadrant B Data is divided into 100 sec bins |
 |
 |
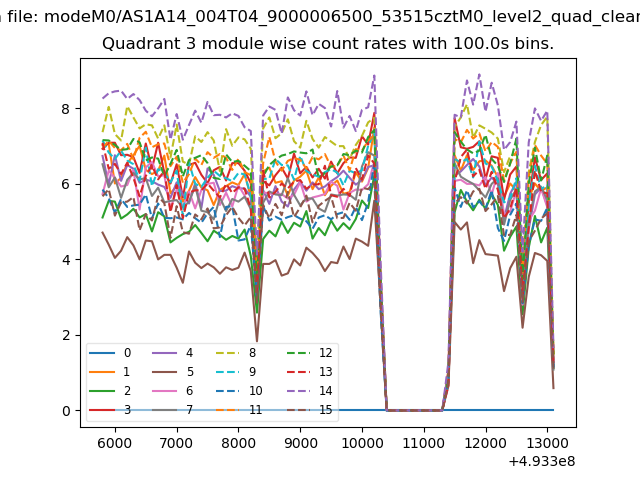
| Module-wise count rates for Quadrant C Data is divided into 100 sec bins |
 |
 |
| Module-wise count rates for Quadrant D Data is divided into 100 sec bins |
 |
 |
| Parameter | Plot |
|---|---|
| CZT HV Monitor |  |
| D_VDD | 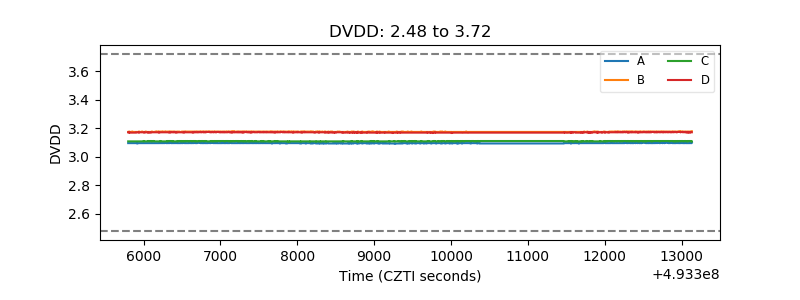 |
| Temperature 1 | 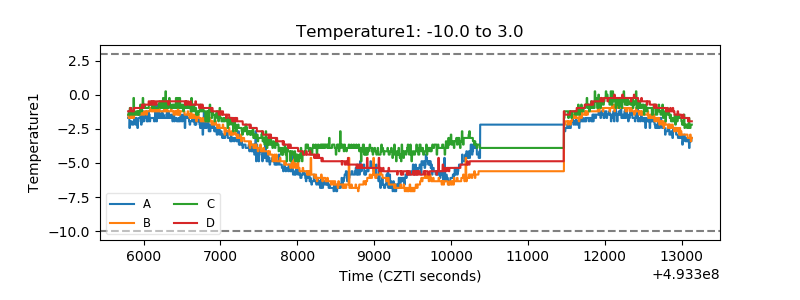 |
| Veto HV Monitor | 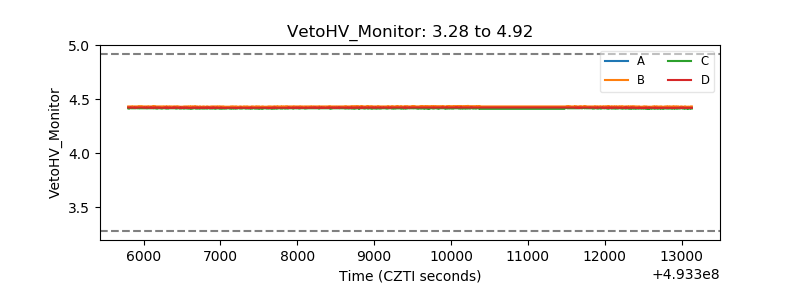 |
| Veto LLD | 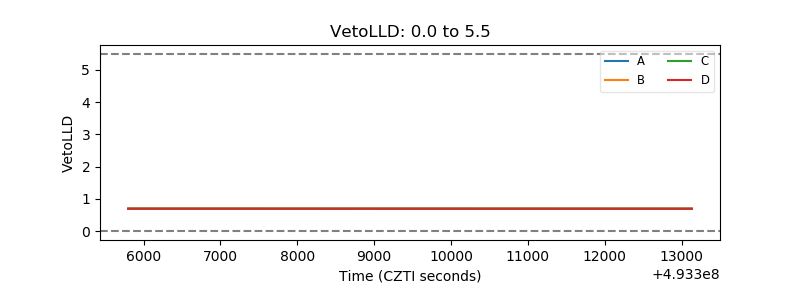 |
| Alpha Counter | 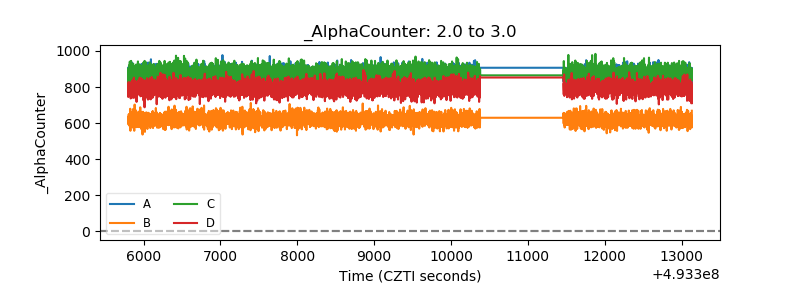 |
| _CPM_Rate | 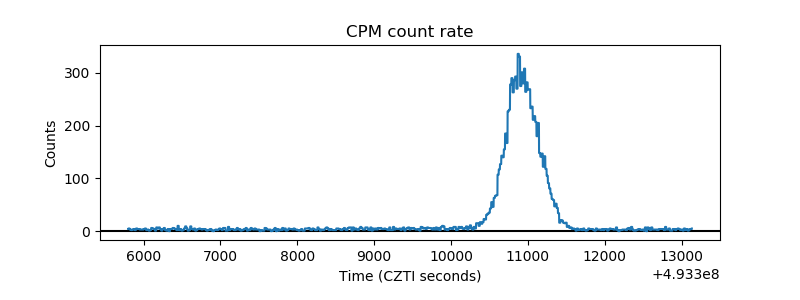 |
| CZT Counter | 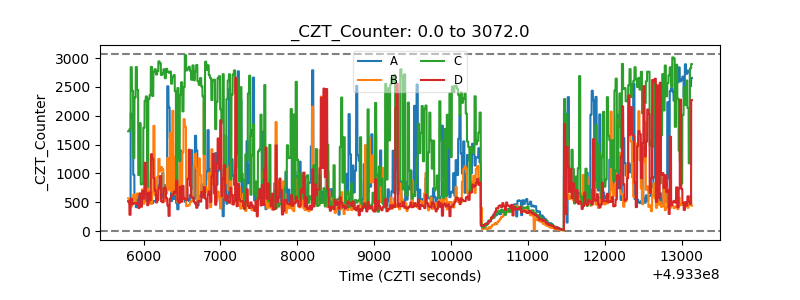 |
| +2.5 Volts monitor |  |
| +5 Volts monitor |  |
| _ROLL_ROT | 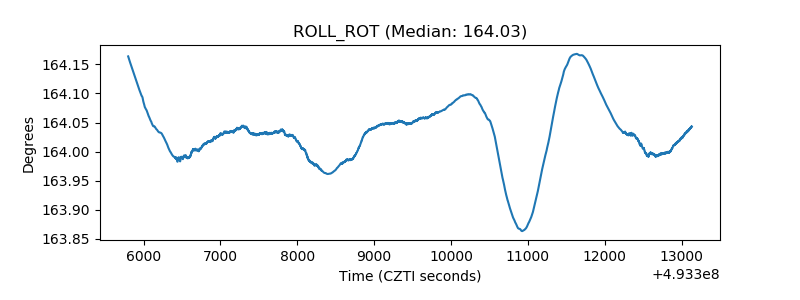 |
| _Roll_DEC | 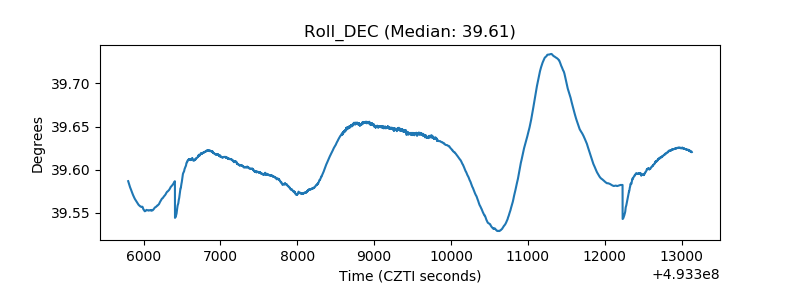 |
| _Roll_RA | 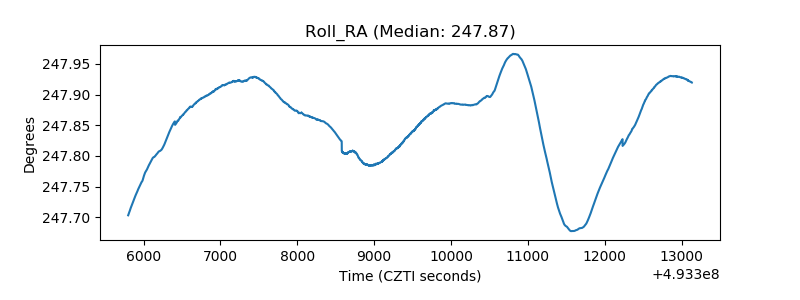 |
| Veto Counter | 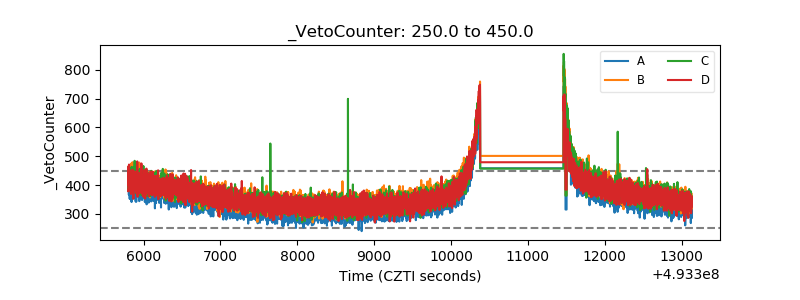 |