| Param | Original file | Final file |
|---|---|---|
| Filename | modeM0/AS1A14_004T04_9000006500_53517cztM0_level2.fits | modeM0/AS1A14_004T04_9000006500_53517cztM0_level2_quad_clean.evt |
| Size (bytes) | 791,858,880 | 95,500,800 |
| Size | 755.2 MB | 91.1 MB |
| Events in quadrant A | 7,766,751 | 621,609 |
| Events in quadrant B | 6,221,270 | 663,247 |
| Events in quadrant C | 9,545,671 | 502,273 |
| Events in quadrant D | 5,225,769 | 606,429 |
| Mode SS | |||
|---|---|---|---|
| Quadrant | BADHDUFLAG | Total packets | Discarded packets |
| A | 0 | 144 | 0 |
| B | 0 | 144 | 0 |
| C | 0 | 144 | 0 |
| D | 0 | 144 | 0 |
| Mode M0 | |||
|---|---|---|---|
| Quadrant | BADHDUFLAG | Total packets | Discarded packets |
| A | 0 | 28054 | 2 |
| B | 0 | 23475 | 1 |
| C | 0 | 33311 | 1 |
| D | 0 | 20567 | 1 |
| Mode M9 | |||
|---|---|---|---|
| Quadrant | BADHDUFLAG | Total packets | Discarded packets |
| A | 0 | 5 | 0 |
| B | 0 | 5 | 0 |
| C | 0 | 5 | 0 |
| D | 0 | 5 | 0 |
| Quadrant | Total seconds | Saturated seconds | Saturation percentage |
|---|---|---|---|
| A | 7150 | 949 | 13.272727% |
| B | 7150 | 866 | 12.111888% |
| C | 7151 | 2090 | 29.226682% |
| D | 7151 | 358 | 5.006293% |
Noise dominated data is calculated using 1-second bins in cleaned event files. If a bin has >2000 counts, and if more than 50% of those come from <1% of pixels, then it is considered to be noise-dominated and hence unusable.
| Quadrant | # 1 sec bins | Bins with >0 counts | Bins with >2000 counts | High rate bins dominated by noise | Noise dominated (total time) | Noise dominated (detector-on time) | Marked lightcurve |
|---|---|---|---|---|---|---|---|
| A | 7615 | 7151 | 703 | 703 | 9.23% | 9.83% | 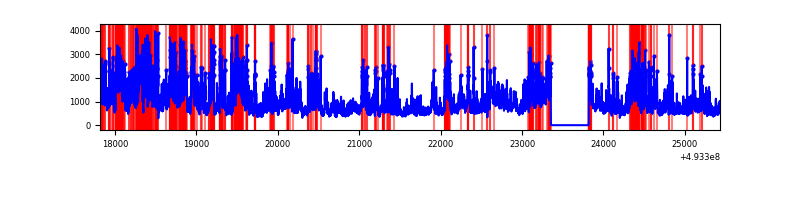 |
| B | 7615 | 7151 | 727 | 727 | 9.55% | 10.17% |  |
| C | 7616 | 7152 | 1561 | 1561 | 20.50% | 21.83% | 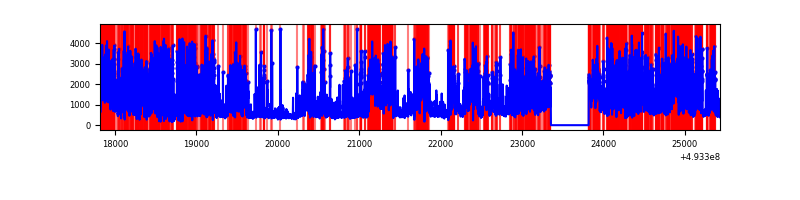 |
| D | 7616 | 7152 | 290 | 290 | 3.81% | 4.05% | 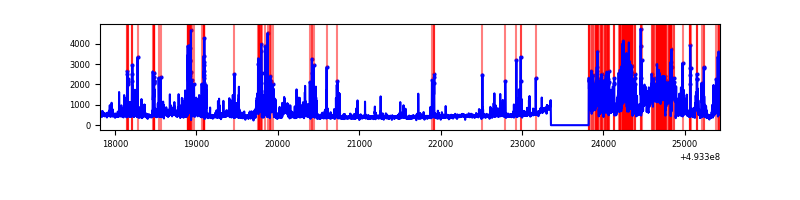 |
Top three noisy pixels from each quadrant. If the there are fewer than three noisy pixels in the level2.evt file, extra rows are filled as -1
| Pixel properties | Quadrant properties | ||||||
|---|---|---|---|---|---|---|---|
| Quadrant | DetID | PixID | Counts | Sigma | Mean | Median | Sigma |
| A | 3 | 62 | 2263392 | 12154.8 | 748 | 728 | 186.2 |
| A | 3 | 63 | 1938853 | 10411.41 | 748 | 728 | 186.2 |
| A | 15 | 174 | 297092 | 1592.04 | 748 | 728 | 186.2 |
| B | 5 | 172 | 1914635 | 12095.48 | 747 | 722 | 158.2 |
| B | 4 | 171 | 596729 | 3766.62 | 747 | 722 | 158.2 |
| B | 5 | 185 | 221097 | 1392.72 | 747 | 722 | 158.2 |
| C | 15 | 224 | 2567893 | 13813.62 | 667 | 659 | 185.8 |
| C | 1 | 241 | 1179070 | 6340.72 | 667 | 659 | 185.8 |
| C | 7 | 64 | 1050181 | 5647.2 | 667 | 659 | 185.8 |
| D | 2 | 249 | 737476 | 3395.72 | 754 | 720 | 217.0 |
| D | 2 | 153 | 477311 | 2196.62 | 754 | 720 | 217.0 |
| D | 2 | 120 | 242666 | 1115.13 | 754 | 720 | 217.0 |
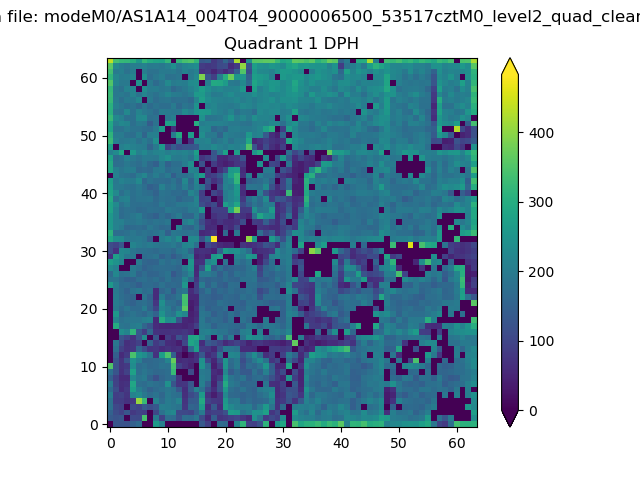
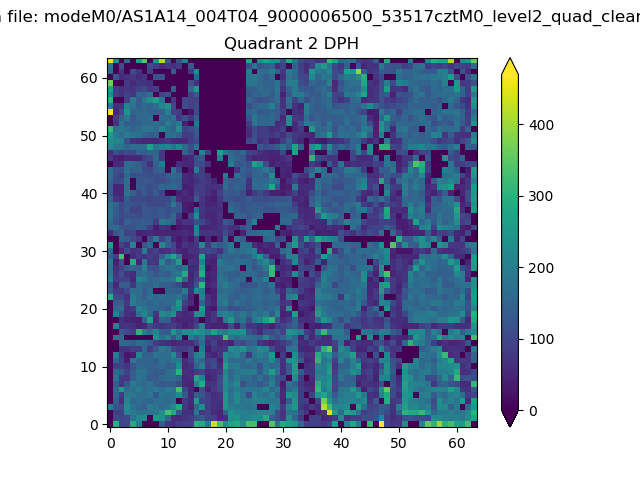
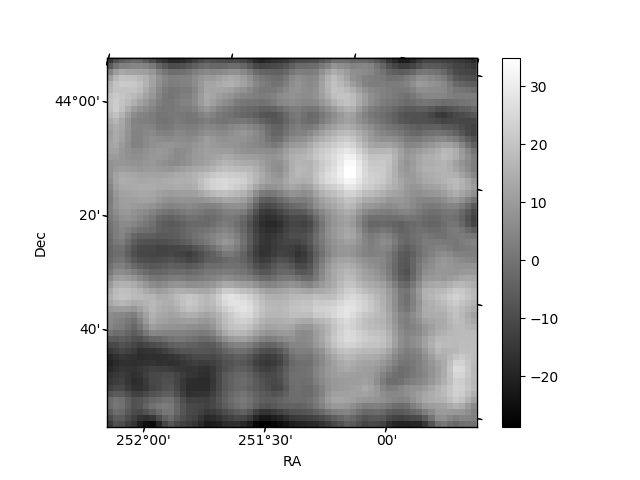
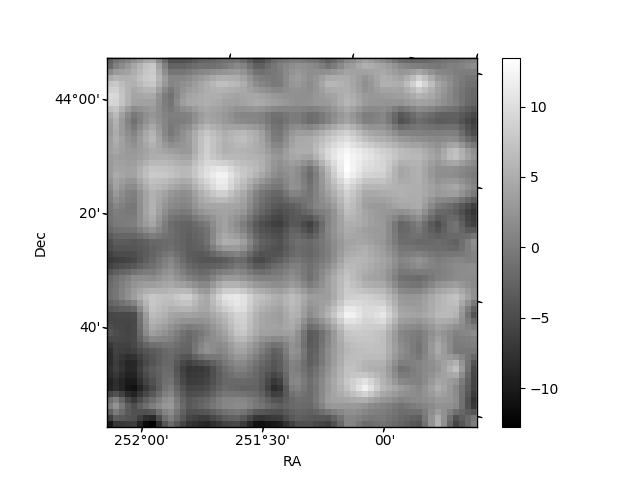
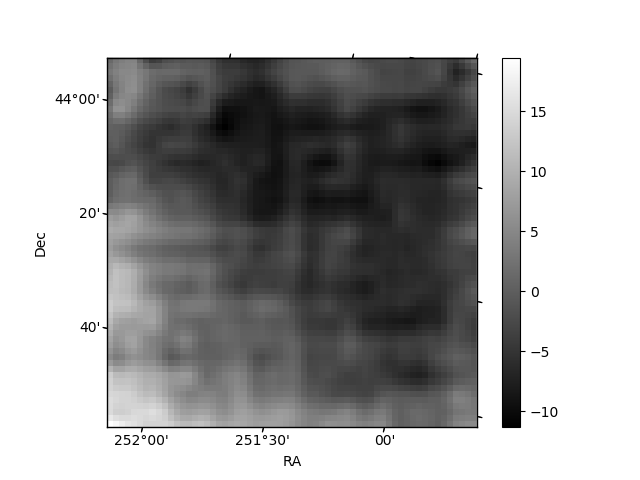
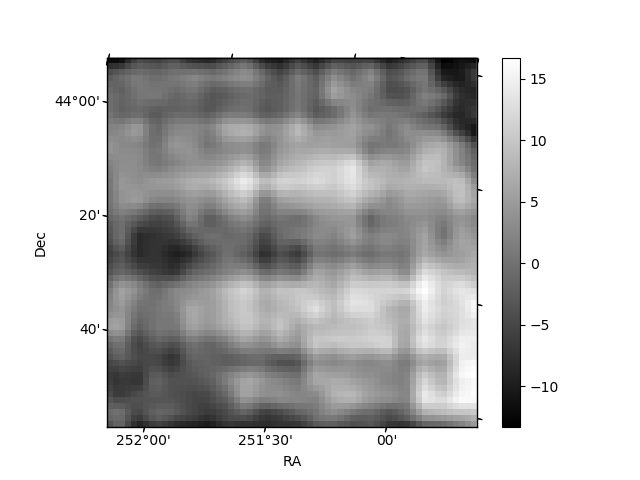
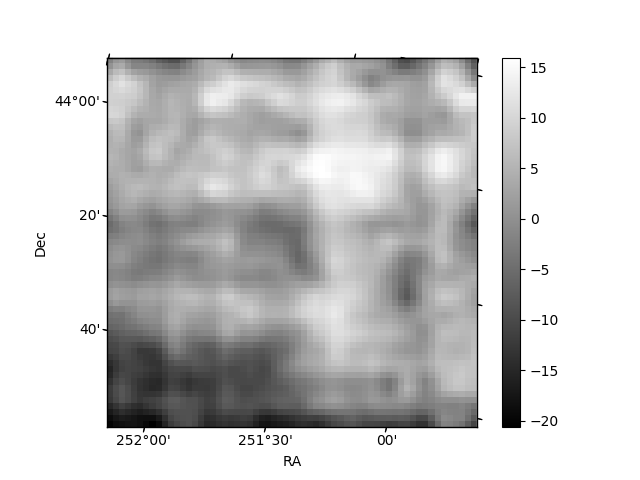
Histogram calculated using DETX and DETY for each event in the final _common_clean file
| Quadrant A | 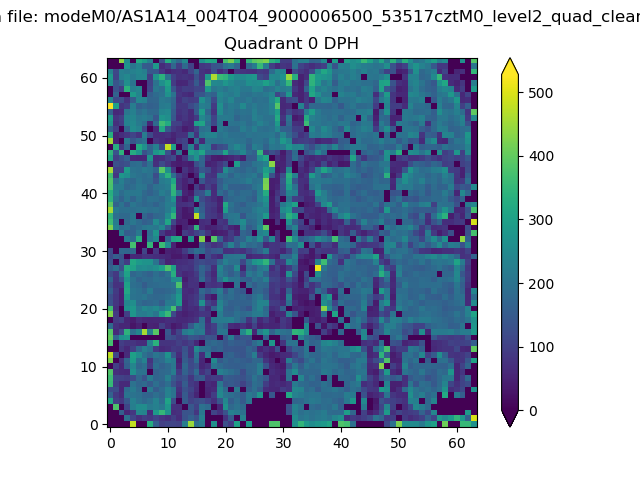 |
 |
Quadrant B |
|---|---|---|---|
| Quadrant D | 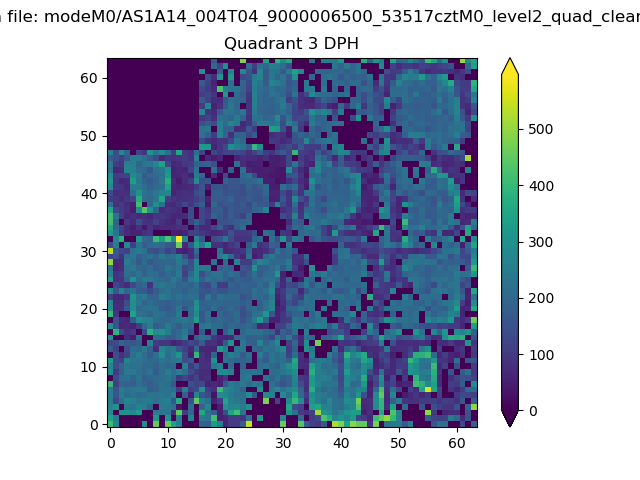 |
 |
Quadrant C |
| Plot type | Count rate plots | Images |
|---|---|---|
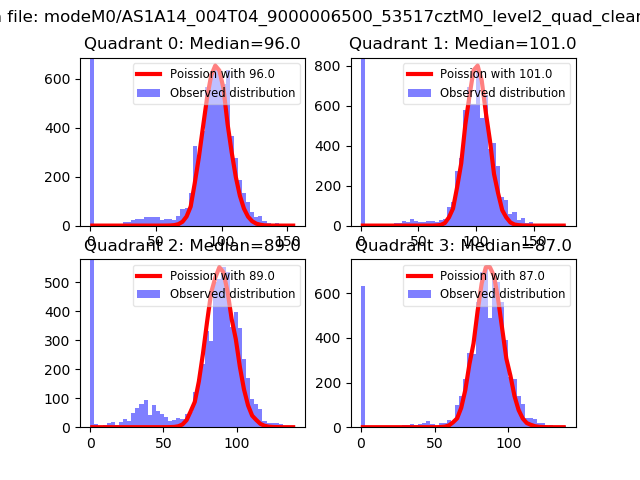
| Comparison with Poisson distribution Blue bars denote a histogram of data divided into 1 sec bins. Red curve is a Poisson curve with rate = median count rate of data. |
 |
 |
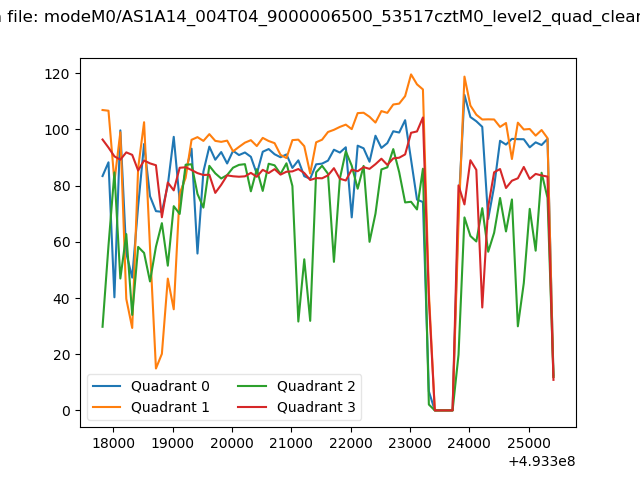
| Quadrant-wise count rates Data is divided into 100 sec bins |
 |
|
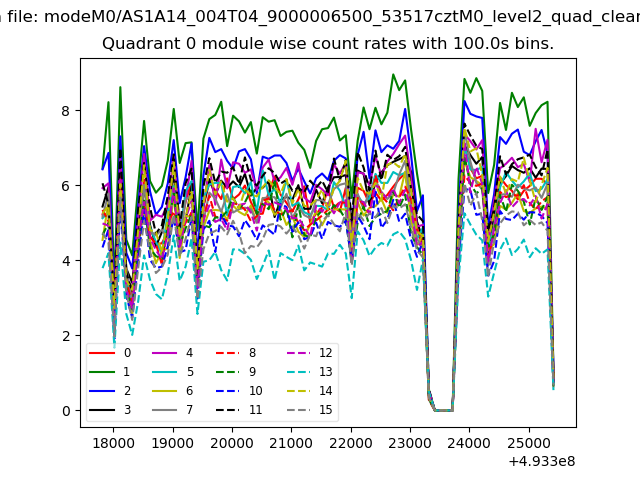
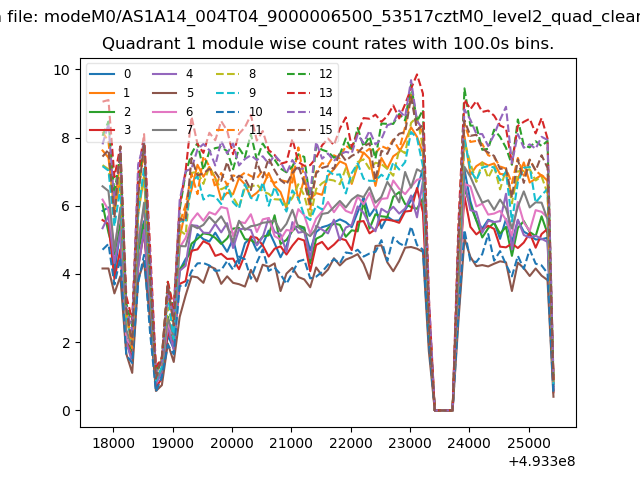
| Module-wise count rates for Quadrant A Data is divided into 100 sec bins |
 |
 |
| Module-wise count rates for Quadrant B Data is divided into 100 sec bins |
 |
 |
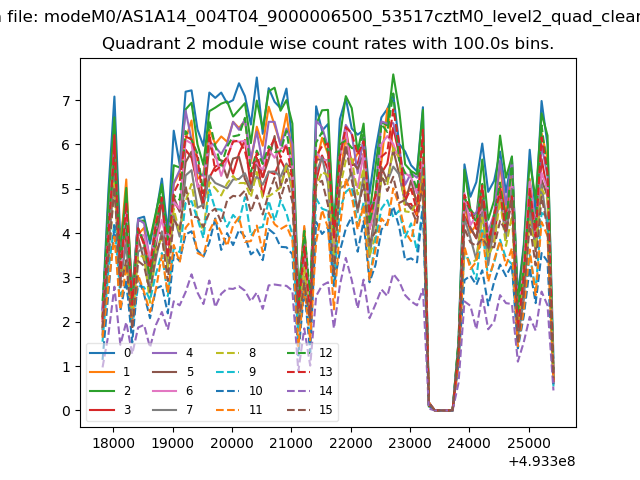
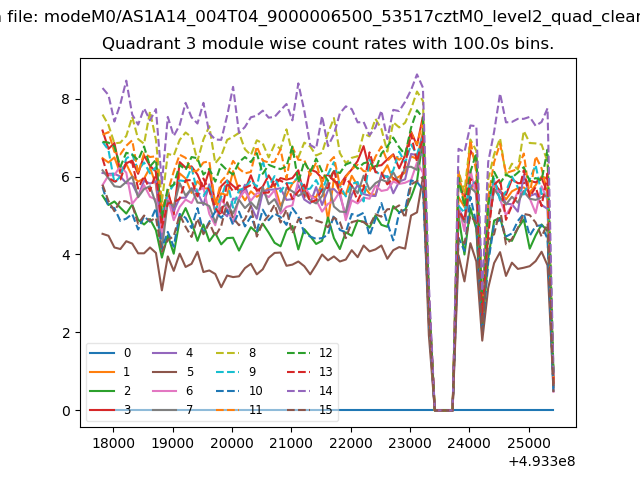
| Module-wise count rates for Quadrant C Data is divided into 100 sec bins |
 |
 |
| Module-wise count rates for Quadrant D Data is divided into 100 sec bins |
 |
 |
| Parameter | Plot |
|---|---|
| CZT HV Monitor | 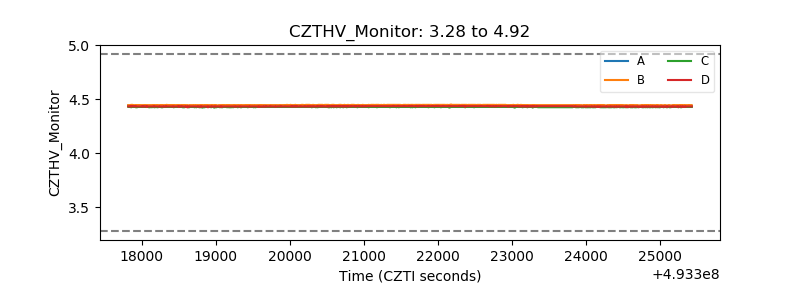 |
| D_VDD | 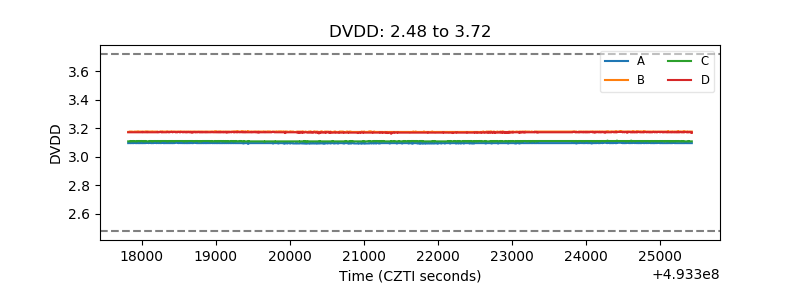 |
| Temperature 1 | 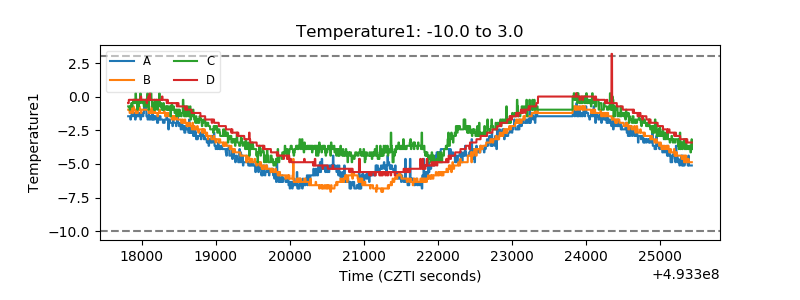 |
| Veto HV Monitor | 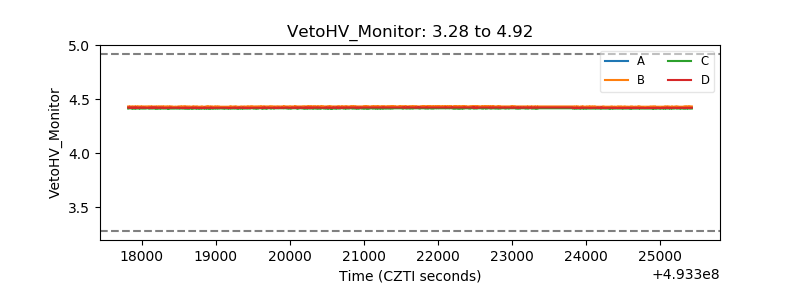 |
| Veto LLD | 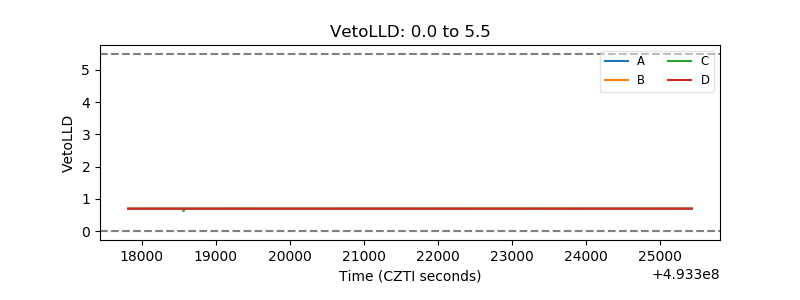 |
| Alpha Counter | 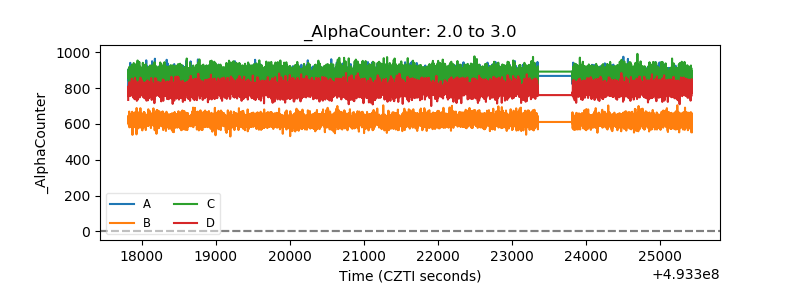 |
| _CPM_Rate | 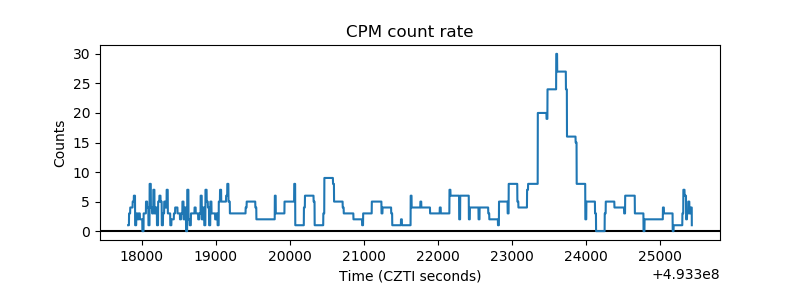 |
| CZT Counter | 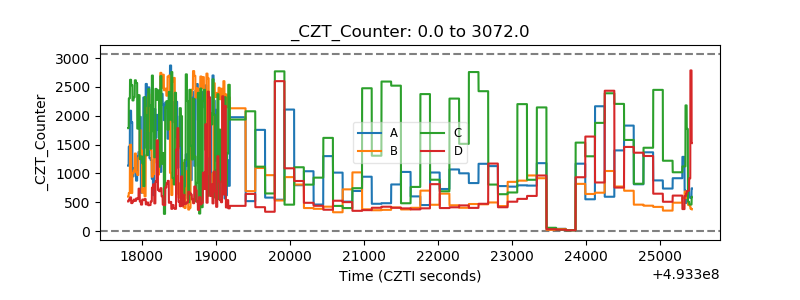 |
| +2.5 Volts monitor |  |
| +5 Volts monitor |  |
| _ROLL_ROT | 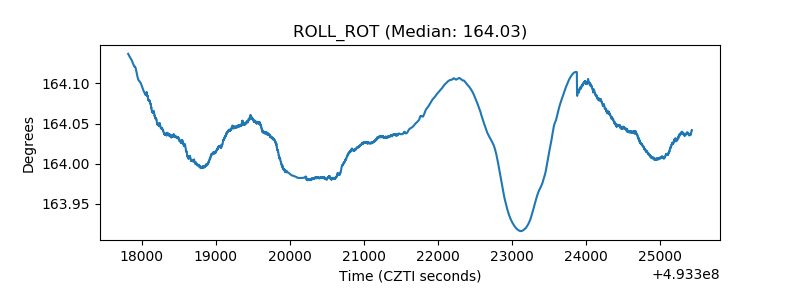 |
| _Roll_DEC | 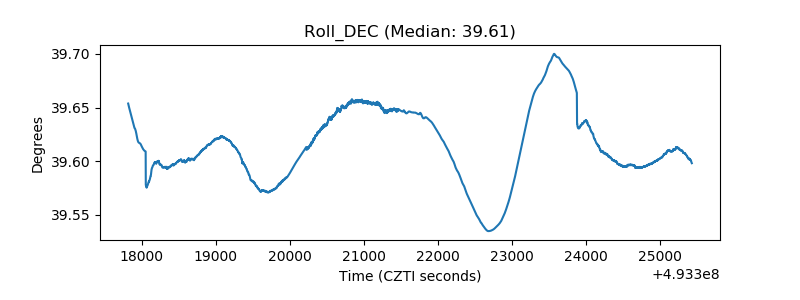 |
| _Roll_RA | 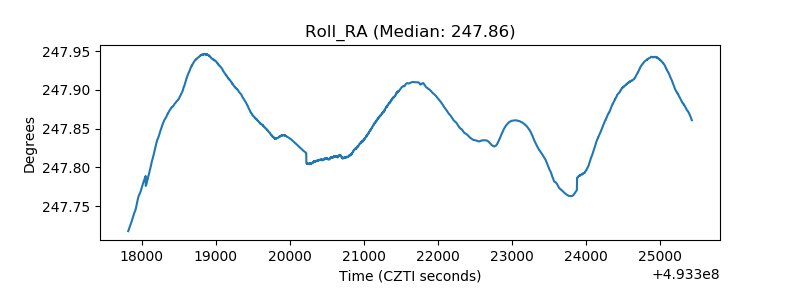 |
| Veto Counter | 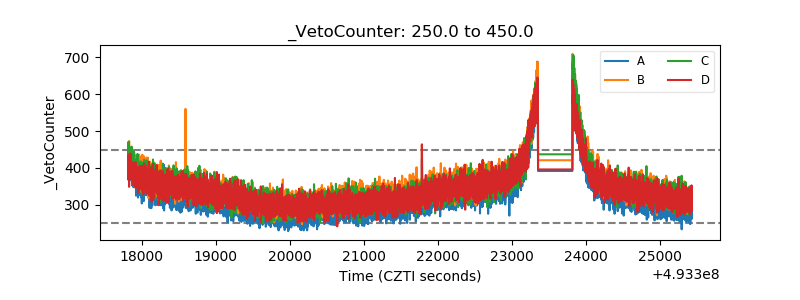 |