| Param | Original file | Final file |
|---|---|---|
| Filename | modeM0/AS1A14_004T04_9000006500_53518cztM0_level2.fits | modeM0/AS1A14_004T04_9000006500_53518cztM0_level2_quad_clean.evt |
| Size (bytes) | 749,024,640 | 110,234,880 |
| Size | 714.3 MB | 105.1 MB |
| Events in quadrant A | 6,379,581 | 773,128 |
| Events in quadrant B | 4,583,481 | 816,089 |
| Events in quadrant C | 9,356,772 | 562,384 |
| Events in quadrant D | 6,818,073 | 656,612 |
| Mode SS | |||
|---|---|---|---|
| Quadrant | BADHDUFLAG | Total packets | Discarded packets |
| A | 0 | 152 | 0 |
| B | 0 | 152 | 0 |
| C | 0 | 152 | 0 |
| D | 0 | 152 | 0 |
| Mode M0 | |||
|---|---|---|---|
| Quadrant | BADHDUFLAG | Total packets | Discarded packets |
| A | 0 | 24234 | 0 |
| B | 0 | 18968 | 0 |
| C | 0 | 33101 | 2 |
| D | 0 | 25733 | 0 |
| Quadrant | Total seconds | Saturated seconds | Saturation percentage |
|---|---|---|---|
| A | 7611 | 364 | 4.782552% |
| B | 7611 | 140 | 1.839443% |
| C | 7611 | 1786 | 23.466036% |
| D | 7611 | 687 | 9.026409% |
Noise dominated data is calculated using 1-second bins in cleaned event files. If a bin has >2000 counts, and if more than 50% of those come from <1% of pixels, then it is considered to be noise-dominated and hence unusable.
| Quadrant | # 1 sec bins | Bins with >0 counts | Bins with >2000 counts | High rate bins dominated by noise | Noise dominated (total time) | Noise dominated (detector-on time) | Marked lightcurve |
|---|---|---|---|---|---|---|---|
| A | 7611 | 7611 | 296 | 296 | 3.89% | 3.89% | 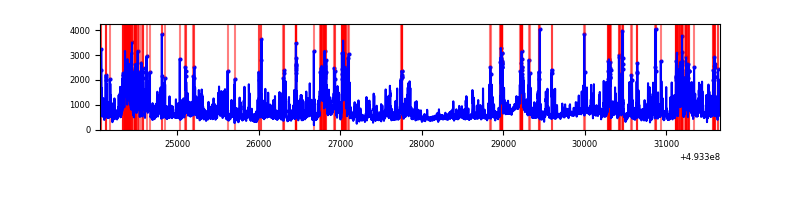 |
| B | 7611 | 7611 | 64 | 64 | 0.84% | 0.84% | 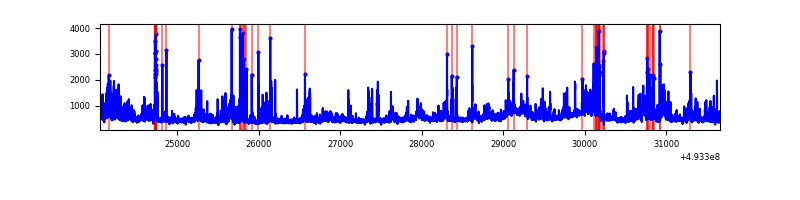 |
| C | 7611 | 7611 | 1415 | 1415 | 18.59% | 18.59% | 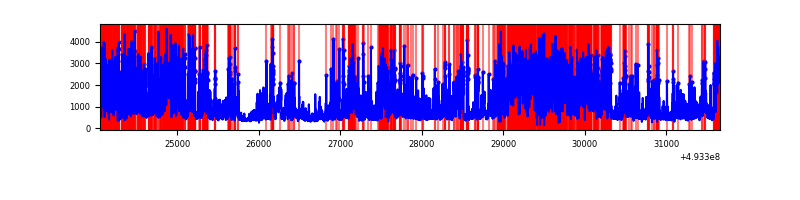 |
| D | 7611 | 7611 | 682 | 682 | 8.96% | 8.96% | 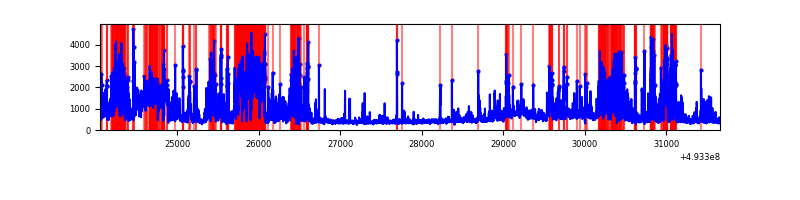 |
Top three noisy pixels from each quadrant. If the there are fewer than three noisy pixels in the level2.evt file, extra rows are filled as -1
| Pixel properties | Quadrant properties | ||||||
|---|---|---|---|---|---|---|---|
| Quadrant | DetID | PixID | Counts | Sigma | Mean | Median | Sigma |
| A | 3 | 62 | 1254391 | 5938.37 | 835 | 816 | 211.1 |
| A | 3 | 63 | 983505 | 4655.14 | 835 | 816 | 211.1 |
| A | 15 | 174 | 516090 | 2440.93 | 835 | 816 | 211.1 |
| B | 10 | 28 | 252613 | 1426.2 | 827 | 799 | 176.6 |
| B | 5 | 172 | 170596 | 961.68 | 827 | 799 | 176.6 |
| B | 2 | 249 | 119416 | 671.81 | 827 | 799 | 176.6 |
| C | 15 | 224 | 2691722 | 13340.01 | 724 | 719 | 201.7 |
| C | 1 | 241 | 2051792 | 10167.71 | 724 | 719 | 201.7 |
| C | 7 | 64 | 498761 | 2468.93 | 724 | 719 | 201.7 |
| D | 2 | 249 | 1666719 | 7155.65 | 802 | 767 | 232.8 |
| D | 2 | 153 | 635356 | 2725.71 | 802 | 767 | 232.8 |
| D | 10 | 1 | 448659 | 1923.8 | 802 | 767 | 232.8 |
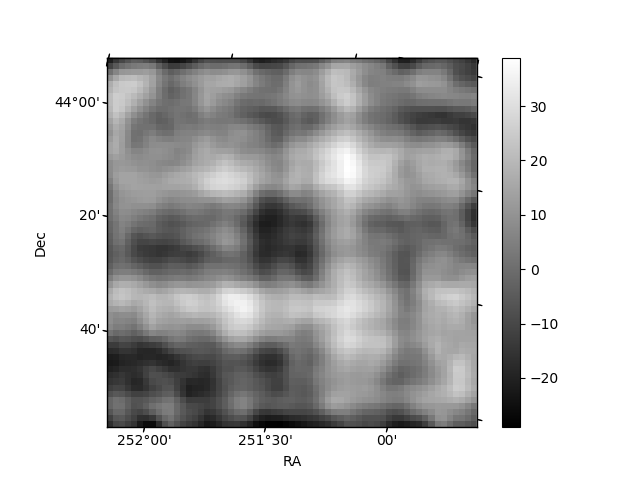
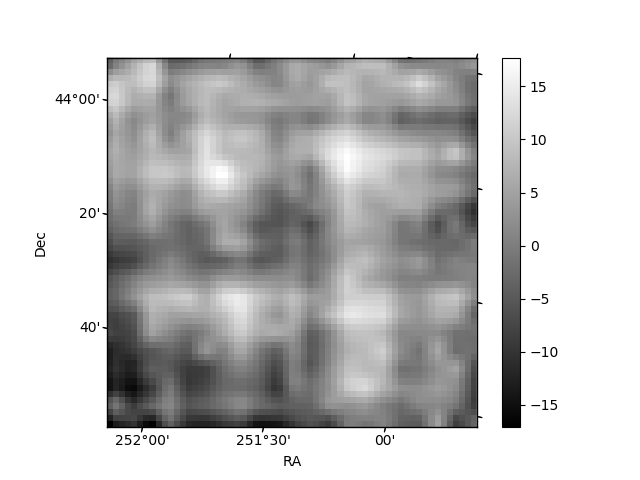
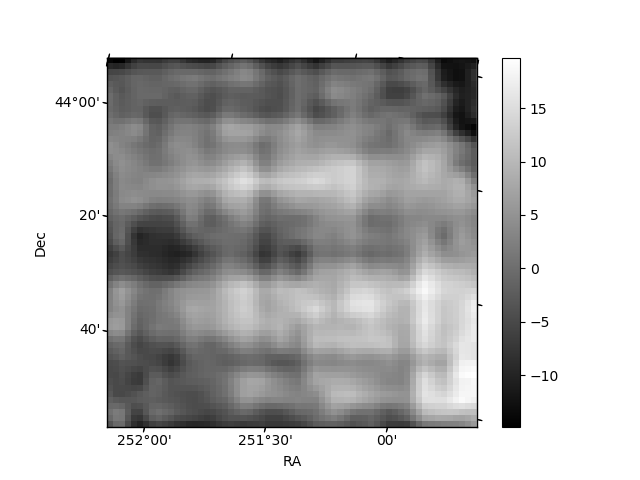
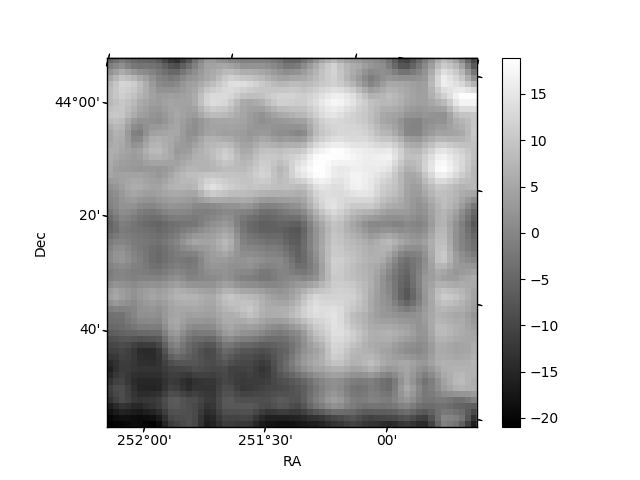
Histogram calculated using DETX and DETY for each event in the final _common_clean file
| Quadrant A | 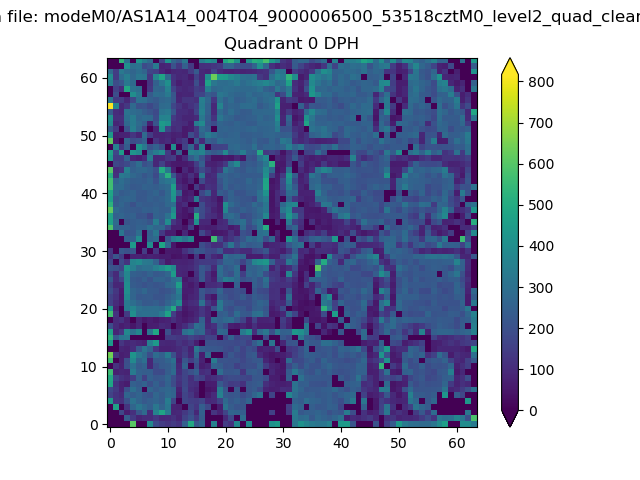 |
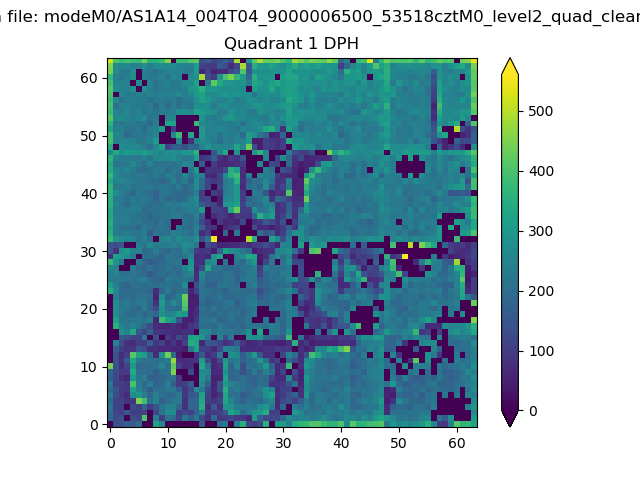 |
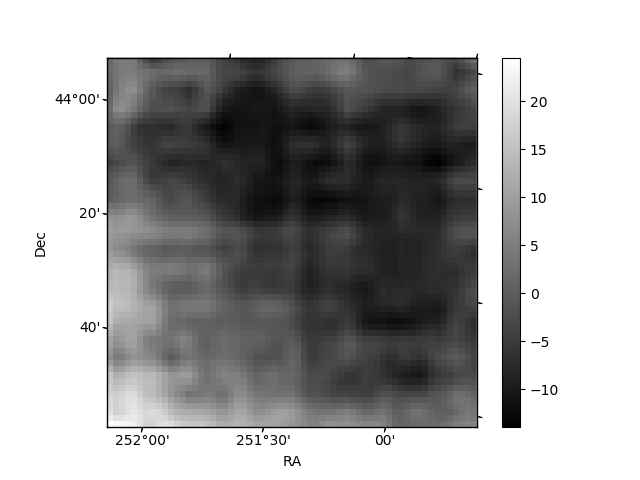
Quadrant B |
|---|---|---|---|
| Quadrant D | 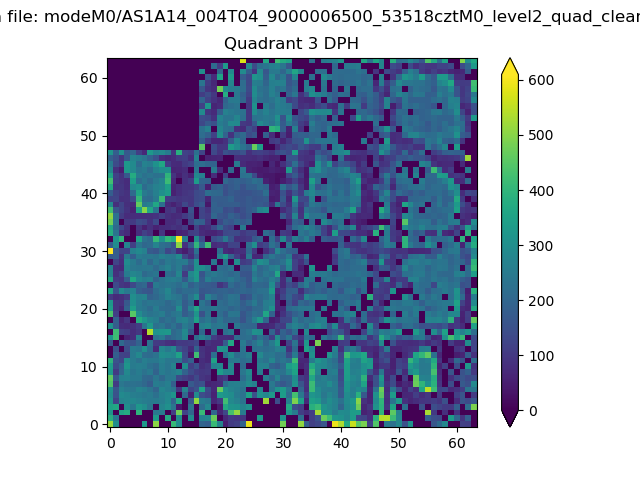 |
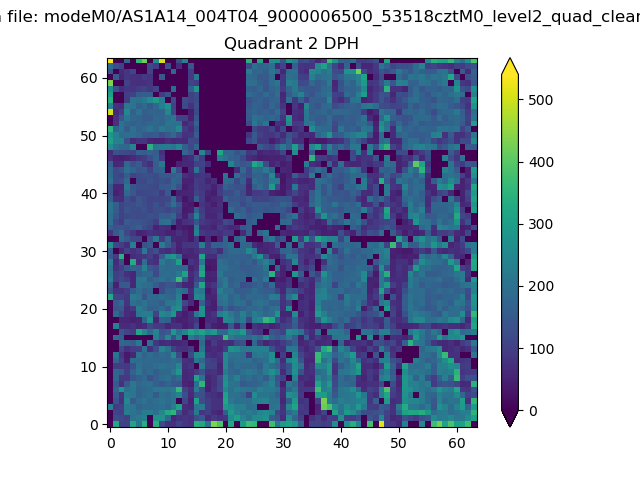 |
Quadrant C |
| Plot type | Count rate plots | Images |
|---|---|---|
| Comparison with Poisson distribution Blue bars denote a histogram of data divided into 1 sec bins. Red curve is a Poisson curve with rate = median count rate of data. |
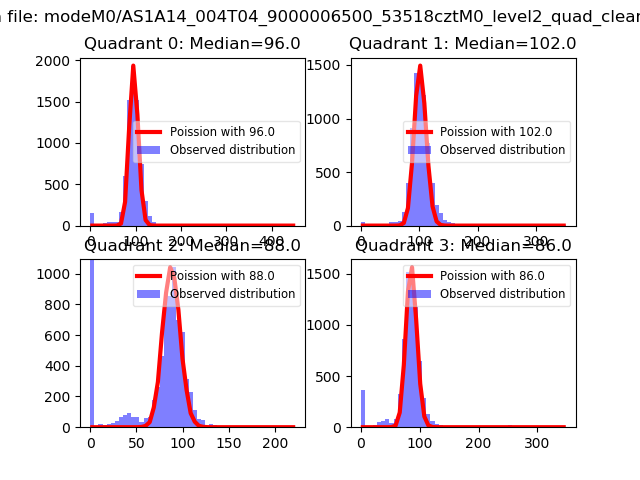 |
 |
| Quadrant-wise count rates Data is divided into 100 sec bins |
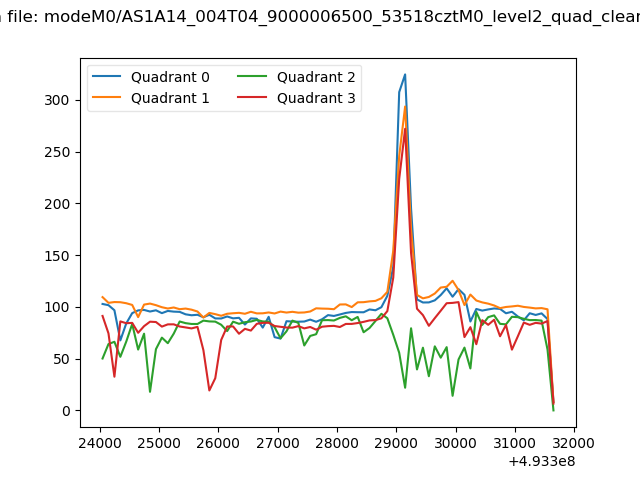 |
|
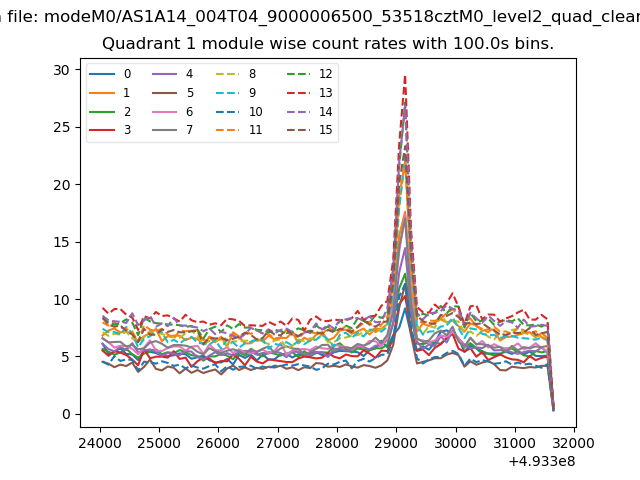
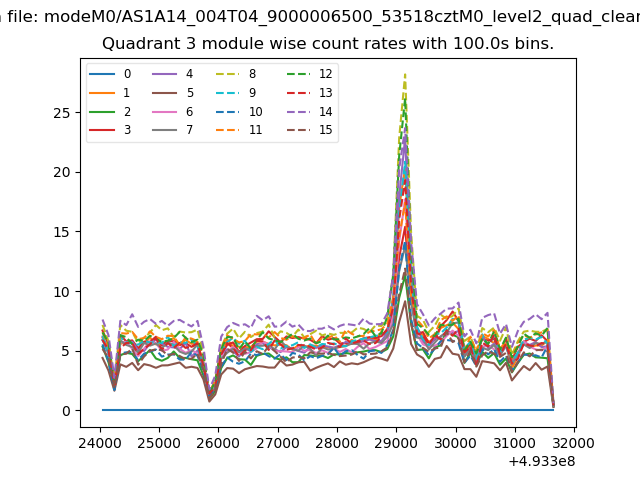
| Module-wise count rates for Quadrant A Data is divided into 100 sec bins |
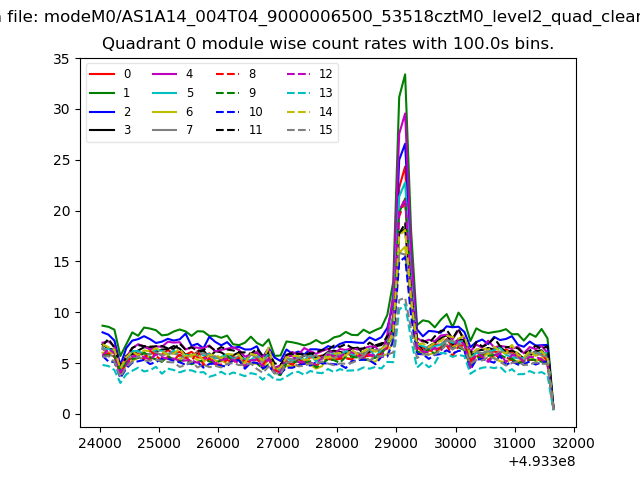 |
 |
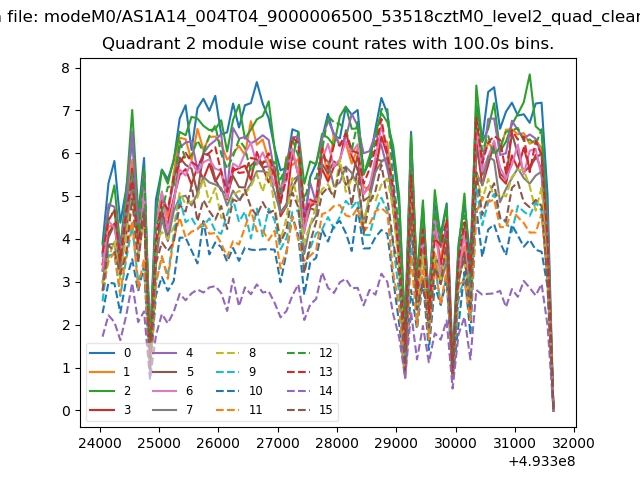
| Module-wise count rates for Quadrant B Data is divided into 100 sec bins |
 |
 |
| Module-wise count rates for Quadrant C Data is divided into 100 sec bins |
 |
 |
| Module-wise count rates for Quadrant D Data is divided into 100 sec bins |
 |
 |
| Parameter | Plot |
|---|---|
| CZT HV Monitor | 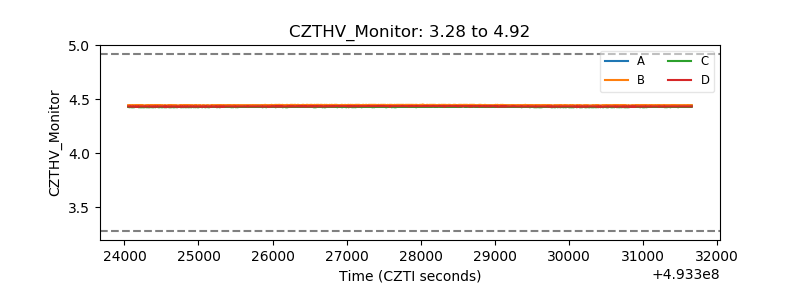 |
| D_VDD | 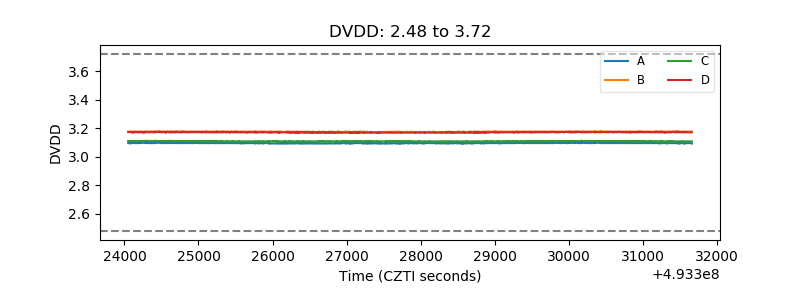 |
| Temperature 1 | 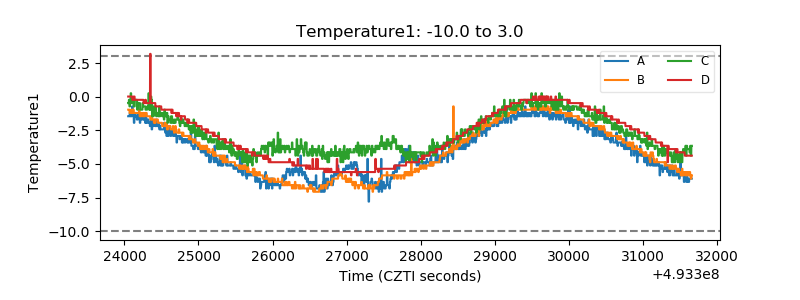 |
| Veto HV Monitor | 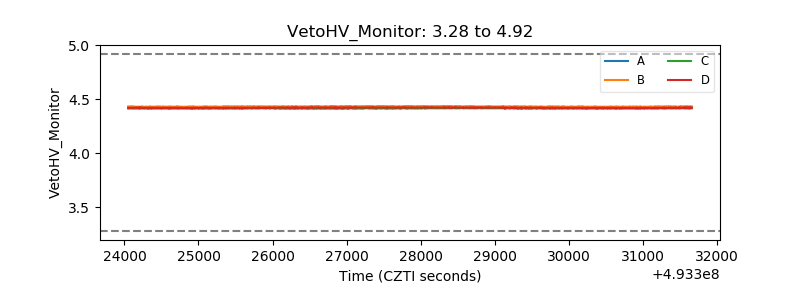 |
| Veto LLD | 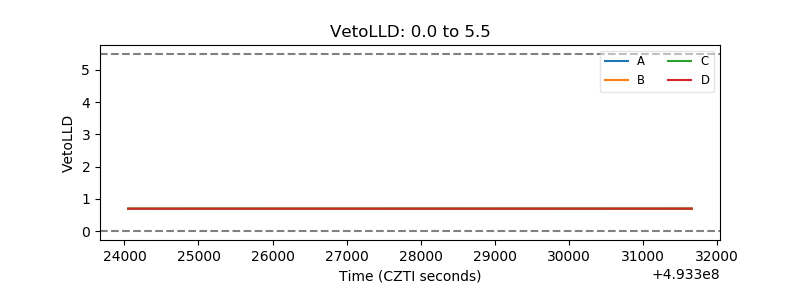 |
| Alpha Counter | 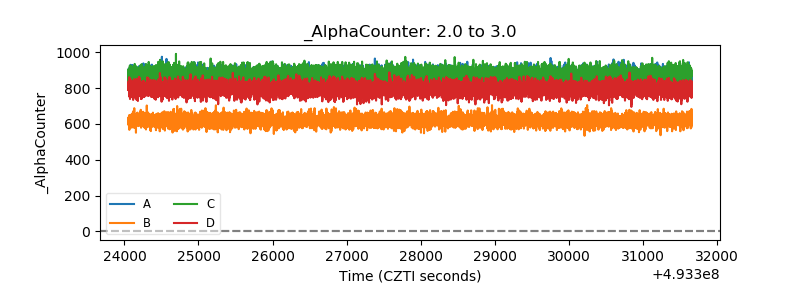 |
| _CPM_Rate | 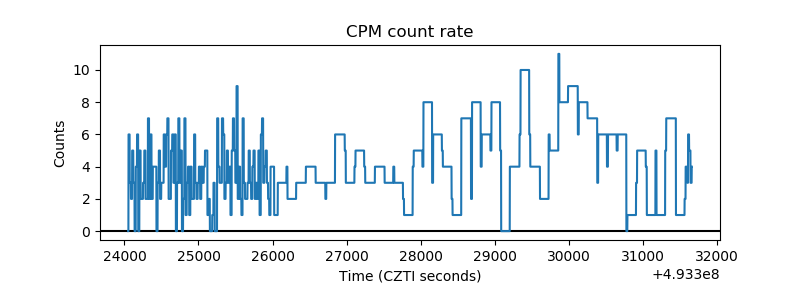 |
| CZT Counter | 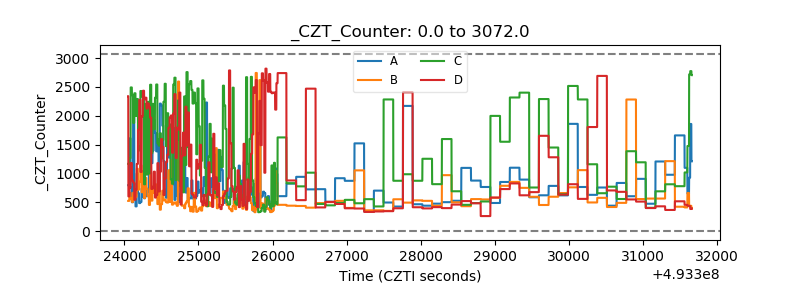 |
| +2.5 Volts monitor | 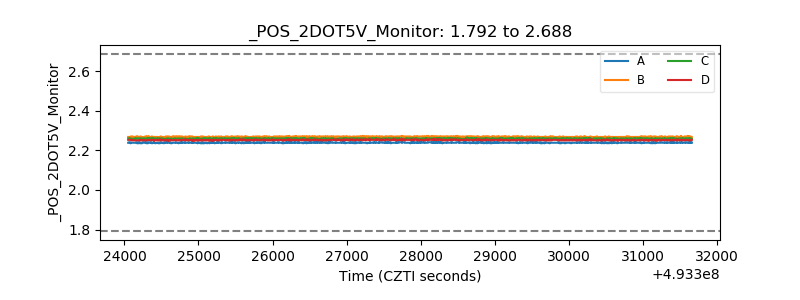 |
| +5 Volts monitor |  |
| _ROLL_ROT | 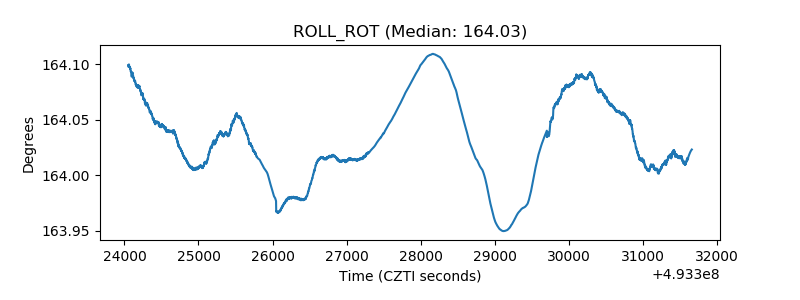 |
| _Roll_DEC | 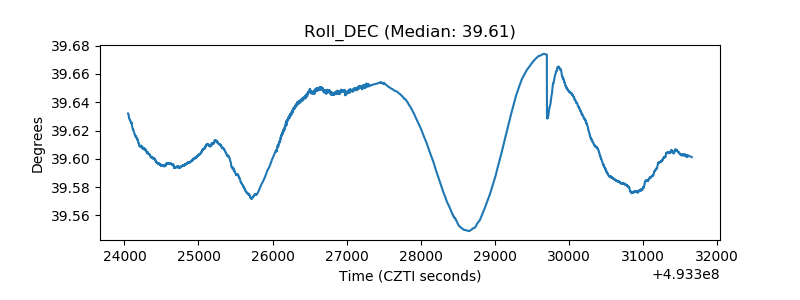 |
| _Roll_RA | 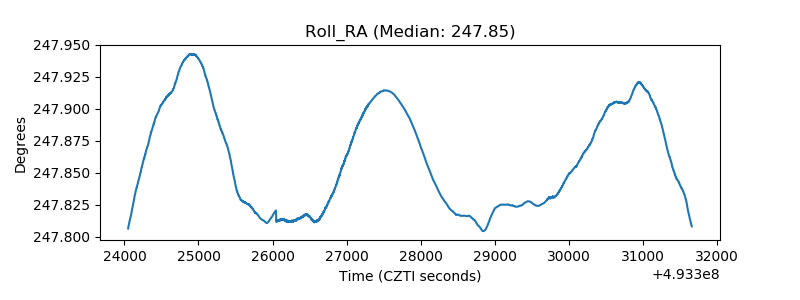 |
| Veto Counter | 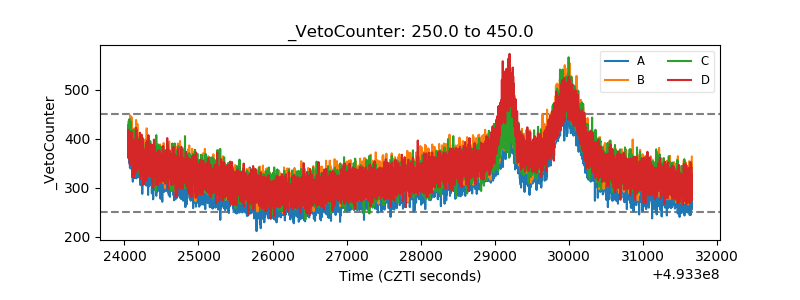 |