| Param | Original file | Final file |
|---|---|---|
| Filename | modeM0/AS1A14_004T04_9000006500_53519cztM0_level2.fits | modeM0/AS1A14_004T04_9000006500_53519cztM0_level2_quad_clean.evt |
| Size (bytes) | 872,801,280 | 103,501,440 |
| Size | 832.4 MB | 98.7 MB |
| Events in quadrant A | 7,819,541 | 739,134 |
| Events in quadrant B | 4,553,897 | 813,562 |
| Events in quadrant C | 13,958,692 | 349,168 |
| Events in quadrant D | 5,369,885 | 686,992 |
| Mode SS | |||
|---|---|---|---|
| Quadrant | BADHDUFLAG | Total packets | Discarded packets |
| A | 0 | 156 | 0 |
| B | 0 | 156 | 0 |
| C | 0 | 156 | 0 |
| D | 0 | 156 | 0 |
| Mode M0 | |||
|---|---|---|---|
| Quadrant | BADHDUFLAG | Total packets | Discarded packets |
| A | 0 | 28660 | 0 |
| B | 0 | 19025 | 0 |
| C | 0 | 46673 | 8 |
| D | 0 | 21470 | 0 |
| Quadrant | Total seconds | Saturated seconds | Saturation percentage |
|---|---|---|---|
| A | 7839 | 685 | 8.738359% |
| B | 7839 | 96 | 1.224646% |
| C | 7839 | 4063 | 51.830591% |
| D | 7839 | 284 | 3.622911% |
Noise dominated data is calculated using 1-second bins in cleaned event files. If a bin has >2000 counts, and if more than 50% of those come from <1% of pixels, then it is considered to be noise-dominated and hence unusable.
| Quadrant | # 1 sec bins | Bins with >0 counts | Bins with >2000 counts | High rate bins dominated by noise | Noise dominated (total time) | Noise dominated (detector-on time) | Marked lightcurve |
|---|---|---|---|---|---|---|---|
| A | 7839 | 7839 | 625 | 625 | 7.97% | 7.97% | 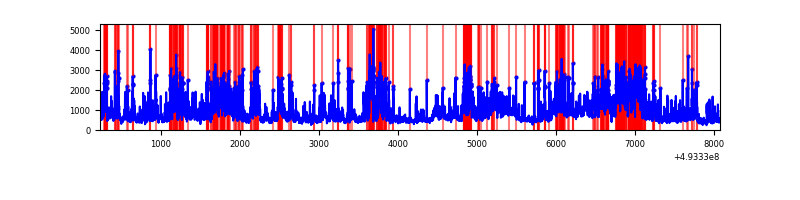 |
| B | 7839 | 7839 | 62 | 62 | 0.79% | 0.79% | 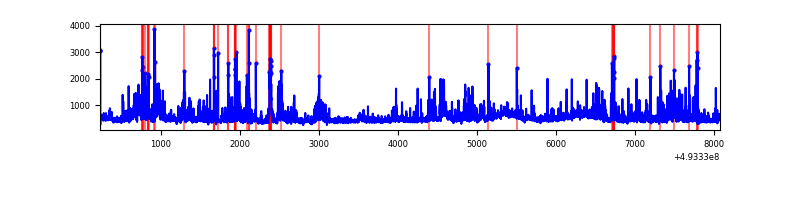 |
| C | 7838 | 7838 | 3886 | 3886 | 49.58% | 49.58% | 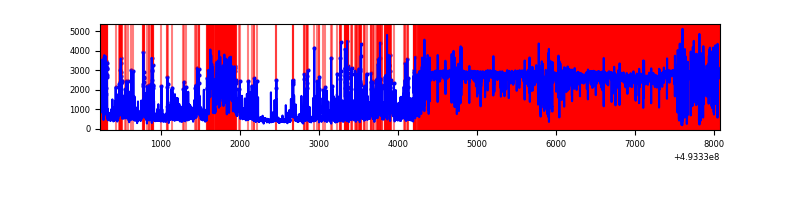 |
| D | 7839 | 7839 | 251 | 251 | 3.20% | 3.20% | 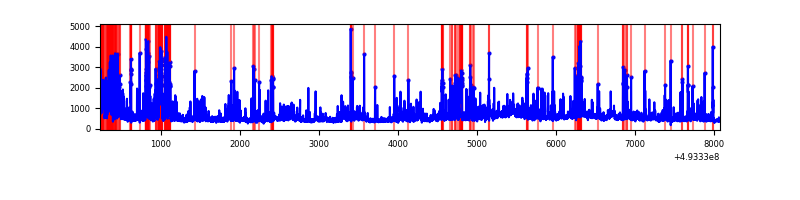 |
Top three noisy pixels from each quadrant. If the there are fewer than three noisy pixels in the level2.evt file, extra rows are filled as -1
| Pixel properties | Quadrant properties | ||||||
|---|---|---|---|---|---|---|---|
| Quadrant | DetID | PixID | Counts | Sigma | Mean | Median | Sigma |
| A | 3 | 62 | 2943803 | 14107.14 | 826 | 805 | 208.6 |
| A | 3 | 63 | 890522 | 4264.82 | 826 | 805 | 208.6 |
| A | 15 | 174 | 591428 | 2831.13 | 826 | 805 | 208.6 |
| B | 2 | 249 | 287684 | 1628.34 | 833 | 803 | 176.2 |
| B | 4 | 81 | 186361 | 1053.23 | 833 | 803 | 176.2 |
| B | 5 | 172 | 162196 | 916.07 | 833 | 803 | 176.2 |
| C | 1 | 241 | 8254898 | 57036.67 | 510 | 504 | 144.7 |
| C | 15 | 224 | 1797756 | 12418.75 | 510 | 504 | 144.7 |
| C | 7 | 64 | 699687 | 4831.25 | 510 | 504 | 144.7 |
| D | 2 | 153 | 606183 | 2571.14 | 818 | 780 | 235.5 |
| D | 2 | 249 | 348689 | 1477.56 | 818 | 780 | 235.5 |
| D | 13 | 153 | 193626 | 819.01 | 818 | 780 | 235.5 |
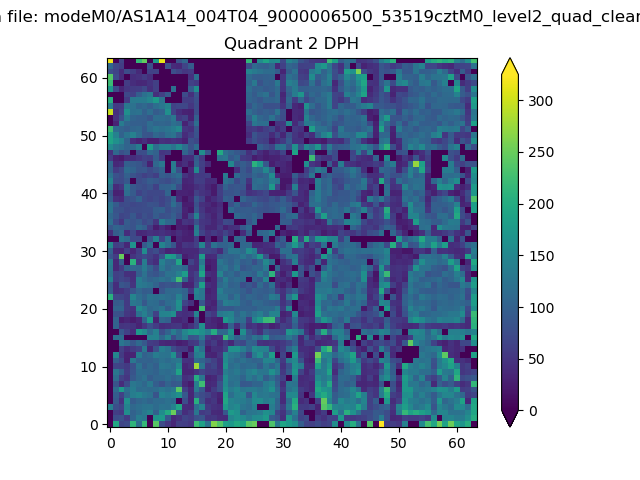
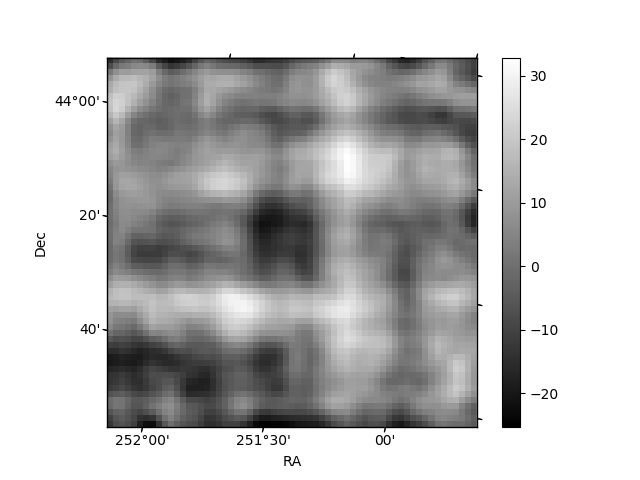
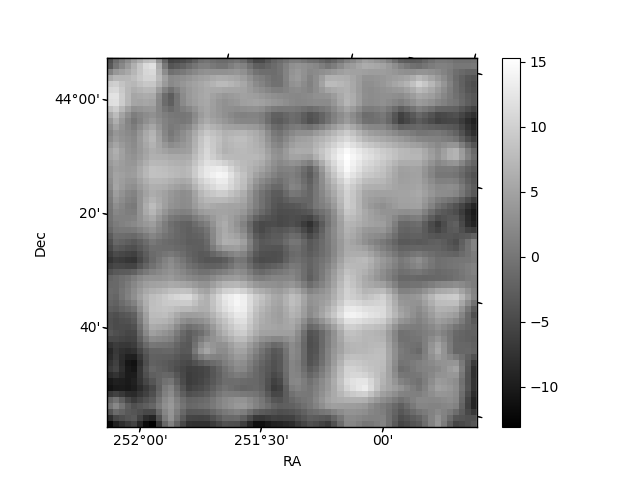
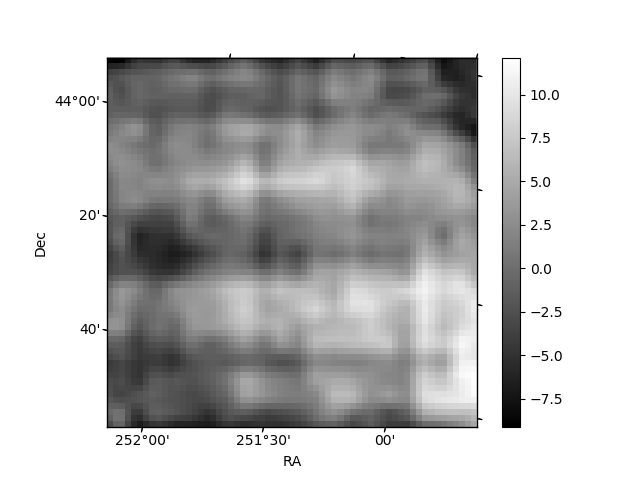
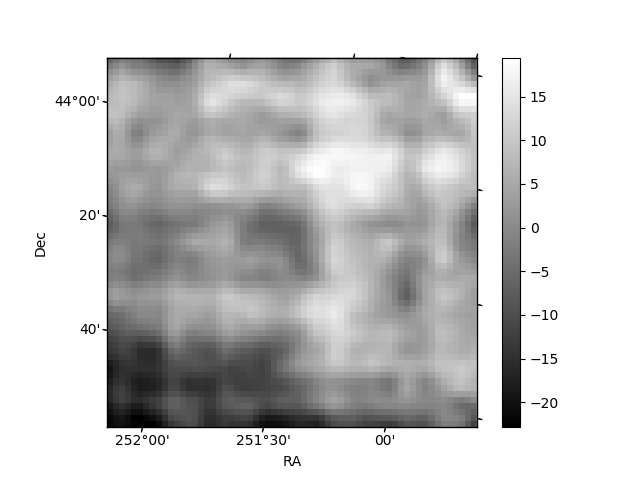
Histogram calculated using DETX and DETY for each event in the final _common_clean file
| Quadrant A | 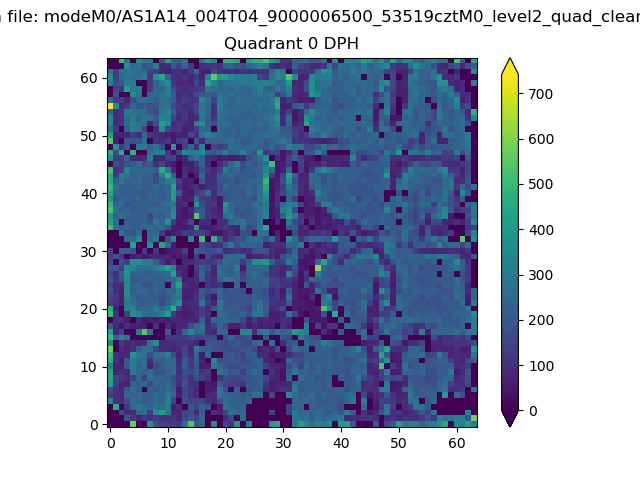 |
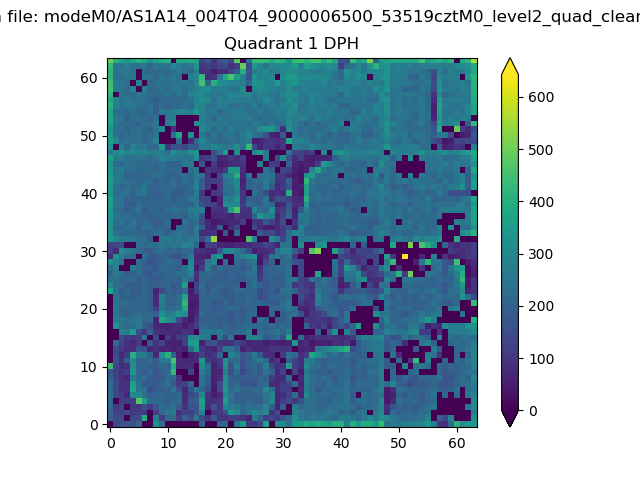 |
Quadrant B |
|---|---|---|---|
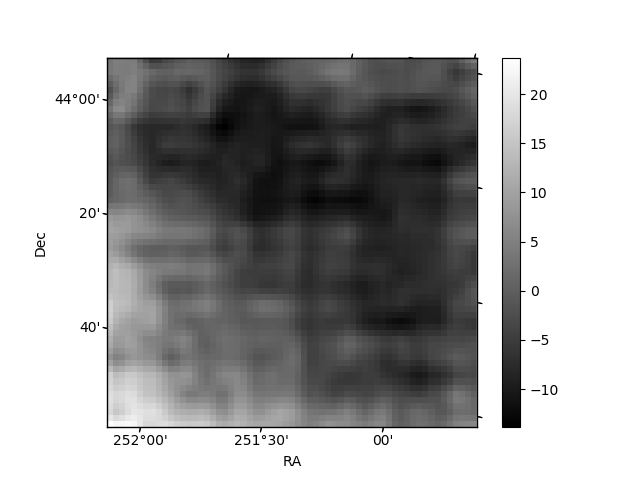
| Quadrant D | 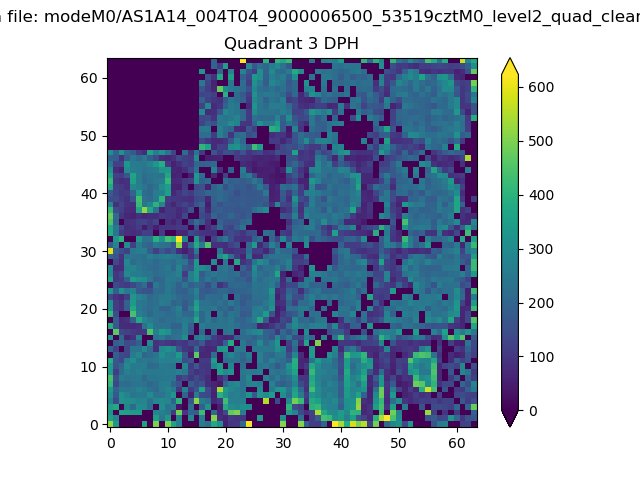 |
 |
Quadrant C |
| Plot type | Count rate plots | Images |
|---|---|---|
| Comparison with Poisson distribution Blue bars denote a histogram of data divided into 1 sec bins. Red curve is a Poisson curve with rate = median count rate of data. |
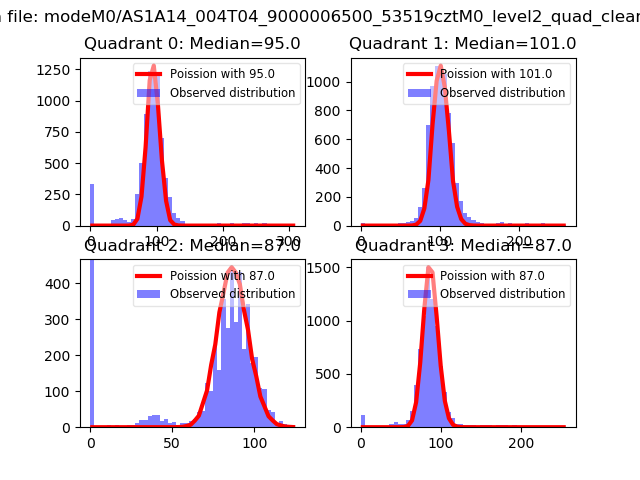 |
 |
| Quadrant-wise count rates Data is divided into 100 sec bins |
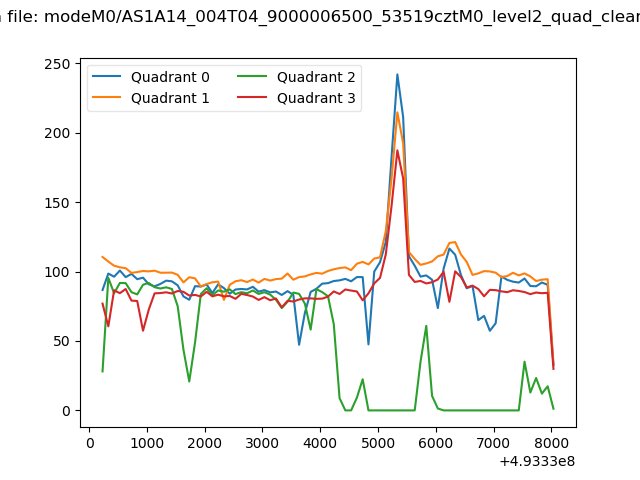 |
|
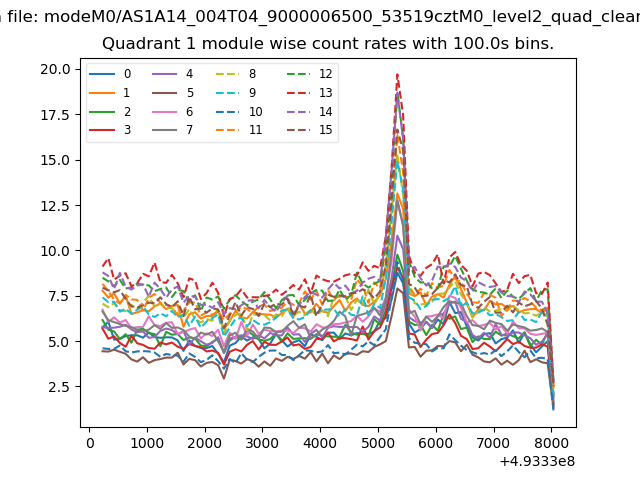
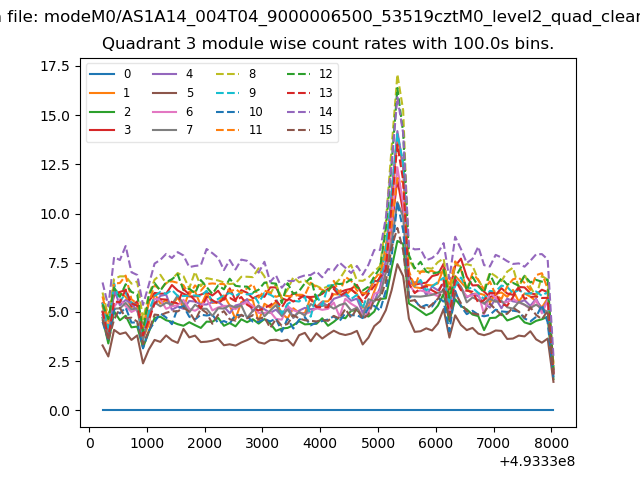
| Module-wise count rates for Quadrant A Data is divided into 100 sec bins |
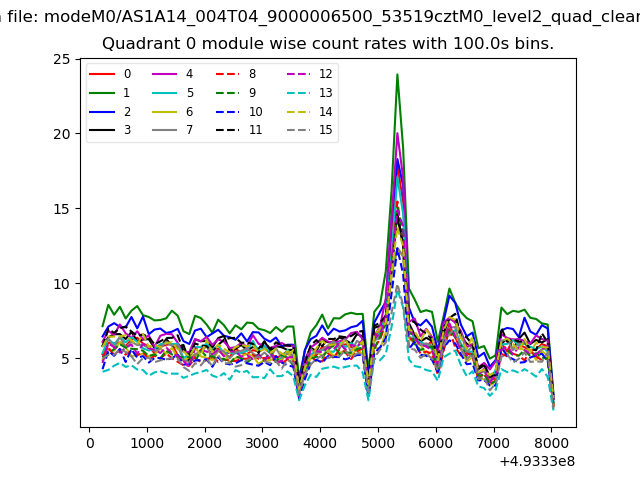 |
 |
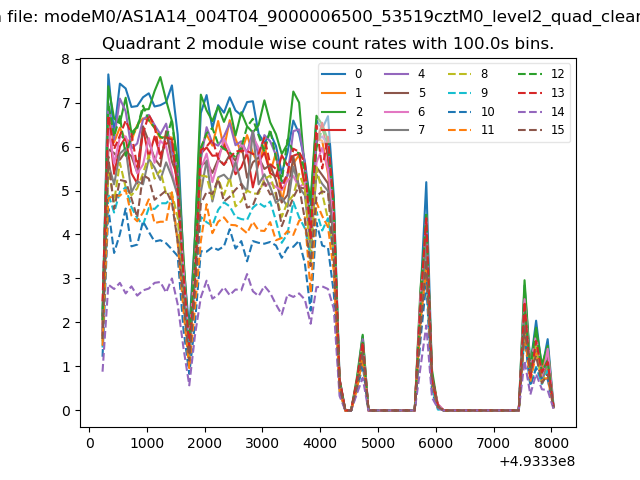
| Module-wise count rates for Quadrant B Data is divided into 100 sec bins |
 |
 |
| Module-wise count rates for Quadrant C Data is divided into 100 sec bins |
 |
 |
| Module-wise count rates for Quadrant D Data is divided into 100 sec bins |
 |
 |
| Parameter | Plot |
|---|---|
| CZT HV Monitor | 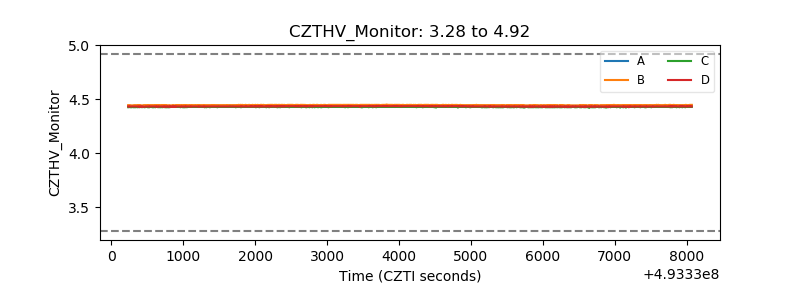 |
| D_VDD | 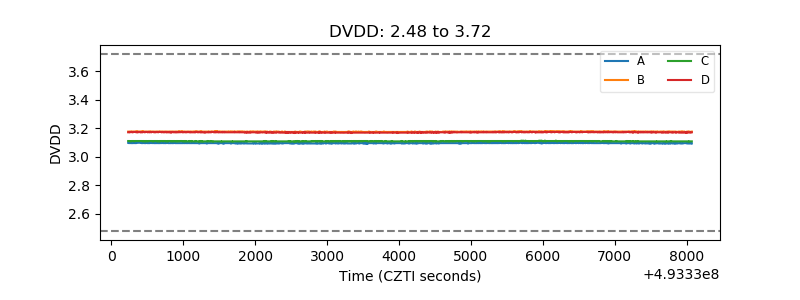 |
| Temperature 1 | 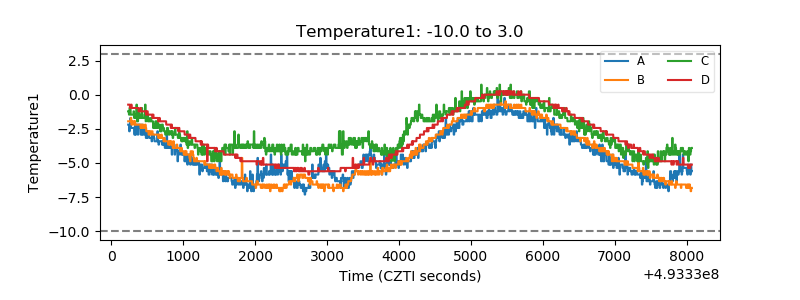 |
| Veto HV Monitor | 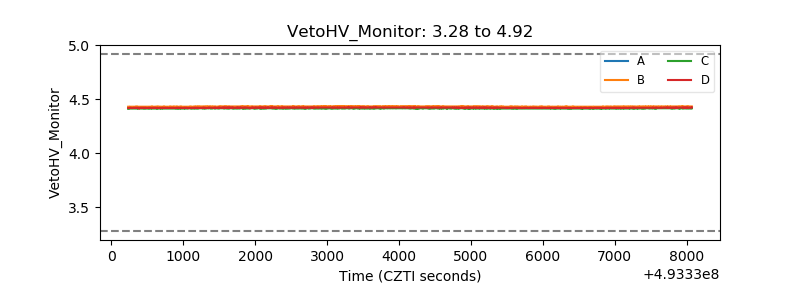 |
| Veto LLD | 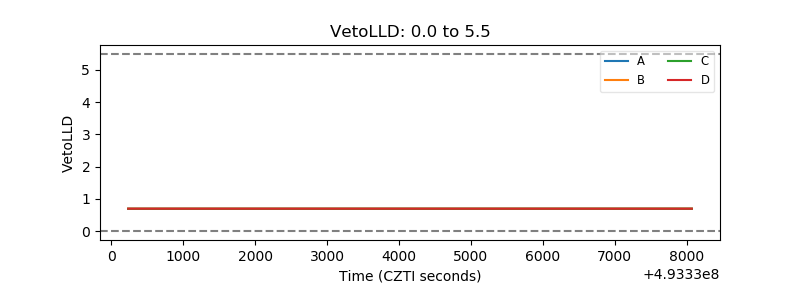 |
| Alpha Counter | 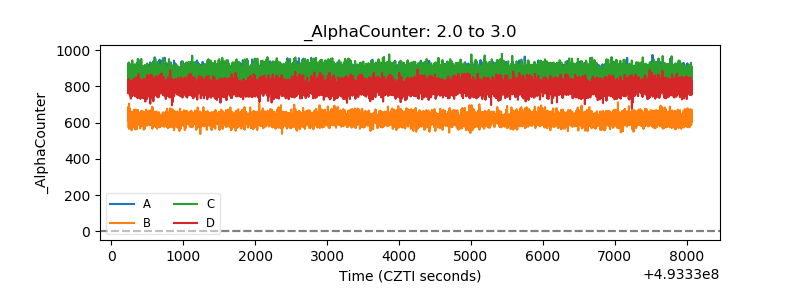 |
| _CPM_Rate | 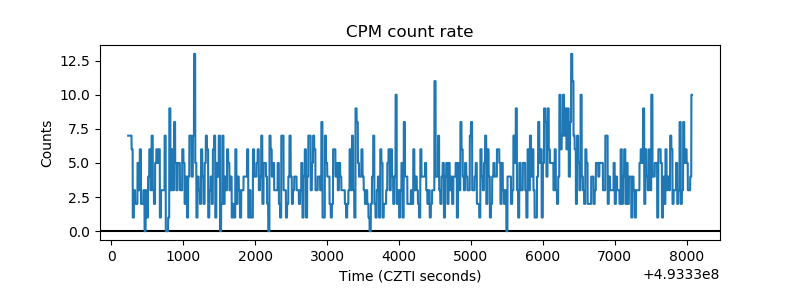 |
| CZT Counter | 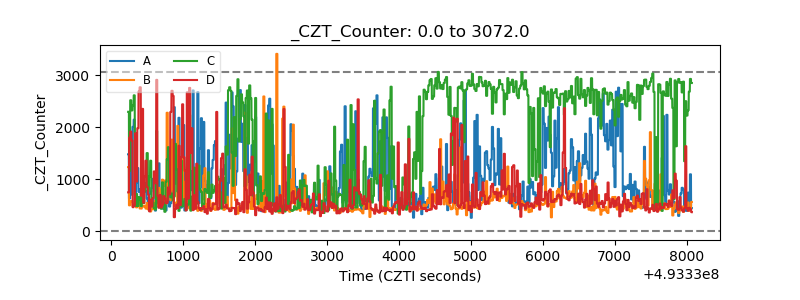 |
| +2.5 Volts monitor | 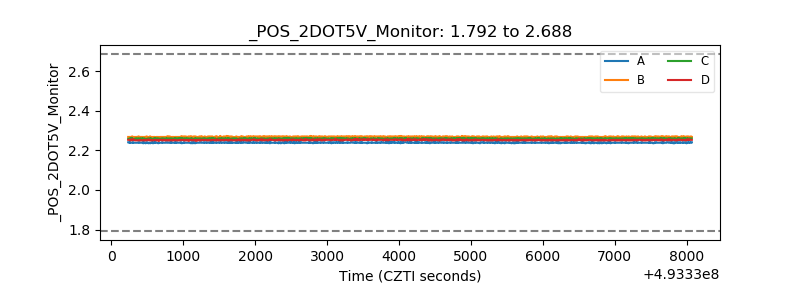 |
| +5 Volts monitor |  |
| _ROLL_ROT | 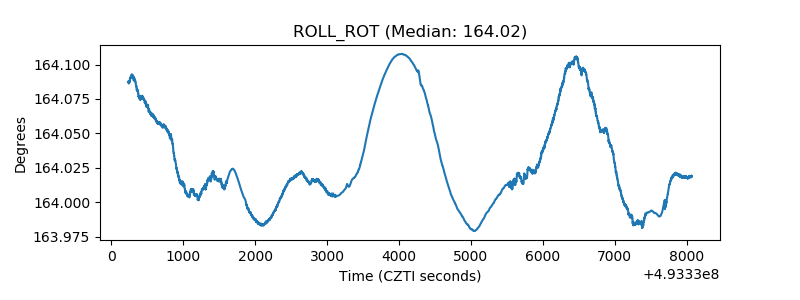 |
| _Roll_DEC | 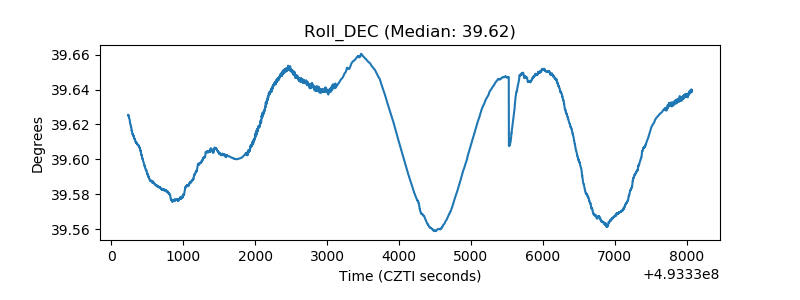 |
| _Roll_RA | 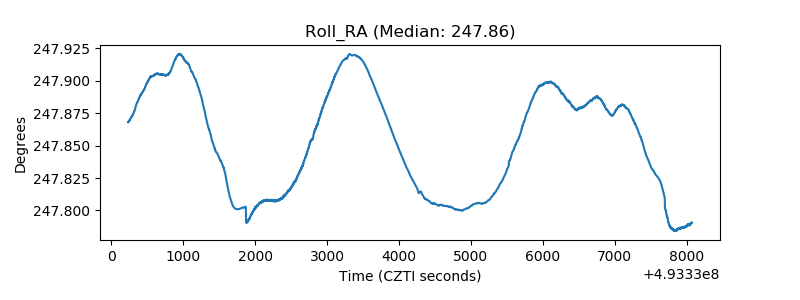 |
| Veto Counter | 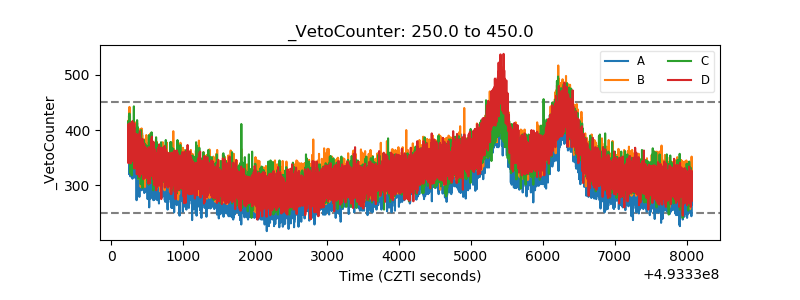 |