| Param | Original file | Final file |
|---|---|---|
| Filename | modeM0/AS1A14_004T04_9000006500_53522cztM0_level2.fits | modeM0/AS1A14_004T04_9000006500_53522cztM0_level2_quad_clean.evt |
| Size (bytes) | 1,496,905,920 | 142,488,000 |
| Size | 1.4 GB | 135.9 MB |
| Events in quadrant A | 11,727,291 | 1,025,404 |
| Events in quadrant B | 7,100,378 | 1,201,743 |
| Events in quadrant C | 27,866,270 | 255,848 |
| Events in quadrant D | 7,790,221 | 1,001,601 |
| Mode SS | |||
|---|---|---|---|
| Quadrant | BADHDUFLAG | Total packets | Discarded packets |
| A | 0 | 242 | 0 |
| B | 0 | 242 | 0 |
| C | 0 | 242 | 0 |
| D | 0 | 242 | 0 |
| Mode M0 | |||
|---|---|---|---|
| Quadrant | BADHDUFLAG | Total packets | Discarded packets |
| A | 0 | 43171 | 1 |
| B | 0 | 29402 | 1 |
| C | 0 | 90673 | 2 |
| D | 0 | 31930 | 1 |
| Mode M9 | |||
|---|---|---|---|
| Quadrant | BADHDUFLAG | Total packets | Discarded packets |
| A | 0 | 5 | 0 |
| B | 0 | 5 | 0 |
| C | 0 | 5 | 0 |
| D | 0 | 5 | 0 |
| Quadrant | Total seconds | Saturated seconds | Saturation percentage |
|---|---|---|---|
| A | 11994 | 1480 | 12.339503% |
| B | 11995 | 248 | 2.067528% |
| C | 11994 | 9475 | 78.997832% |
| D | 11994 | 465 | 3.876938% |
Noise dominated data is calculated using 1-second bins in cleaned event files. If a bin has >2000 counts, and if more than 50% of those come from <1% of pixels, then it is considered to be noise-dominated and hence unusable.
| Quadrant | # 1 sec bins | Bins with >0 counts | Bins with >2000 counts | High rate bins dominated by noise | Noise dominated (total time) | Noise dominated (detector-on time) | Marked lightcurve |
|---|---|---|---|---|---|---|---|
| A | 12429 | 11996 | 1120 | 1120 | 9.01% | 9.34% | 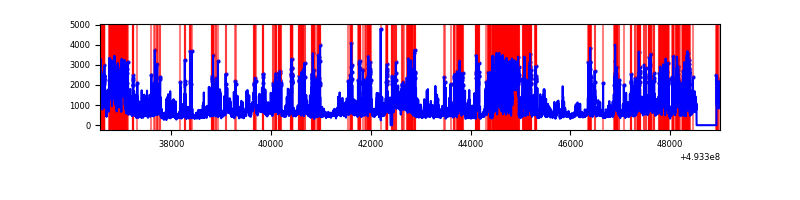 |
| B | 12430 | 11997 | 86 | 86 | 0.69% | 0.72% | 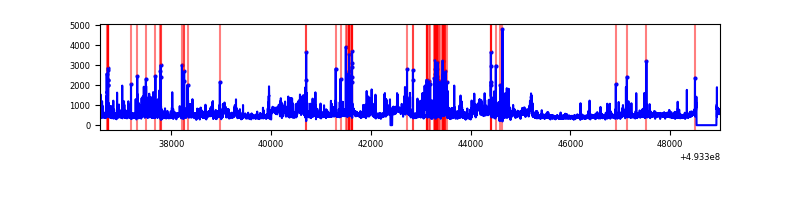 |
| C | 12429 | 11995 | 8944 | 8944 | 71.96% | 74.56% | 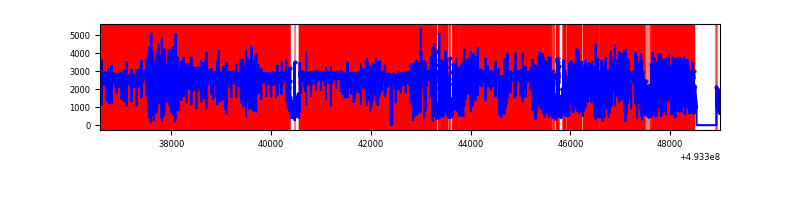 |
| D | 12429 | 11996 | 374 | 374 | 3.01% | 3.12% | 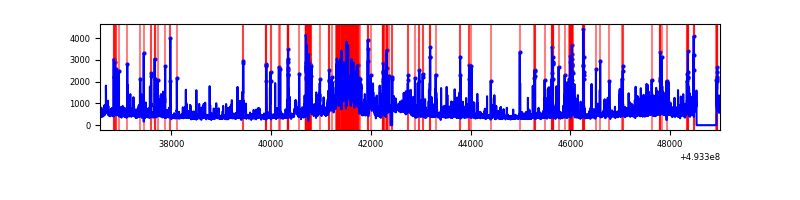 |
Top three noisy pixels from each quadrant. If the there are fewer than three noisy pixels in the level2.evt file, extra rows are filled as -1
| Pixel properties | Quadrant properties | ||||||
|---|---|---|---|---|---|---|---|
| Quadrant | DetID | PixID | Counts | Sigma | Mean | Median | Sigma |
| A | 3 | 62 | 5042313 | 16164.66 | 1256 | 1223 | 311.9 |
| A | 3 | 63 | 762843 | 2442.2 | 1256 | 1223 | 311.9 |
| A | 15 | 174 | 655650 | 2098.47 | 1256 | 1223 | 311.9 |
| B | 2 | 249 | 1272404 | 4673.51 | 1285 | 1238 | 272.0 |
| B | 5 | 185 | 135008 | 491.81 | 1285 | 1238 | 272.0 |
| B | 7 | 252 | 85646 | 310.33 | 1285 | 1238 | 272.0 |
| C | 1 | 241 | 17399620 | 106726.56 | 589 | 584 | 163.0 |
| C | 7 | 64 | 3893206 | 23877.54 | 589 | 584 | 163.0 |
| C | 15 | 224 | 2758397 | 16916.56 | 589 | 584 | 163.0 |
| D | 10 | 172 | 1035665 | 2925.81 | 1255 | 1201 | 353.6 |
| D | 12 | 18 | 322941 | 909.99 | 1255 | 1201 | 353.6 |
| D | 13 | 153 | 254158 | 715.45 | 1255 | 1201 | 353.6 |
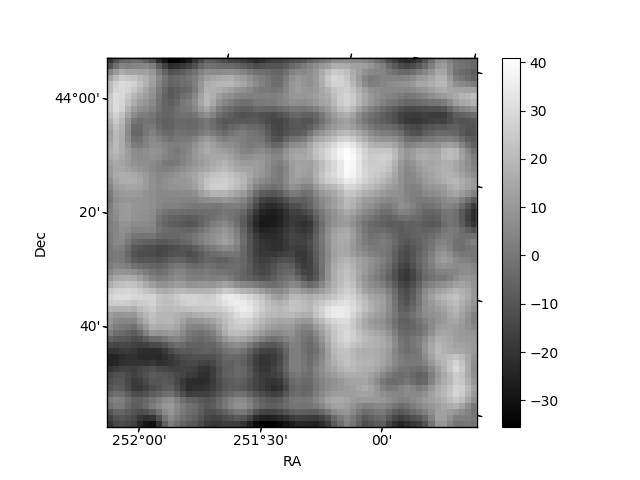
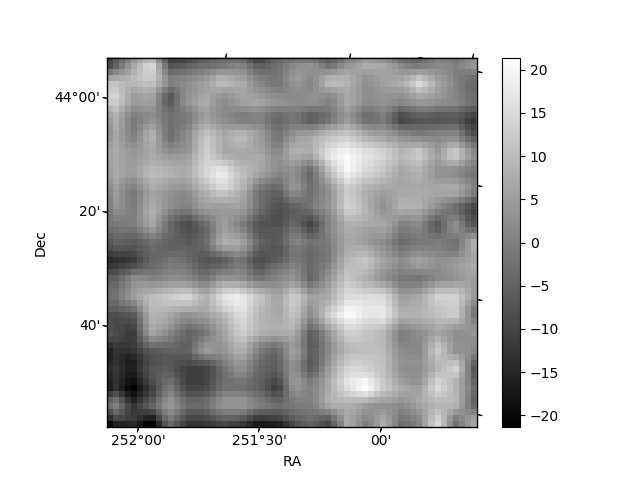
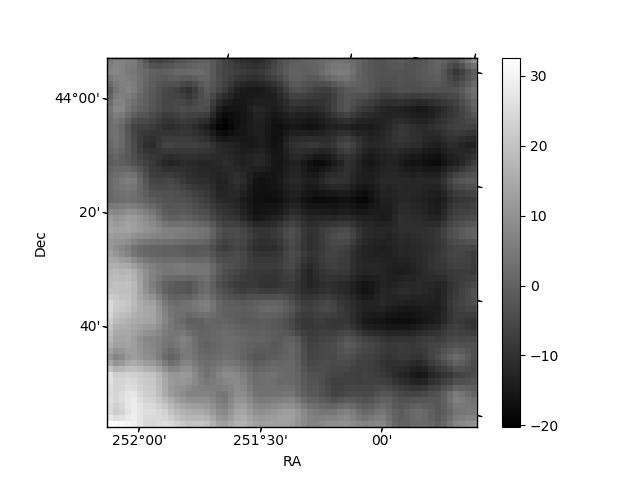
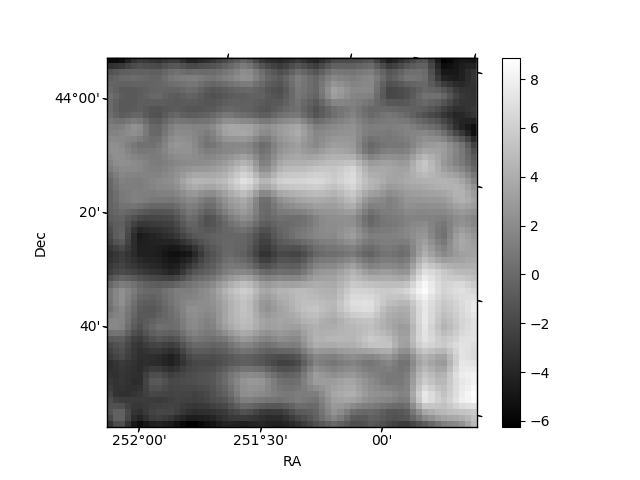
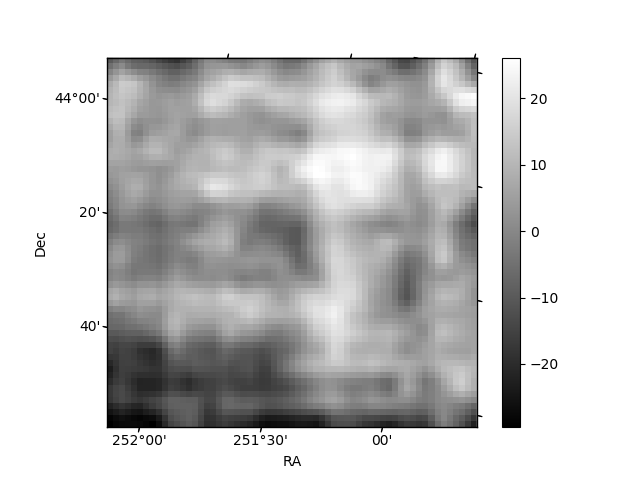
Histogram calculated using DETX and DETY for each event in the final _common_clean file
| Quadrant A | 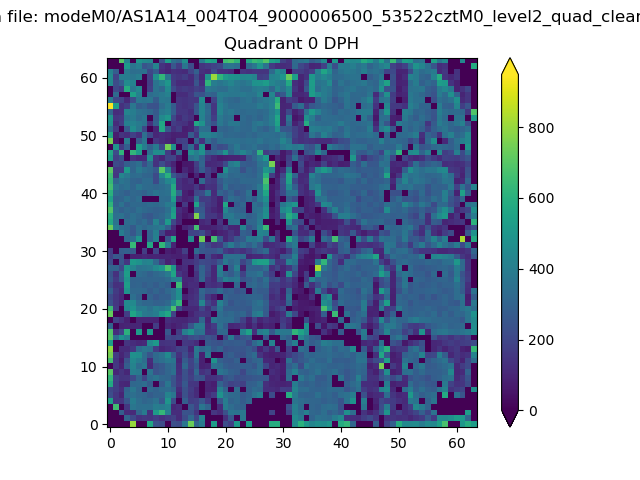 |
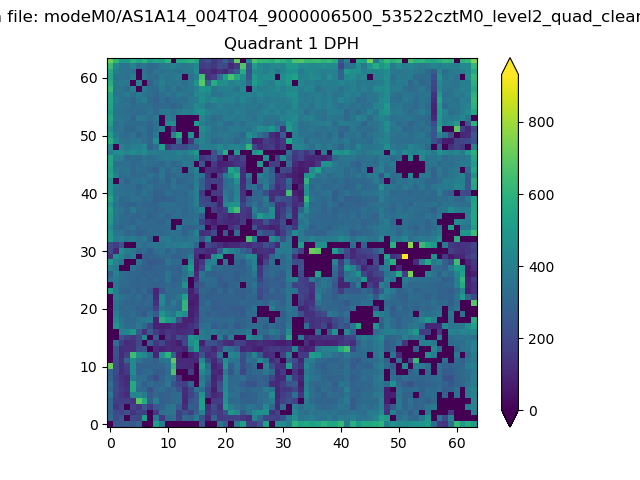 |
Quadrant B |
|---|---|---|---|
| Quadrant D | 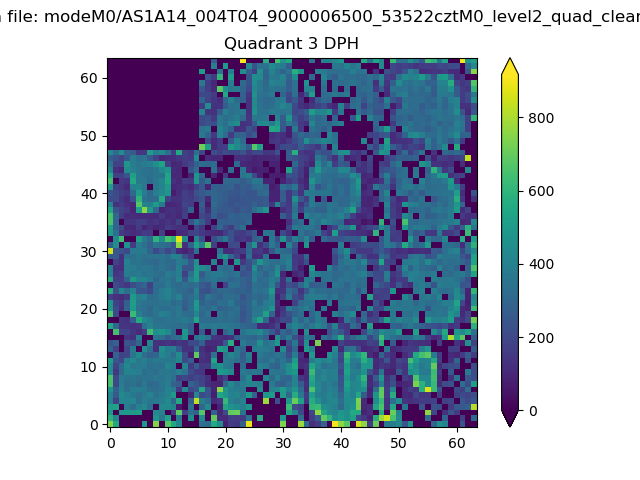 |
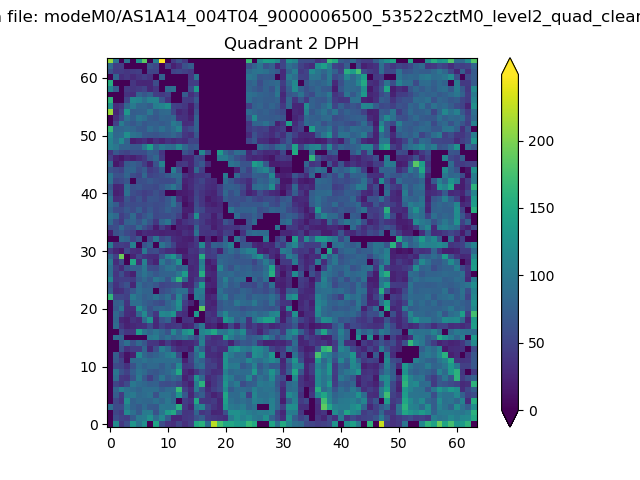 |
Quadrant C |
| Plot type | Count rate plots | Images |
|---|---|---|
| Comparison with Poisson distribution Blue bars denote a histogram of data divided into 1 sec bins. Red curve is a Poisson curve with rate = median count rate of data. |
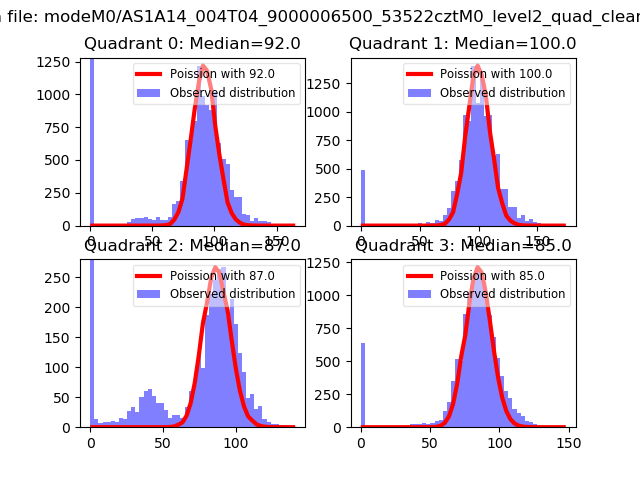 |
 |
| Quadrant-wise count rates Data is divided into 100 sec bins |
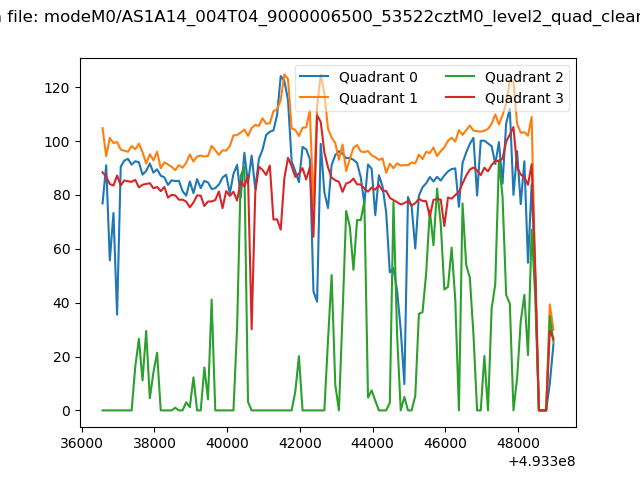 |
|
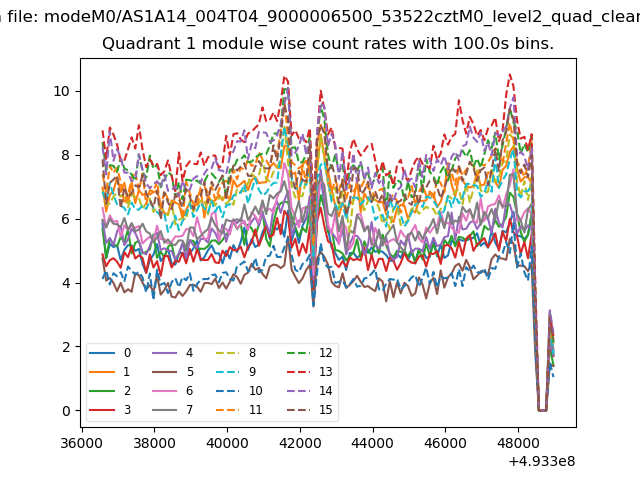
| Module-wise count rates for Quadrant A Data is divided into 100 sec bins |
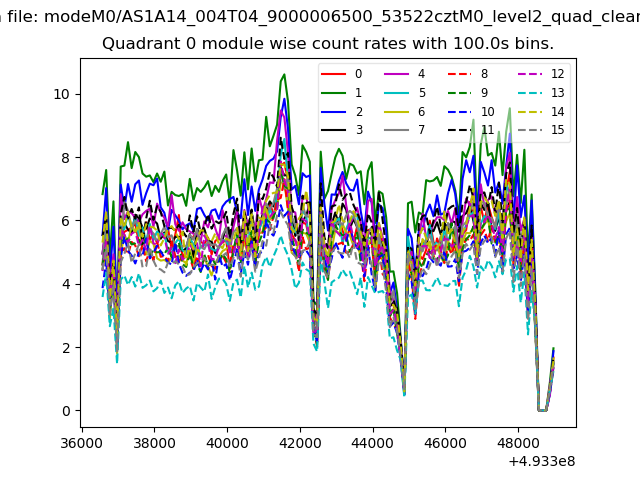 |
 |
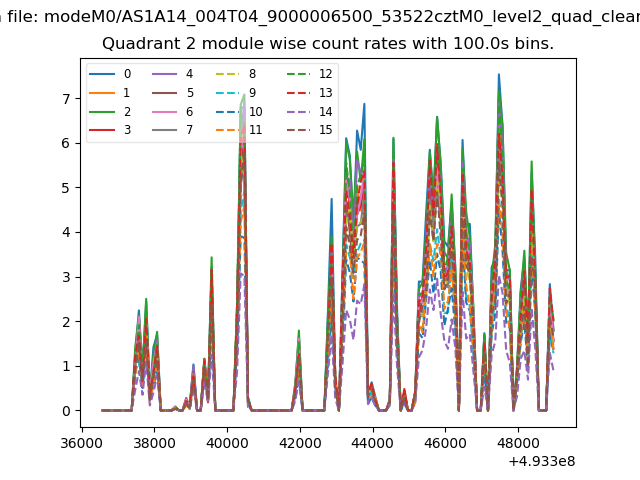
| Module-wise count rates for Quadrant B Data is divided into 100 sec bins |
 |
 |
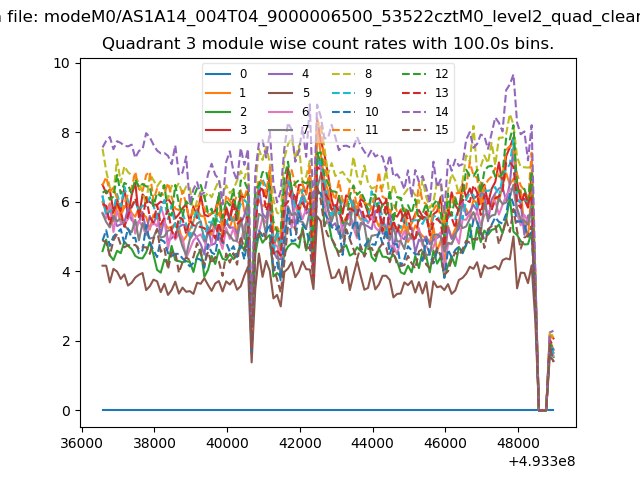
| Module-wise count rates for Quadrant C Data is divided into 100 sec bins |
 |
 |
| Module-wise count rates for Quadrant D Data is divided into 100 sec bins |
 |
 |
| Parameter | Plot |
|---|---|
| CZT HV Monitor | 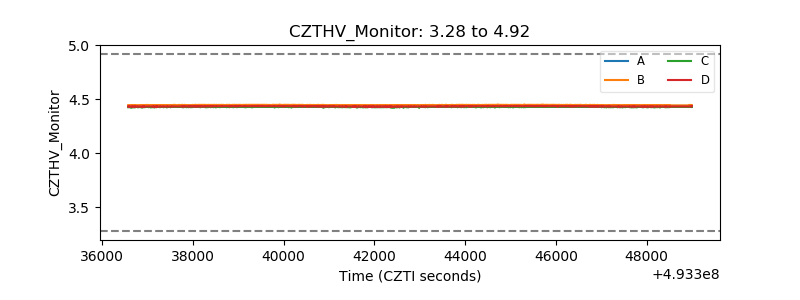 |
| D_VDD | 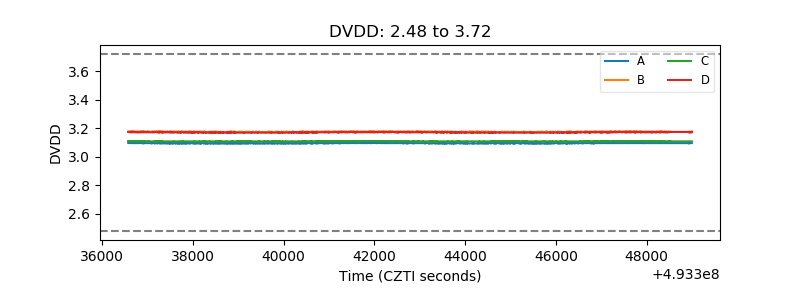 |
| Temperature 1 | 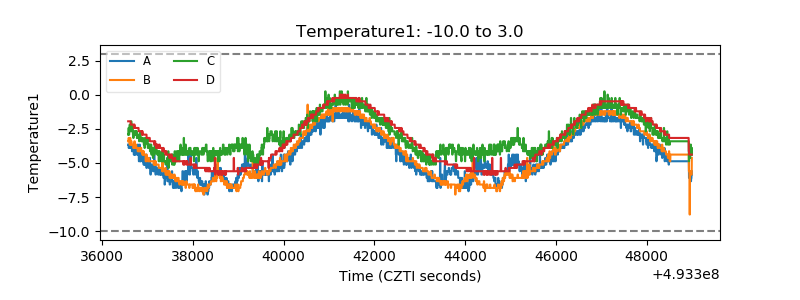 |
| Veto HV Monitor | 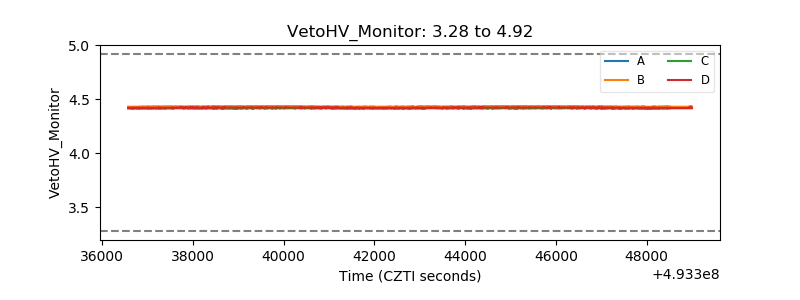 |
| Veto LLD | 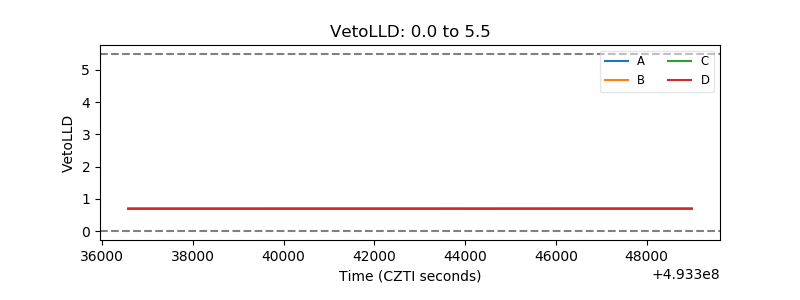 |
| Alpha Counter | 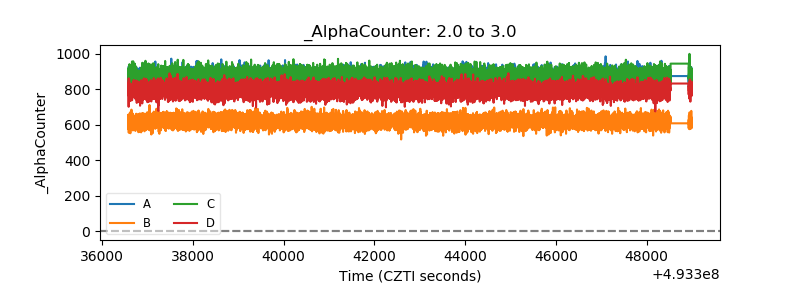 |
| _CPM_Rate | 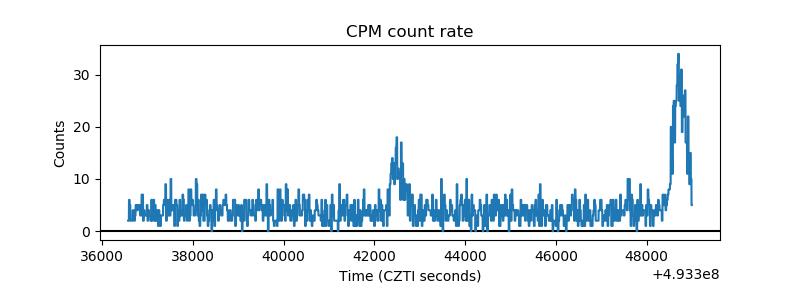 |
| CZT Counter | 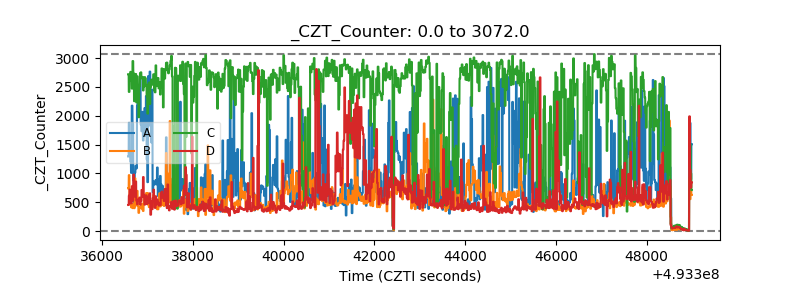 |
| +2.5 Volts monitor | 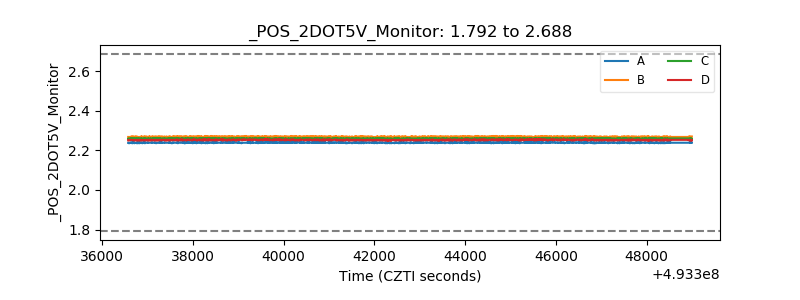 |
| +5 Volts monitor |  |
| _ROLL_ROT | 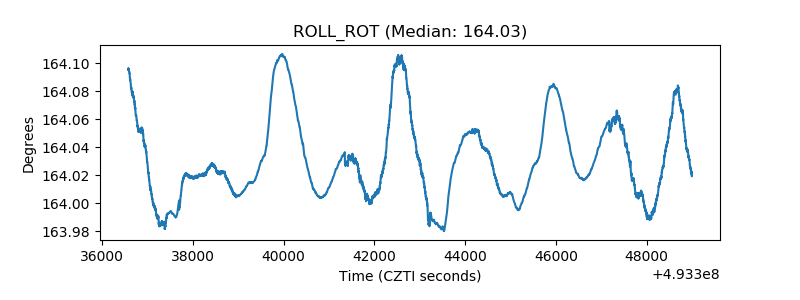 |
| _Roll_DEC | 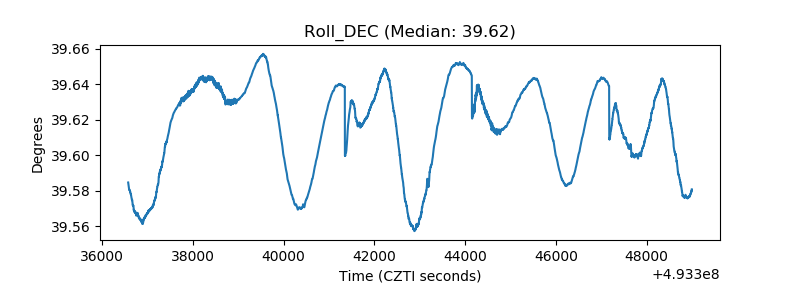 |
| _Roll_RA | 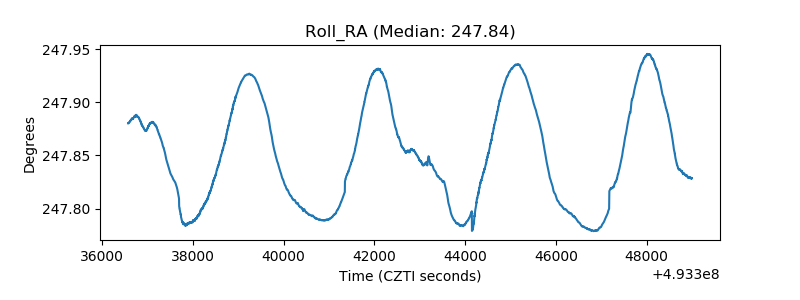 |
| Veto Counter | 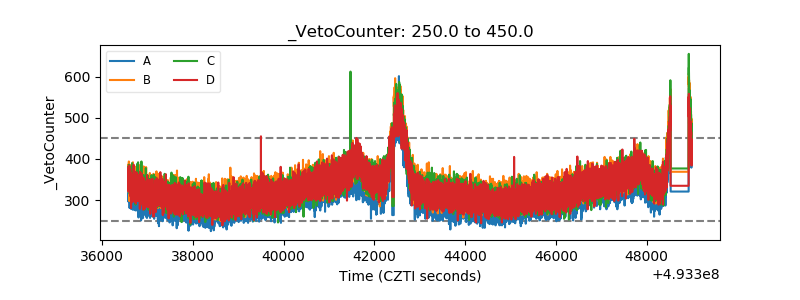 |