| Param | Original file | Final file |
|---|---|---|
| Filename | modeM0/AS1A14_004T04_9000006500_53523cztM0_level2.fits | modeM0/AS1A14_004T04_9000006500_53523cztM0_level2_quad_clean.evt |
| Size (bytes) | 1,436,860,800 | 166,754,880 |
| Size | 1.3 GB | 159.0 MB |
| Events in quadrant A | 11,026,111 | 1,179,807 |
| Events in quadrant B | 6,790,331 | 1,321,500 |
| Events in quadrant C | 25,705,910 | 533,704 |
| Events in quadrant D | 8,657,625 | 1,111,726 |
| Mode SS | |||
|---|---|---|---|
| Quadrant | BADHDUFLAG | Total packets | Discarded packets |
| A | 0 | 268 | 0 |
| B | 0 | 268 | 0 |
| C | 0 | 268 | 0 |
| D | 0 | 268 | 0 |
| Mode M0 | |||
|---|---|---|---|
| Quadrant | BADHDUFLAG | Total packets | Discarded packets |
| A | 0 | 41670 | 3 |
| B | 0 | 29459 | 3 |
| C | 0 | 85291 | 10 |
| D | 0 | 35038 | 3 |
| Mode M9 | |||
|---|---|---|---|
| Quadrant | BADHDUFLAG | Total packets | Discarded packets |
| A | 0 | 18 | 0 |
| B | 0 | 18 | 0 |
| C | 0 | 18 | 0 |
| D | 0 | 18 | 0 |
| Quadrant | Total seconds | Saturated seconds | Saturation percentage |
|---|---|---|---|
| A | 13047 | 1086 | 8.323753% |
| B | 13047 | 392 | 3.004522% |
| C | 13046 | 7820 | 59.941745% |
| D | 13047 | 562 | 4.307504% |
Noise dominated data is calculated using 1-second bins in cleaned event files. If a bin has >2000 counts, and if more than 50% of those come from <1% of pixels, then it is considered to be noise-dominated and hence unusable.
| Quadrant | # 1 sec bins | Bins with >0 counts | Bins with >2000 counts | High rate bins dominated by noise | Noise dominated (total time) | Noise dominated (detector-on time) | Marked lightcurve |
|---|---|---|---|---|---|---|---|
| A | 14817 | 13049 | 720 | 720 | 4.86% | 5.52% | 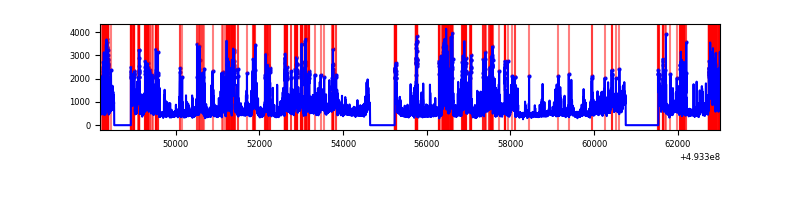 |
| B | 14817 | 13049 | 116 | 116 | 0.78% | 0.89% | 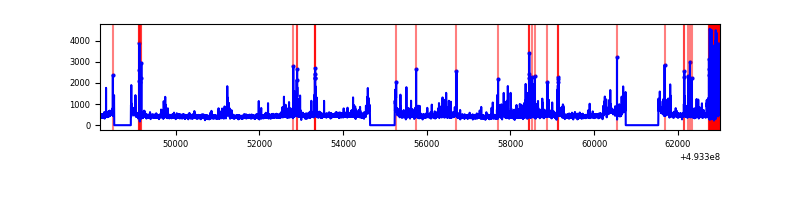 |
| C | 14817 | 13048 | 7175 | 7175 | 48.42% | 54.99% | 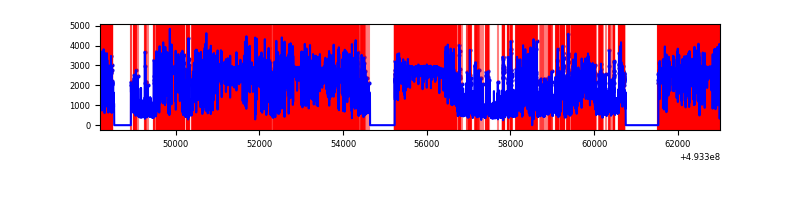 |
| D | 14817 | 13050 | 398 | 398 | 2.69% | 3.05% | 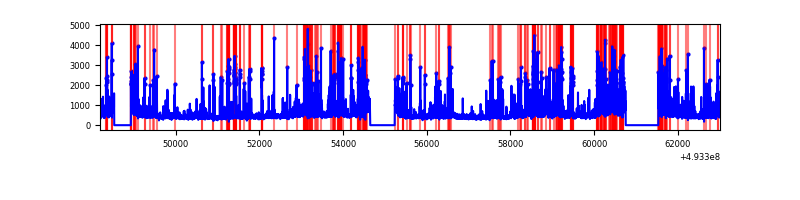 |
Top three noisy pixels from each quadrant. If the there are fewer than three noisy pixels in the level2.evt file, extra rows are filled as -1
| Pixel properties | Quadrant properties | ||||||
|---|---|---|---|---|---|---|---|
| Quadrant | DetID | PixID | Counts | Sigma | Mean | Median | Sigma |
| A | 3 | 63 | 2050565 | 5927.54 | 1403 | 1370 | 345.7 |
| A | 15 | 174 | 1534225 | 4433.96 | 1403 | 1370 | 345.7 |
| A | 3 | 62 | 1489138 | 4303.54 | 1403 | 1370 | 345.7 |
| B | 2 | 249 | 423539 | 1413.51 | 1413 | 1359 | 298.7 |
| B | 5 | 185 | 297774 | 992.44 | 1413 | 1359 | 298.7 |
| B | 1 | 255 | 114072 | 377.38 | 1413 | 1359 | 298.7 |
| C | 7 | 64 | 10652801 | 42327.07 | 909 | 902 | 251.7 |
| C | 1 | 241 | 7749833 | 30791.65 | 909 | 902 | 251.7 |
| C | 15 | 224 | 3097768 | 12305.91 | 909 | 902 | 251.7 |
| D | 12 | 1 | 704526 | 1798.23 | 1382 | 1326 | 391.1 |
| D | 6 | 239 | 532071 | 1357.23 | 1382 | 1326 | 391.1 |
| D | 2 | 153 | 403584 | 1028.66 | 1382 | 1326 | 391.1 |
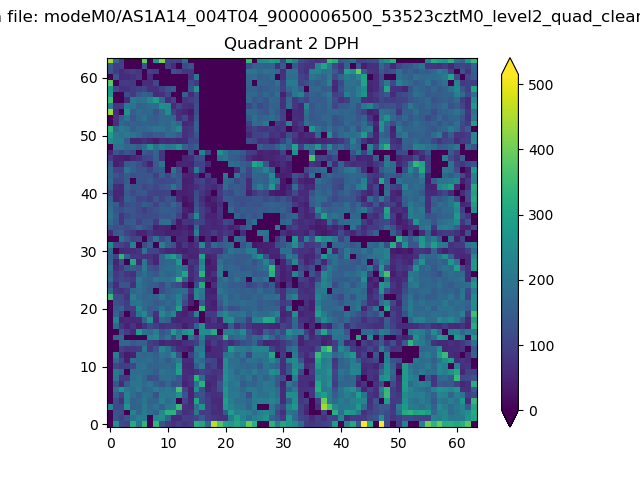
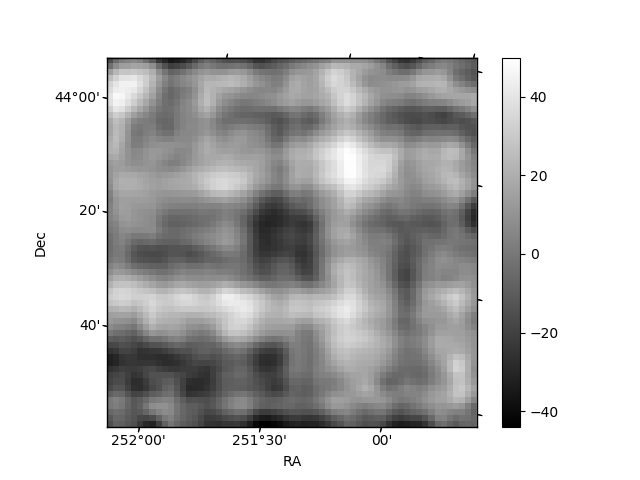
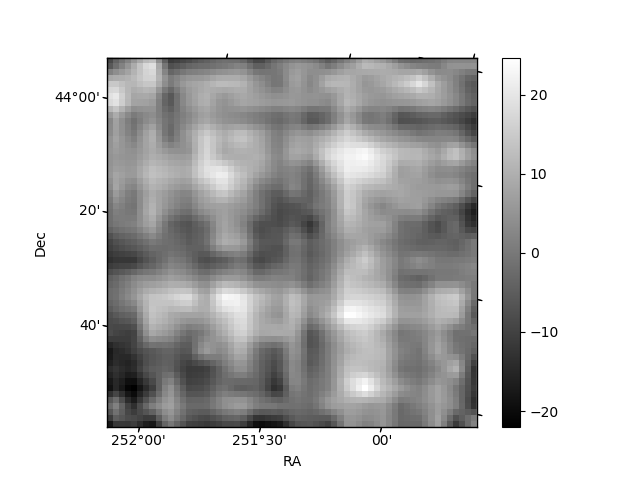
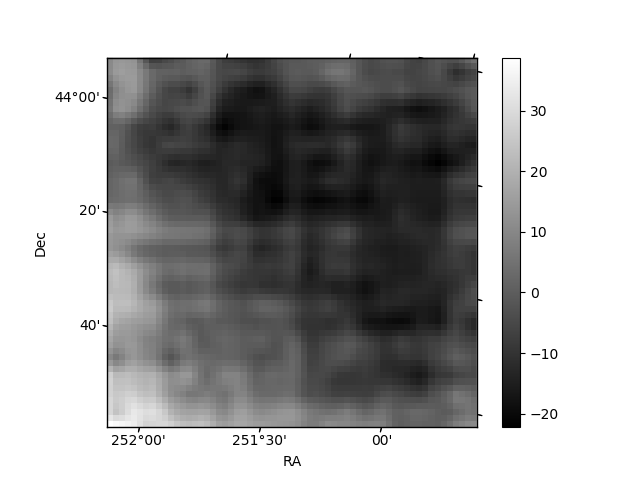
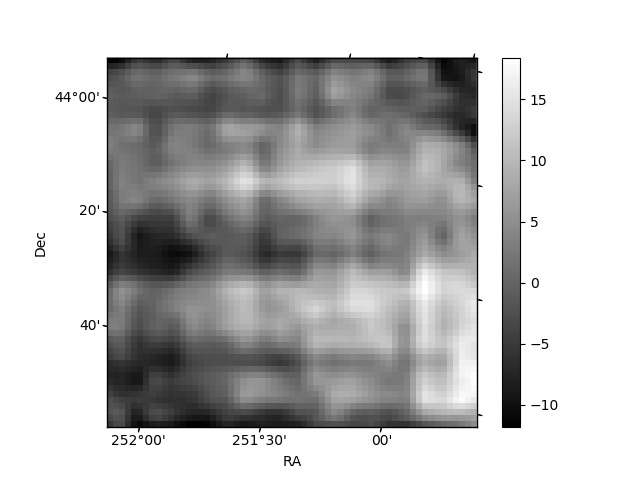
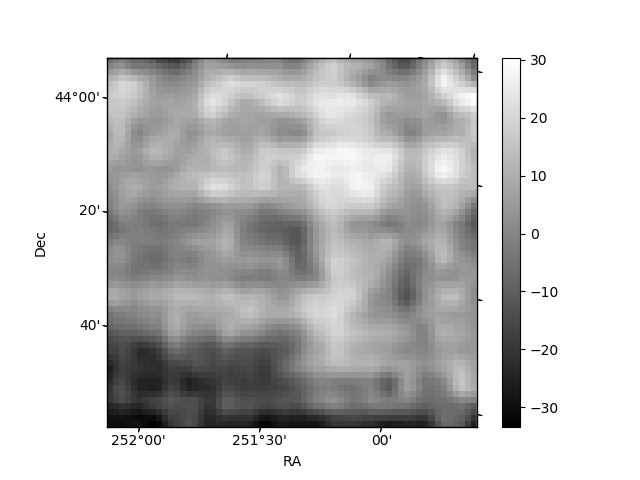
Histogram calculated using DETX and DETY for each event in the final _common_clean file
| Quadrant A | 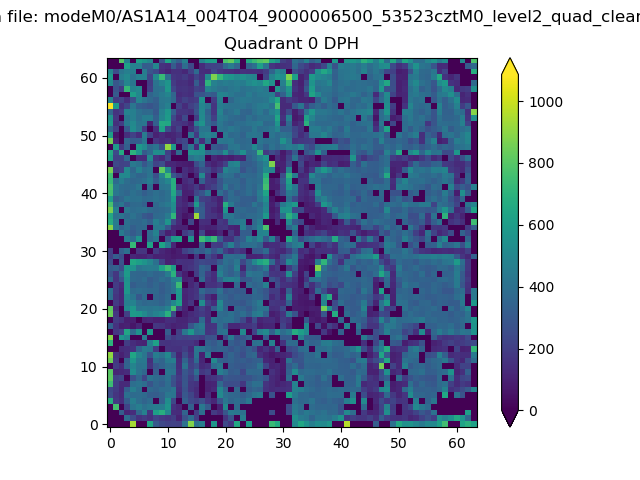 |
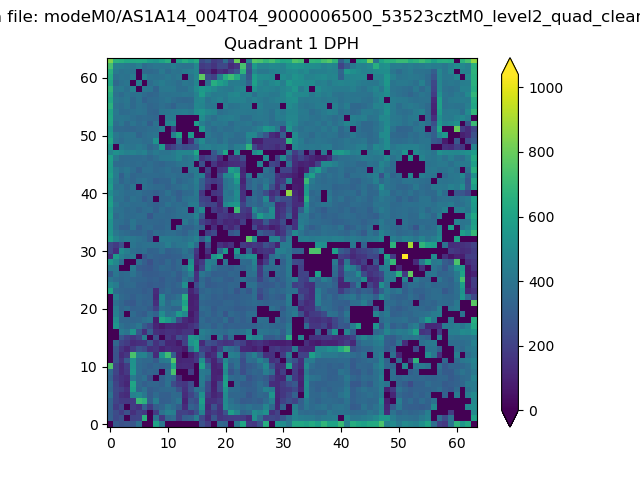 |
Quadrant B |
|---|---|---|---|
| Quadrant D | 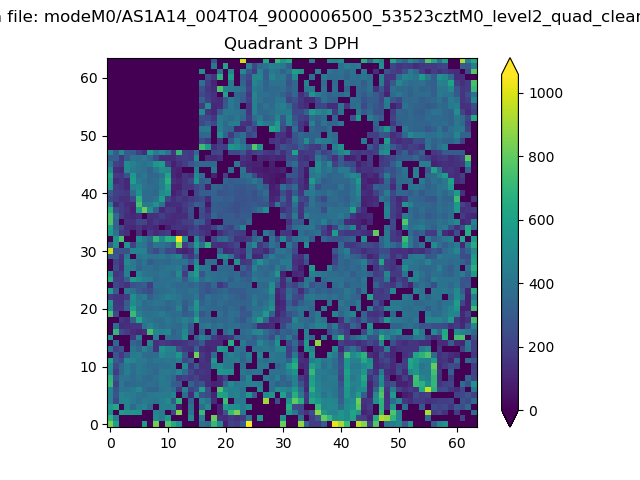 |
 |
Quadrant C |
| Plot type | Count rate plots | Images |
|---|---|---|
| Comparison with Poisson distribution Blue bars denote a histogram of data divided into 1 sec bins. Red curve is a Poisson curve with rate = median count rate of data. |
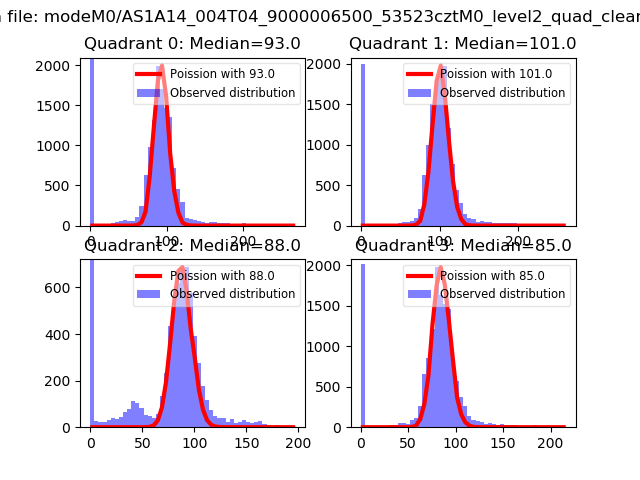 |
 |
| Quadrant-wise count rates Data is divided into 100 sec bins |
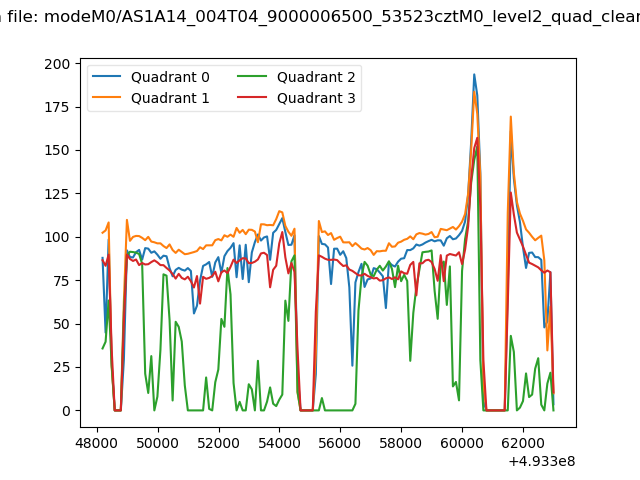 |
|
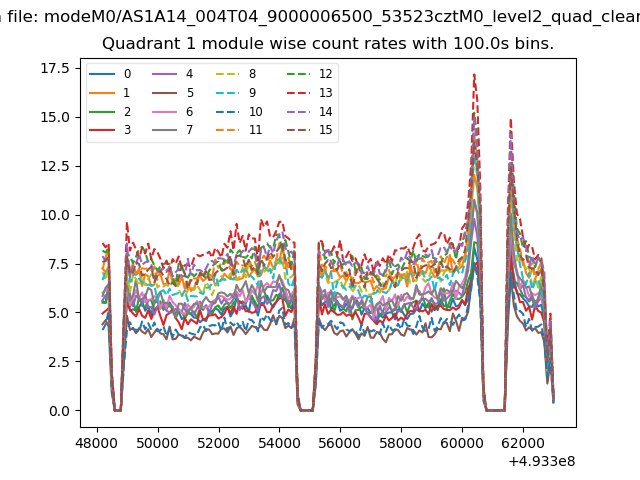
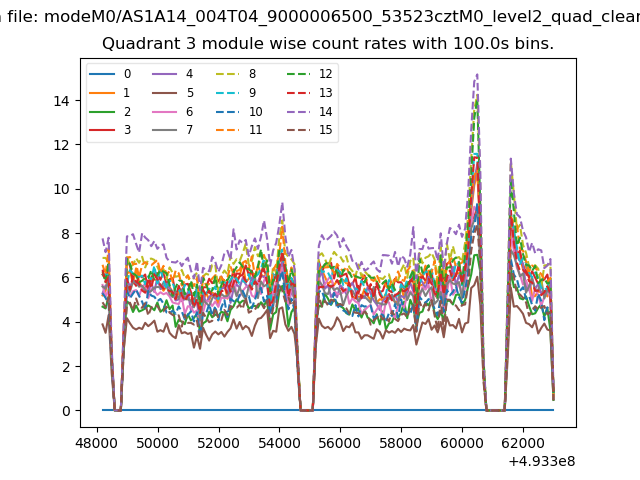
| Module-wise count rates for Quadrant A Data is divided into 100 sec bins |
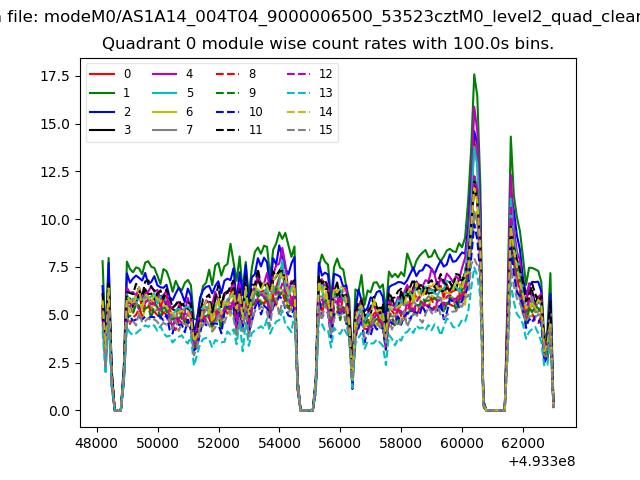 |
 |
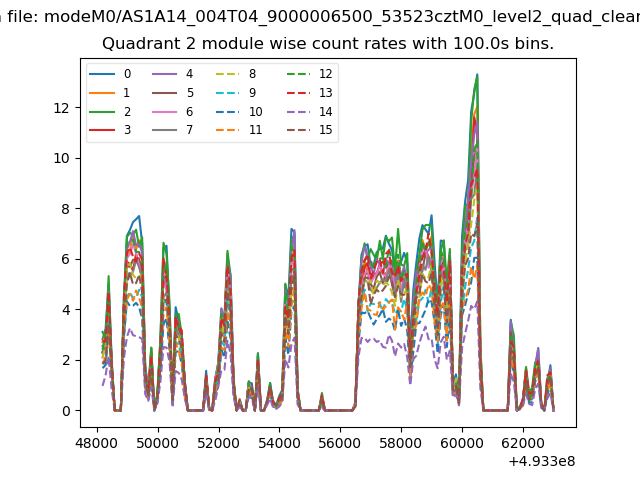
| Module-wise count rates for Quadrant B Data is divided into 100 sec bins |
 |
 |
| Module-wise count rates for Quadrant C Data is divided into 100 sec bins |
 |
 |
| Module-wise count rates for Quadrant D Data is divided into 100 sec bins |
 |
 |
| Parameter | Plot |
|---|---|
| CZT HV Monitor | 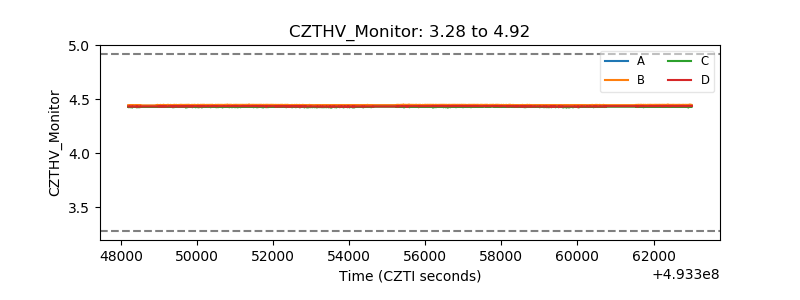 |
| D_VDD | 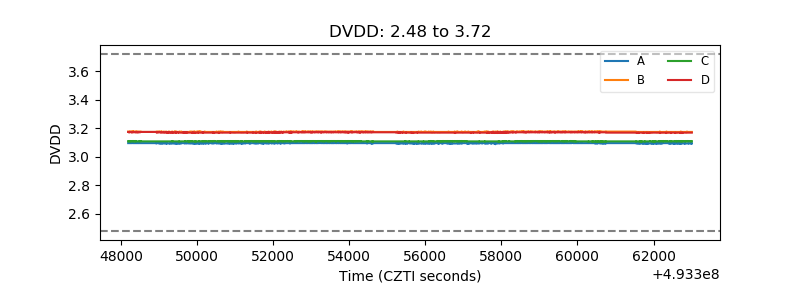 |
| Temperature 1 | 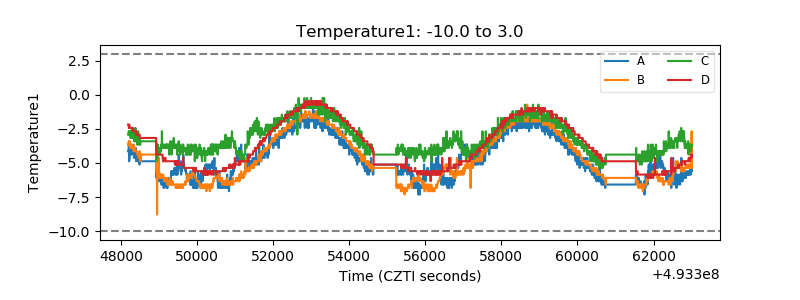 |
| Veto HV Monitor |  |
| Veto LLD | 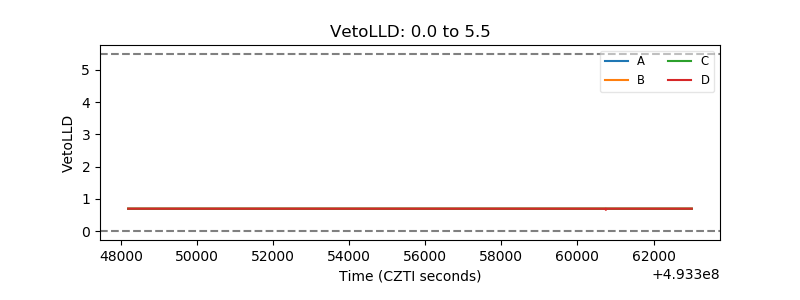 |
| Alpha Counter | 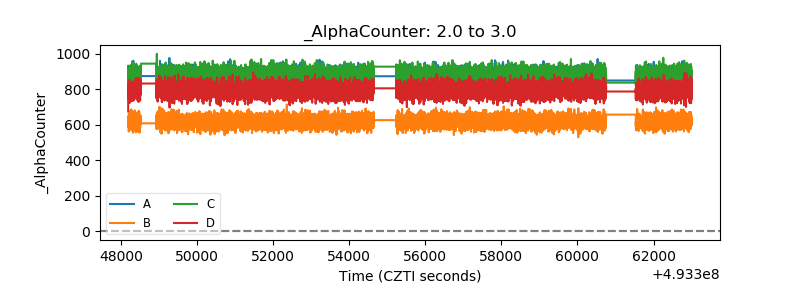 |
| _CPM_Rate | 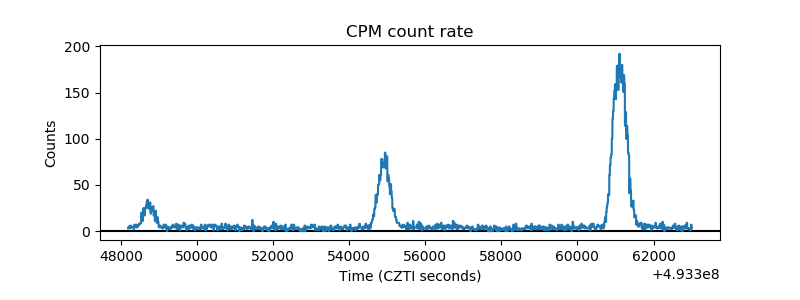 |
| CZT Counter | 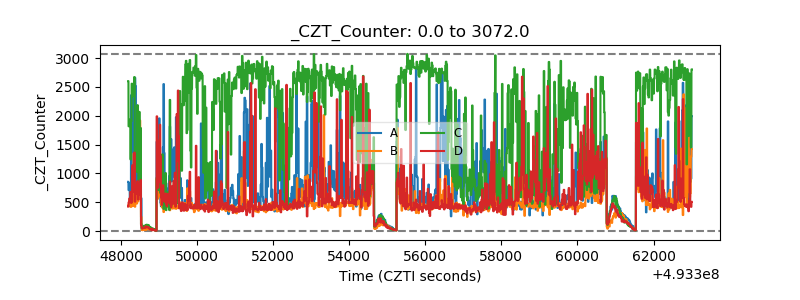 |
| +2.5 Volts monitor | 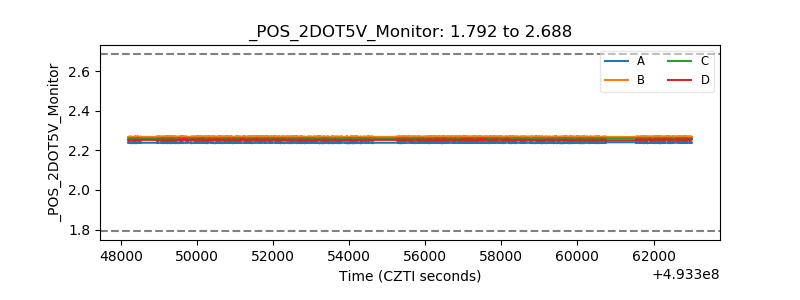 |
| +5 Volts monitor |  |
| _ROLL_ROT | 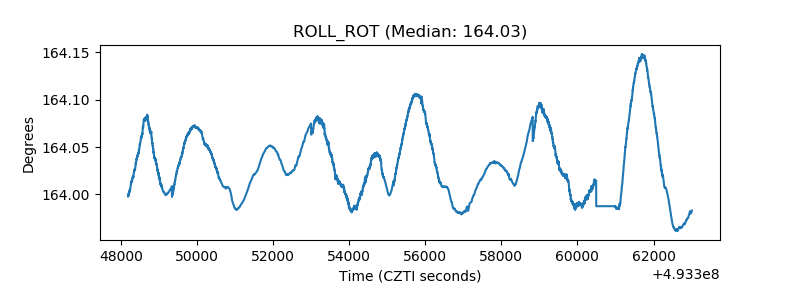 |
| _Roll_DEC | 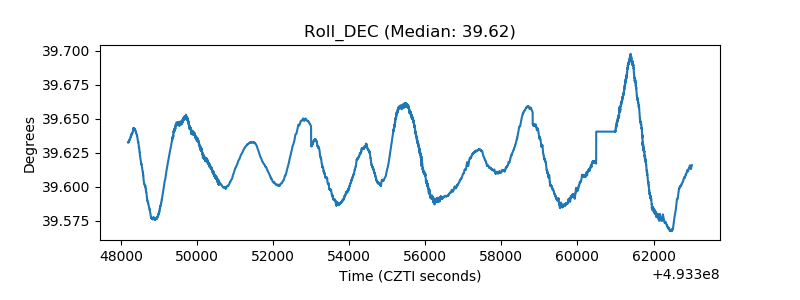 |
| _Roll_RA | 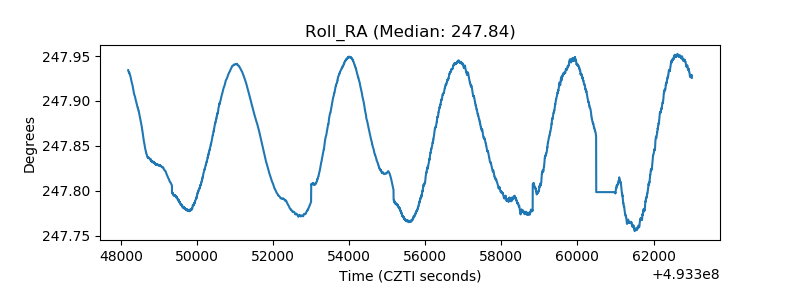 |
| Veto Counter | 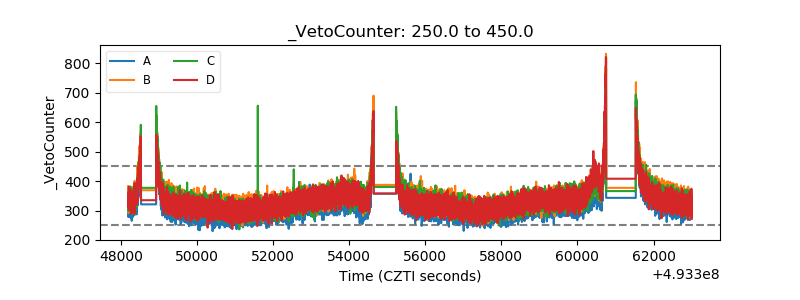 |