| Param | Original file | Final file |
|---|---|---|
| Filename | modeM0/AS1A14_004T04_9000006500_53526cztM0_level2.fits | modeM0/AS1A14_004T04_9000006500_53526cztM0_level2_quad_clean.evt |
| Size (bytes) | 420,851,520 | 45,642,240 |
| Size | 401.4 MB | 43.5 MB |
| Events in quadrant A | 2,326,350 | 354,697 |
| Events in quadrant B | 1,650,906 | 381,596 |
| Events in quadrant C | 8,712,144 | 75,950 |
| Events in quadrant D | 2,605,075 | 312,463 |
| Mode SS | |||
|---|---|---|---|
| Quadrant | BADHDUFLAG | Total packets | Discarded packets |
| A | 0 | 72 | 0 |
| B | 0 | 72 | 0 |
| C | 0 | 72 | 0 |
| D | 0 | 72 | 0 |
| Mode M0 | |||
|---|---|---|---|
| Quadrant | BADHDUFLAG | Total packets | Discarded packets |
| A | 0 | 9393 | 0 |
| B | 0 | 7477 | 0 |
| C | 0 | 28398 | 0 |
| D | 0 | 10254 | 0 |
| Quadrant | Total seconds | Saturated seconds | Saturation percentage |
|---|---|---|---|
| A | 3637 | 62 | 1.704702% |
| B | 3637 | 5 | 0.137476% |
| C | 3638 | 2984 | 82.023090% |
| D | 3638 | 145 | 3.985706% |
Noise dominated data is calculated using 1-second bins in cleaned event files. If a bin has >2000 counts, and if more than 50% of those come from <1% of pixels, then it is considered to be noise-dominated and hence unusable.
| Quadrant | # 1 sec bins | Bins with >0 counts | Bins with >2000 counts | High rate bins dominated by noise | Noise dominated (total time) | Noise dominated (detector-on time) | Marked lightcurve |
|---|---|---|---|---|---|---|---|
| A | 3637 | 3637 | 52 | 52 | 1.43% | 1.43% | 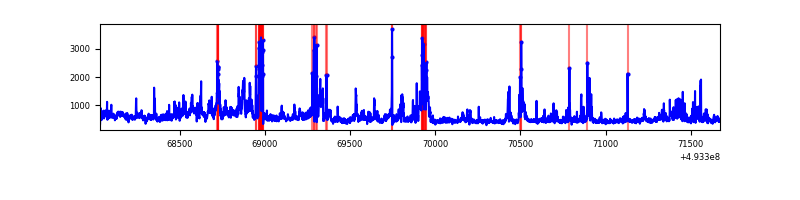 |
| B | 3637 | 3637 | 2 | 2 | 0.05% | 0.05% | 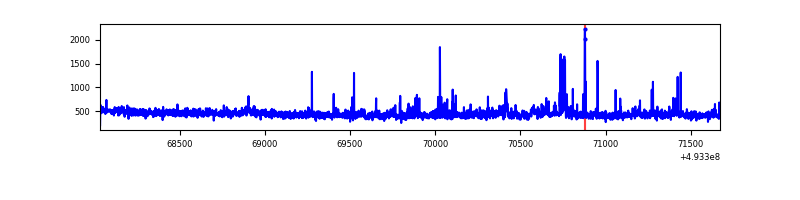 |
| C | 3638 | 3638 | 2909 | 2909 | 79.96% | 79.96% | 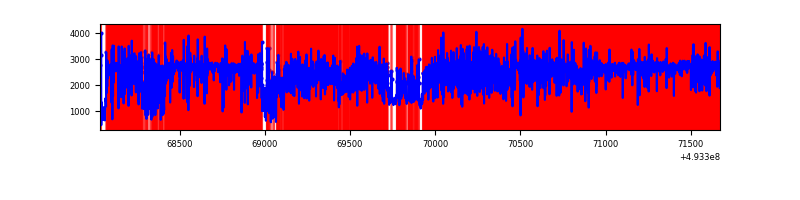 |
| D | 3638 | 3638 | 129 | 129 | 3.55% | 3.55% | 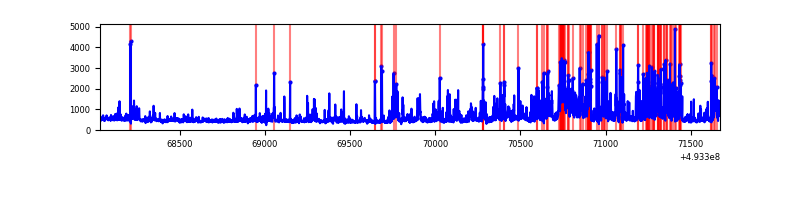 |
Top three noisy pixels from each quadrant. If the there are fewer than three noisy pixels in the level2.evt file, extra rows are filled as -1
| Pixel properties | Quadrant properties | ||||||
|---|---|---|---|---|---|---|---|
| Quadrant | DetID | PixID | Counts | Sigma | Mean | Median | Sigma |
| A | 15 | 174 | 456687 | 4671.27 | 389 | 380 | 97.7 |
| A | 3 | 63 | 168908 | 1725.24 | 389 | 380 | 97.7 |
| A | 3 | 62 | 117260 | 1196.52 | 389 | 380 | 97.7 |
| B | 5 | 185 | 29453 | 349.33 | 384 | 371 | 83.2 |
| B | 10 | 28 | 21542 | 254.31 | 384 | 371 | 83.2 |
| B | 10 | 247 | 18384 | 216.37 | 384 | 371 | 83.2 |
| C | 9 | 38 | 3161096 | 51157.34 | 221 | 220 | 61.8 |
| C | 7 | 64 | 3036988 | 49148.71 | 221 | 220 | 61.8 |
| C | 1 | 241 | 928214 | 15019.16 | 221 | 220 | 61.8 |
| D | 12 | 2 | 369728 | 3480.9 | 371 | 355 | 106.1 |
| D | 3 | 12 | 334665 | 3150.47 | 371 | 355 | 106.1 |
| D | 6 | 239 | 101481 | 952.99 | 371 | 355 | 106.1 |
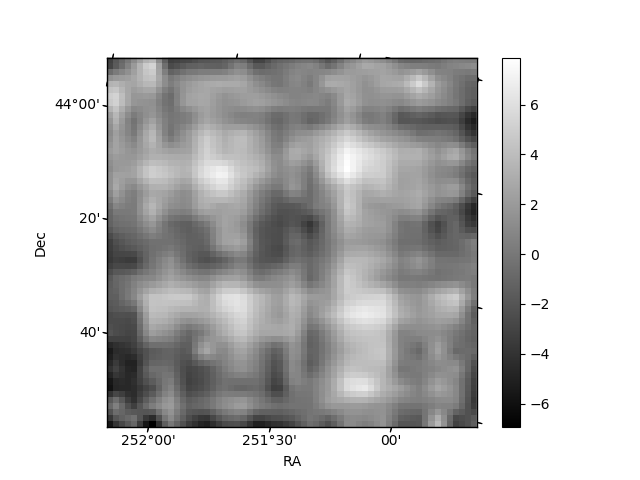
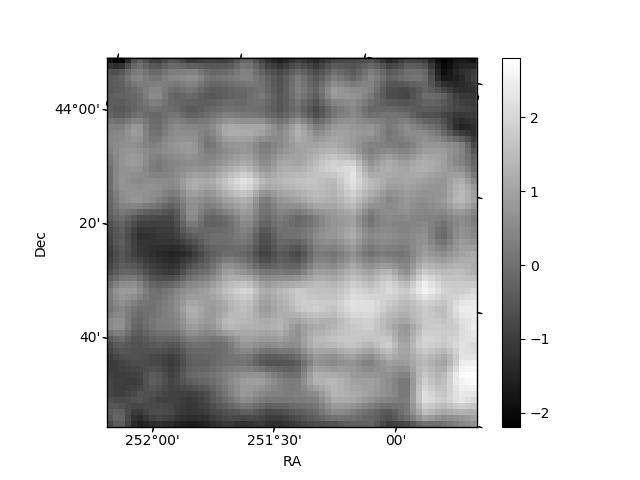
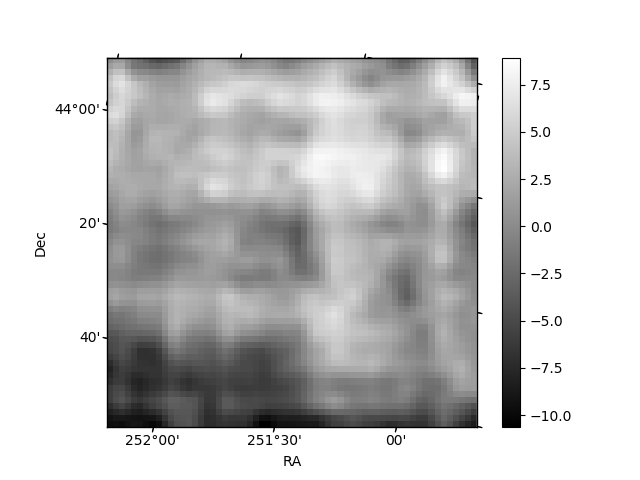
Histogram calculated using DETX and DETY for each event in the final _common_clean file
| Quadrant A | 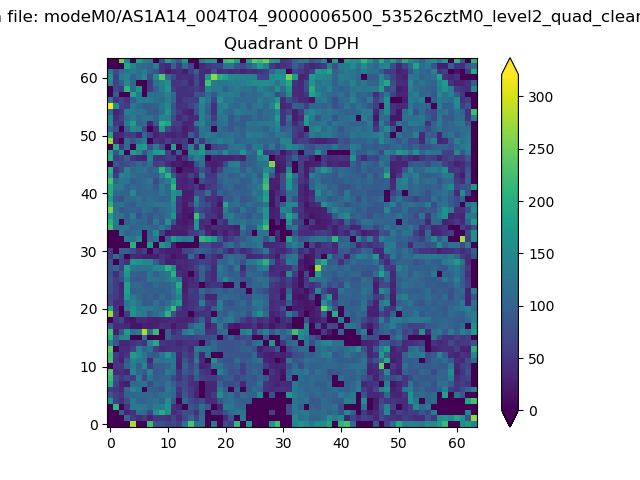 |
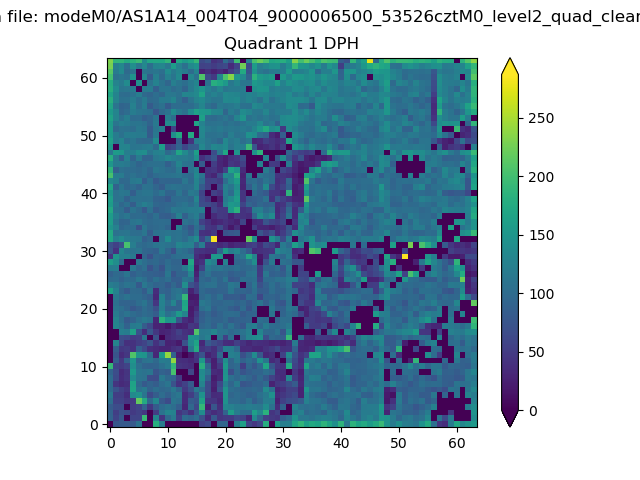 |
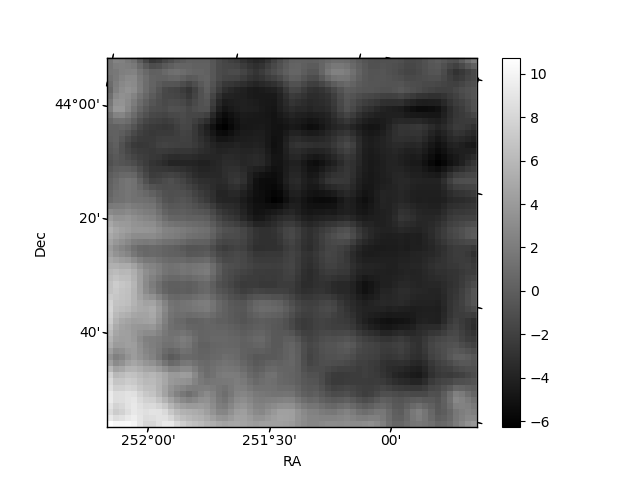
Quadrant B |
|---|---|---|---|
| Quadrant D | 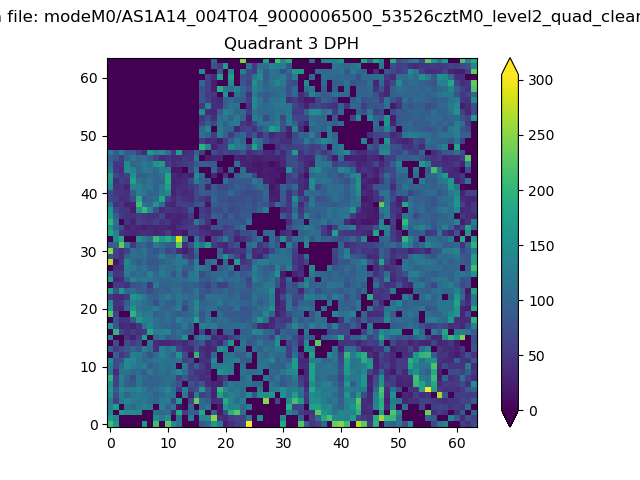 |
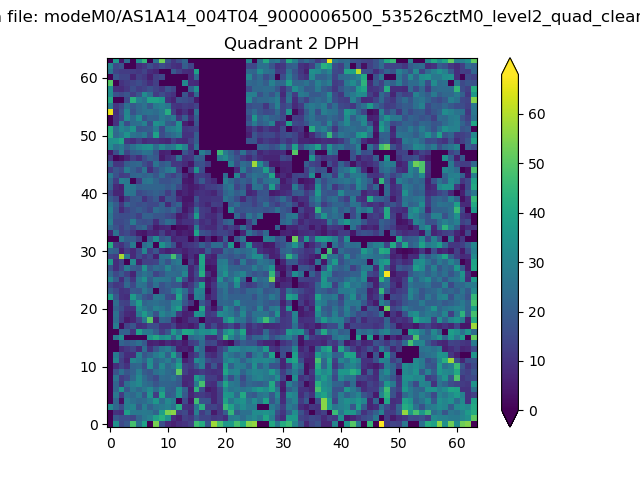 |
Quadrant C |
| Plot type | Count rate plots | Images |
|---|---|---|
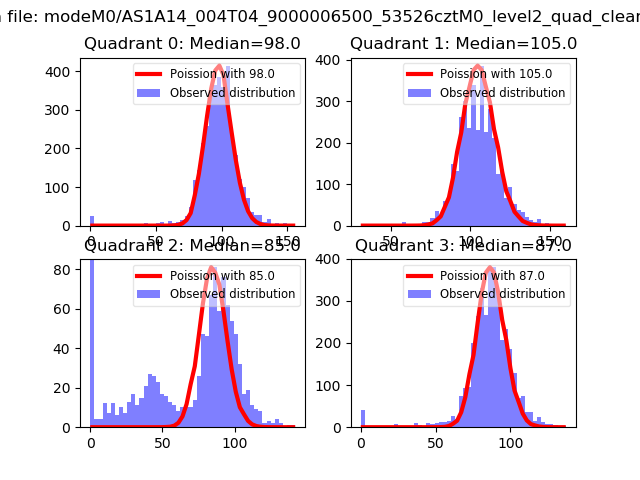
| Comparison with Poisson distribution Blue bars denote a histogram of data divided into 1 sec bins. Red curve is a Poisson curve with rate = median count rate of data. |
 |
 |
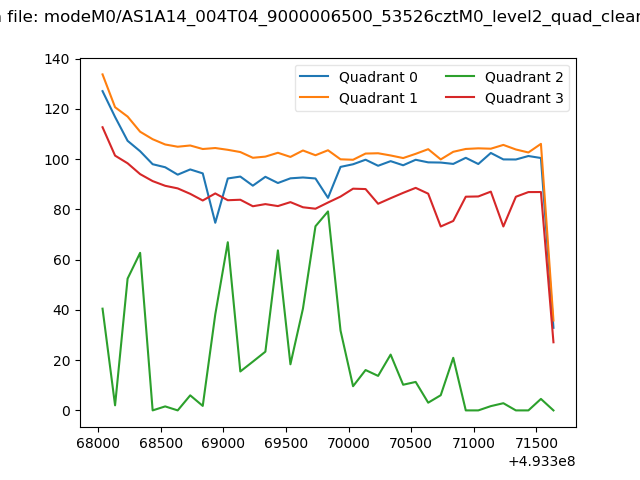
| Quadrant-wise count rates Data is divided into 100 sec bins |
 |
|
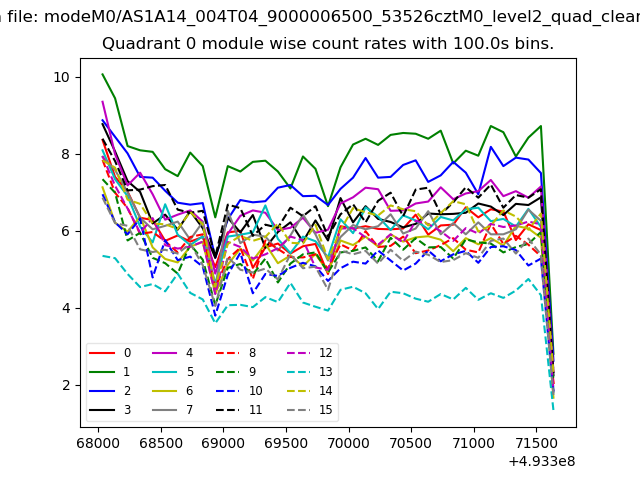
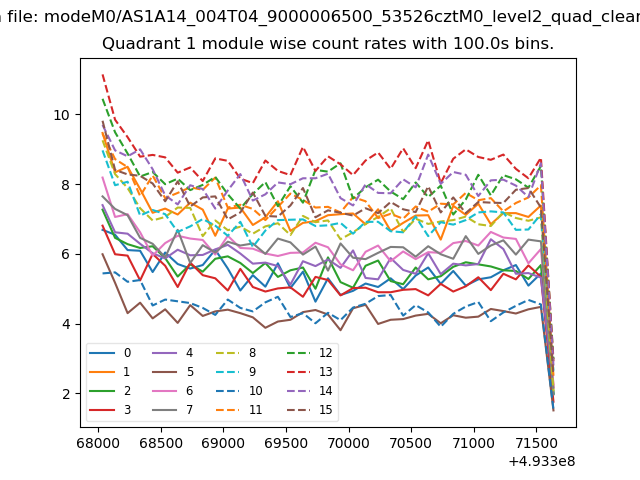
| Module-wise count rates for Quadrant A Data is divided into 100 sec bins |
 |
 |
| Module-wise count rates for Quadrant B Data is divided into 100 sec bins |
 |
 |
| Module-wise count rates for Quadrant C Data is divided into 100 sec bins |
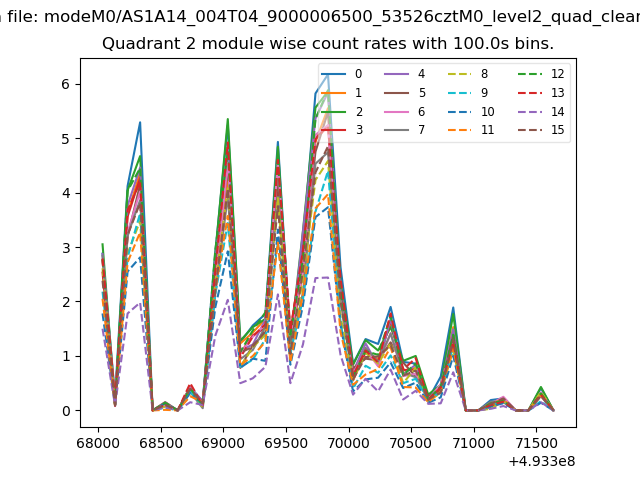 |
 |
| Module-wise count rates for Quadrant D Data is divided into 100 sec bins |
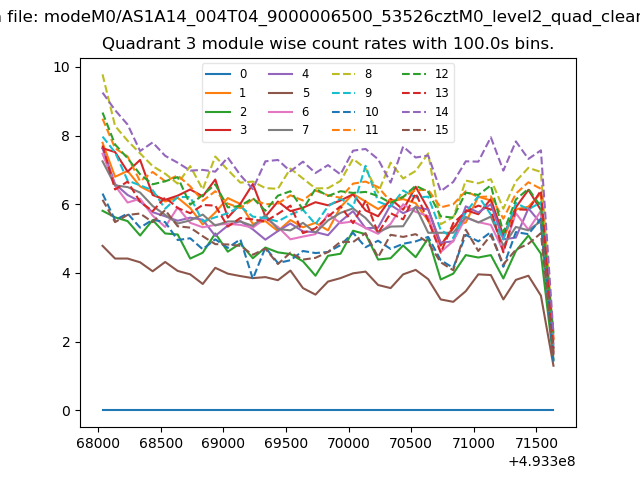 |
 |
| Parameter | Plot |
|---|---|
| CZT HV Monitor | 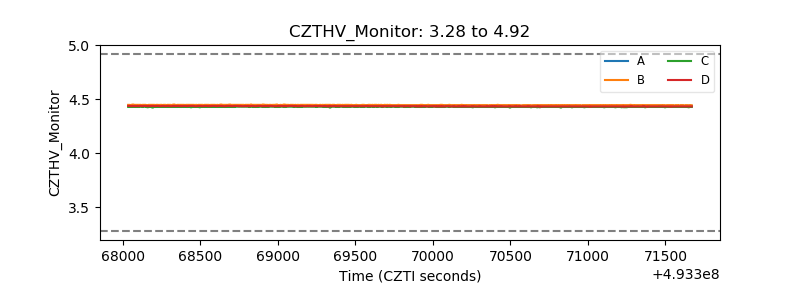 |
| D_VDD | 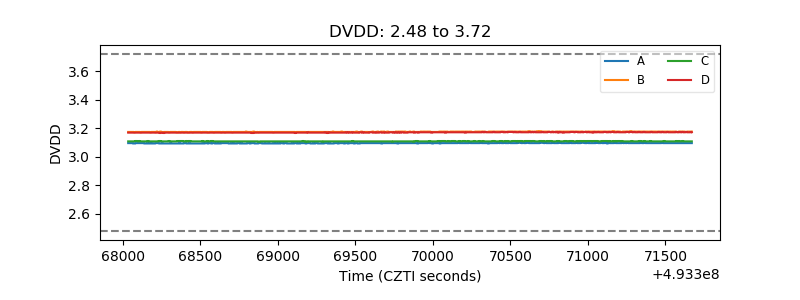 |
| Temperature 1 | 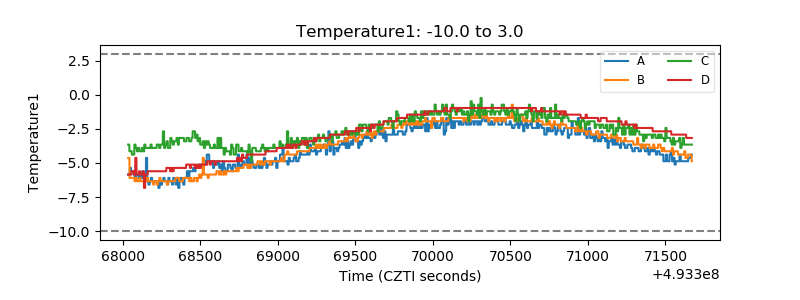 |
| Veto HV Monitor | 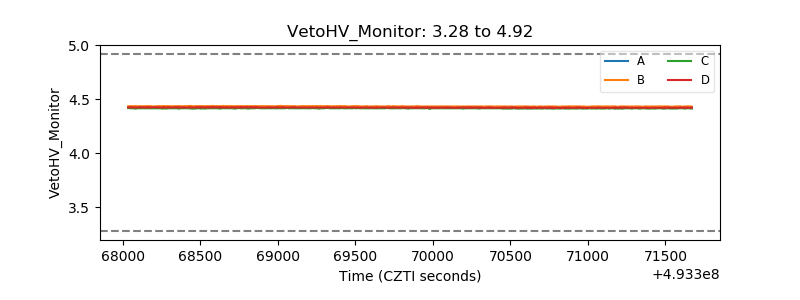 |
| Veto LLD | 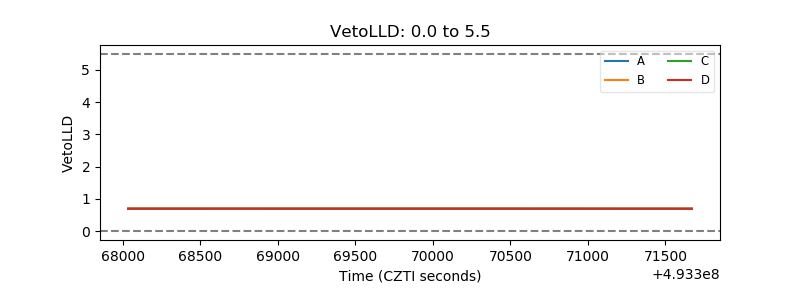 |
| Alpha Counter | 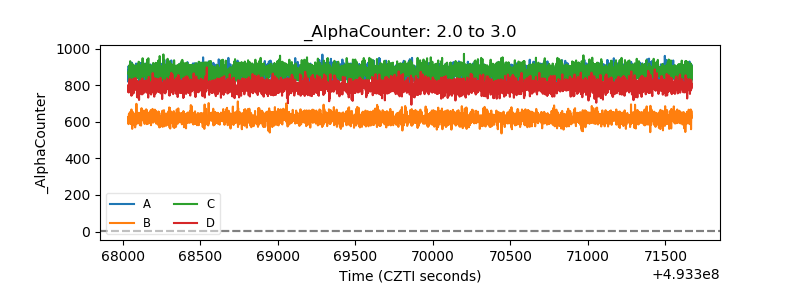 |
| _CPM_Rate | 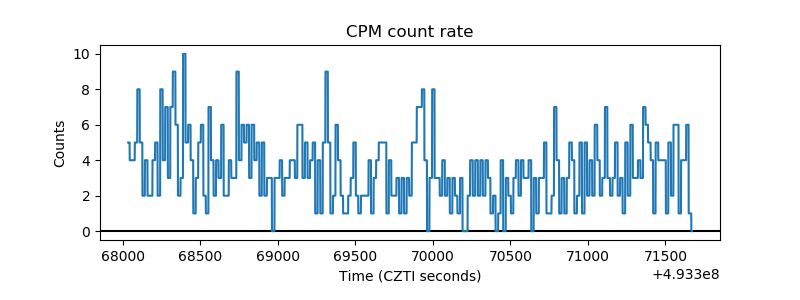 |
| CZT Counter | 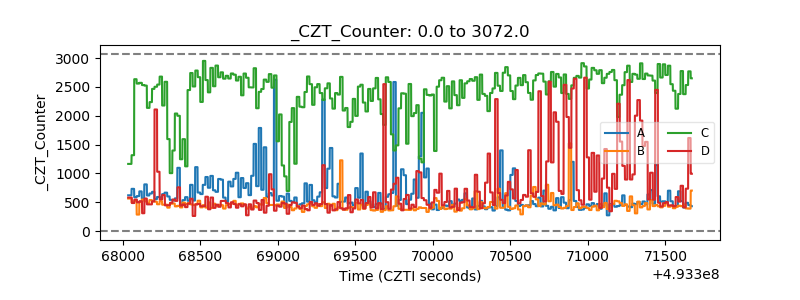 |
| +2.5 Volts monitor |  |
| +5 Volts monitor |  |
| _ROLL_ROT | 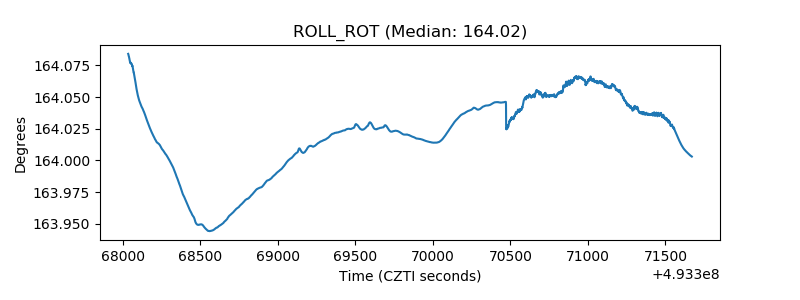 |
| _Roll_DEC | 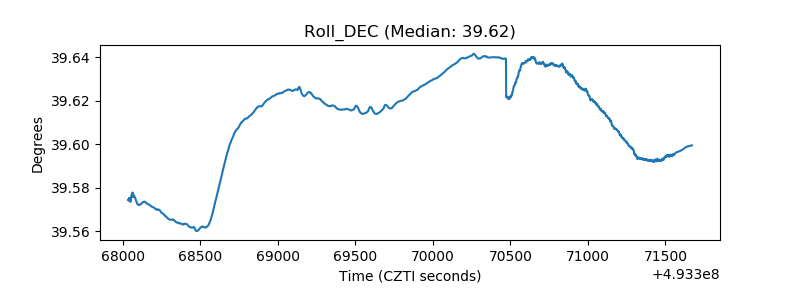 |
| _Roll_RA | 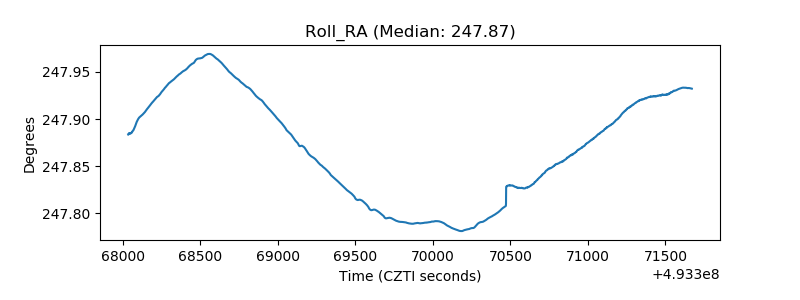 |
| Veto Counter | 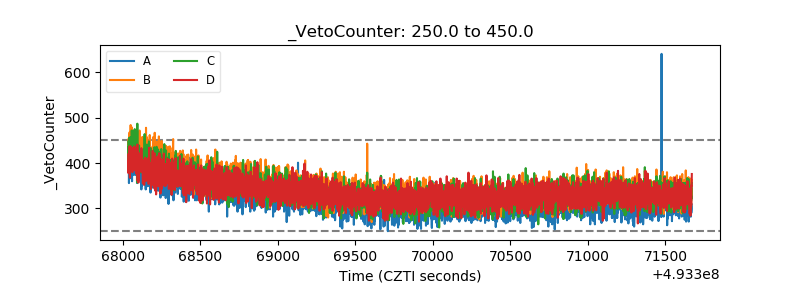 |