| Param | Original file | Final file |
|---|---|---|
| Filename | modeM0/AS1A14_004T04_9000006500_53531cztM0_level2.fits | modeM0/AS1A14_004T04_9000006500_53531cztM0_level2_quad_clean.evt |
| Size (bytes) | 1,272,447,360 | 148,345,920 |
| Size | 1.2 GB | 141.5 MB |
| Events in quadrant A | 8,864,722 | 1,093,757 |
| Events in quadrant B | 6,018,722 | 1,187,068 |
| Events in quadrant C | 22,722,177 | 462,181 |
| Events in quadrant D | 8,644,726 | 985,630 |
| Mode SS | |||
|---|---|---|---|
| Quadrant | BADHDUFLAG | Total packets | Discarded packets |
| A | 0 | 224 | 0 |
| B | 0 | 224 | 0 |
| C | 0 | 224 | 0 |
| D | 0 | 224 | 0 |
| Mode M0 | |||
|---|---|---|---|
| Quadrant | BADHDUFLAG | Total packets | Discarded packets |
| A | 0 | 33875 | 2 |
| B | 0 | 25619 | 2 |
| C | 0 | 75074 | 2 |
| D | 0 | 33336 | 2 |
| Mode M9 | |||
|---|---|---|---|
| Quadrant | BADHDUFLAG | Total packets | Discarded packets |
| A | 0 | 17 | 0 |
| B | 0 | 17 | 0 |
| C | 0 | 17 | 0 |
| D | 0 | 17 | 0 |
| Quadrant | Total seconds | Saturated seconds | Saturation percentage |
|---|---|---|---|
| A | 11022 | 773 | 7.013246% |
| B | 11022 | 418 | 3.792415% |
| C | 11022 | 6937 | 62.937761% |
| D | 11023 | 737 | 6.686020% |
Noise dominated data is calculated using 1-second bins in cleaned event files. If a bin has >2000 counts, and if more than 50% of those come from <1% of pixels, then it is considered to be noise-dominated and hence unusable.
| Quadrant | # 1 sec bins | Bins with >0 counts | Bins with >2000 counts | High rate bins dominated by noise | Noise dominated (total time) | Noise dominated (detector-on time) | Marked lightcurve |
|---|---|---|---|---|---|---|---|
| A | 12717 | 11022 | 512 | 512 | 4.03% | 4.65% | 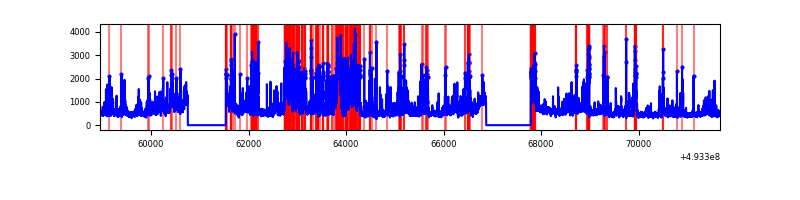 |
| B | 12717 | 11022 | 164 | 164 | 1.29% | 1.49% | 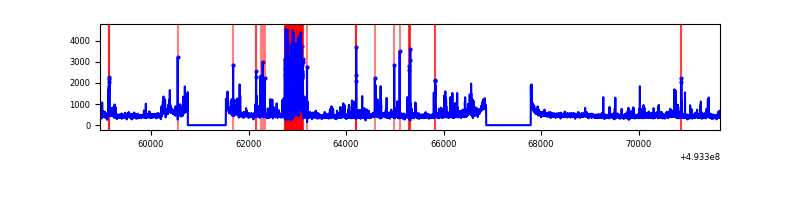 |
| C | 12717 | 11023 | 6455 | 6455 | 50.76% | 58.56% | 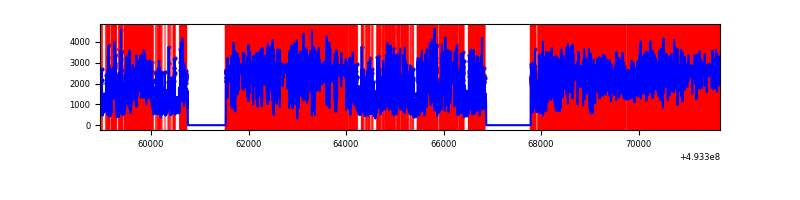 |
| D | 12718 | 11024 | 525 | 525 | 4.13% | 4.76% | 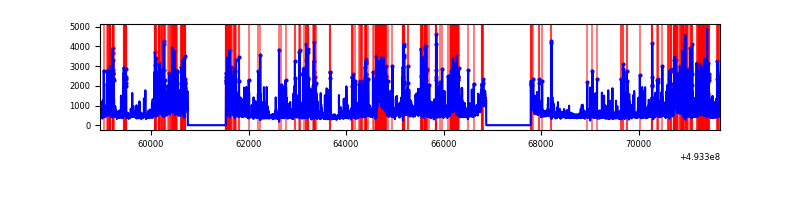 |
Top three noisy pixels from each quadrant. If the there are fewer than three noisy pixels in the level2.evt file, extra rows are filled as -1
| Pixel properties | Quadrant properties | ||||||
|---|---|---|---|---|---|---|---|
| Quadrant | DetID | PixID | Counts | Sigma | Mean | Median | Sigma |
| A | 3 | 62 | 1785202 | 5817.75 | 1223 | 1192 | 306.6 |
| A | 15 | 174 | 1241501 | 4044.71 | 1223 | 1192 | 306.6 |
| A | 3 | 63 | 749323 | 2439.69 | 1223 | 1192 | 306.6 |
| B | 2 | 249 | 613403 | 2386.74 | 1206 | 1163 | 256.5 |
| B | 5 | 185 | 232457 | 901.67 | 1206 | 1163 | 256.5 |
| B | 10 | 28 | 105077 | 405.09 | 1206 | 1163 | 256.5 |
| C | 7 | 64 | 10649387 | 46888.63 | 812 | 804 | 227.1 |
| C | 1 | 241 | 3542227 | 15593.86 | 812 | 804 | 227.1 |
| C | 9 | 38 | 3162044 | 13919.81 | 812 | 804 | 227.1 |
| D | 12 | 1 | 643433 | 1879.81 | 1191 | 1139 | 341.7 |
| D | 6 | 239 | 641053 | 1872.85 | 1191 | 1139 | 341.7 |
| D | 12 | 2 | 495277 | 1446.2 | 1191 | 1139 | 341.7 |
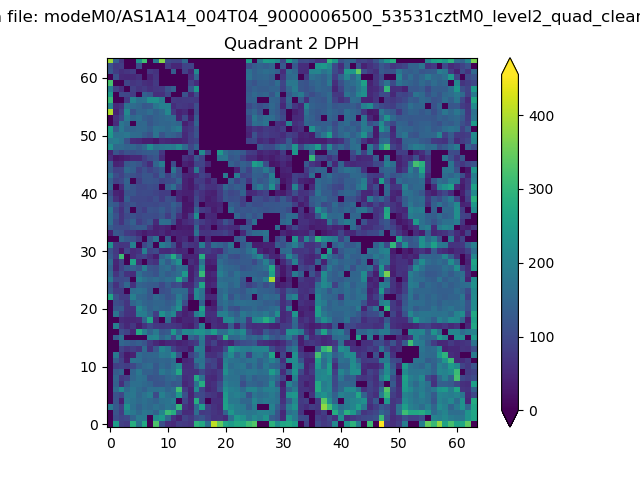
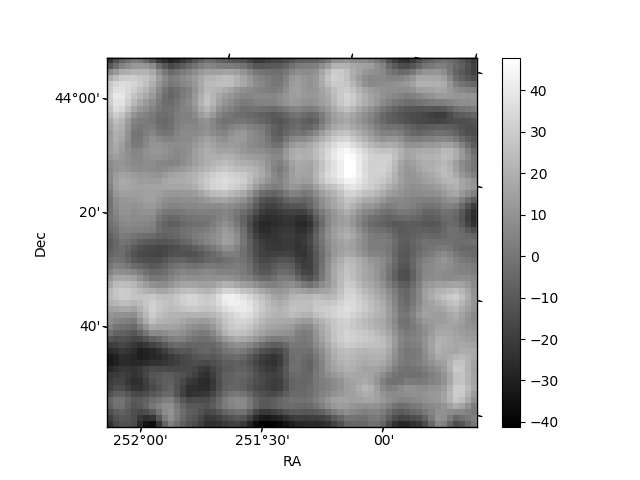
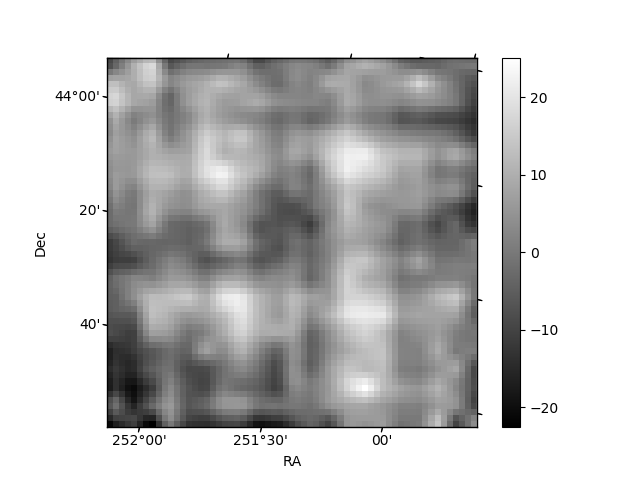
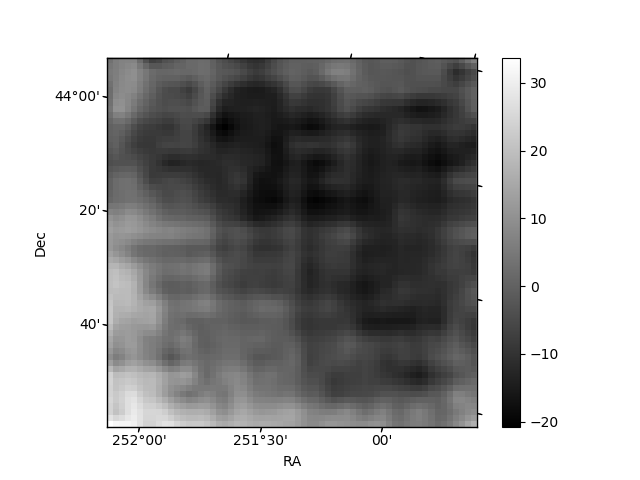
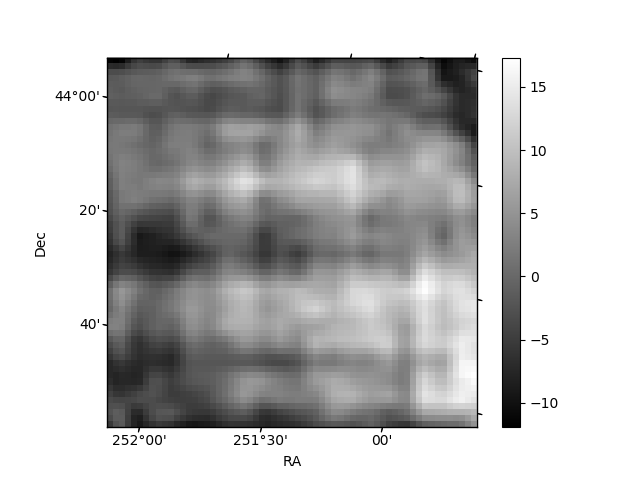
Histogram calculated using DETX and DETY for each event in the final _common_clean file
| Quadrant A | 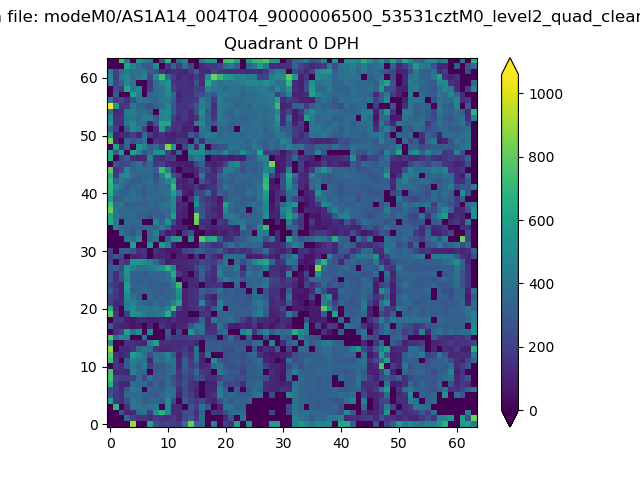 |
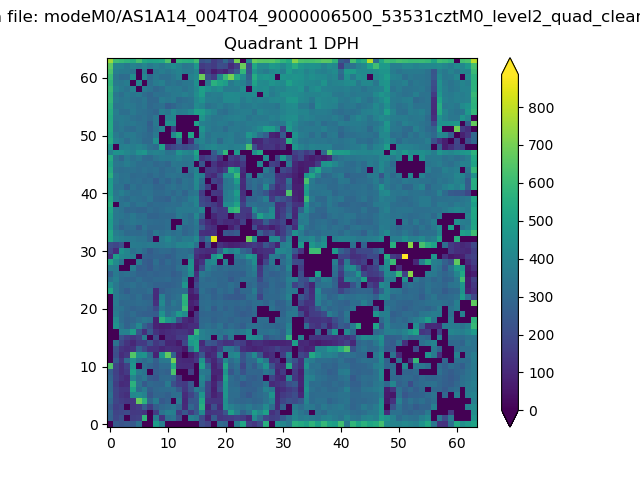 |
Quadrant B |
|---|---|---|---|
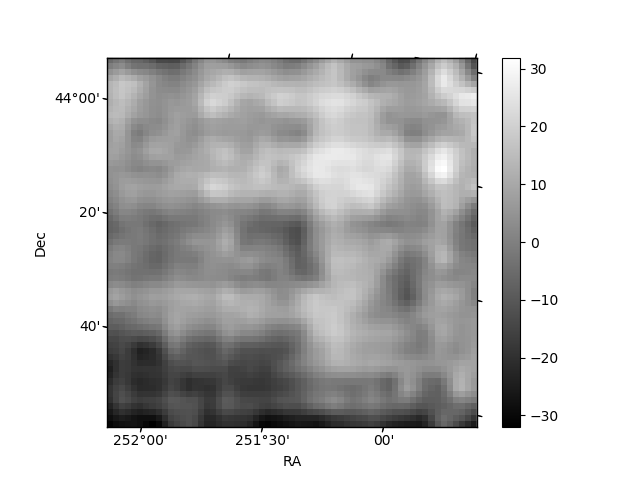
| Quadrant D | 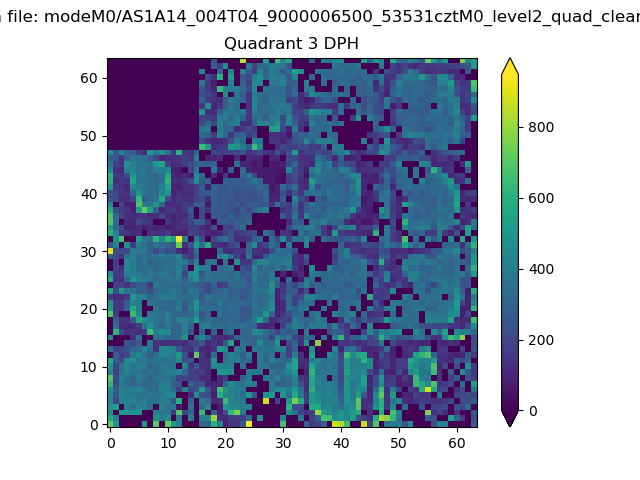 |
 |
Quadrant C |
| Plot type | Count rate plots | Images |
|---|---|---|
| Comparison with Poisson distribution Blue bars denote a histogram of data divided into 1 sec bins. Red curve is a Poisson curve with rate = median count rate of data. |
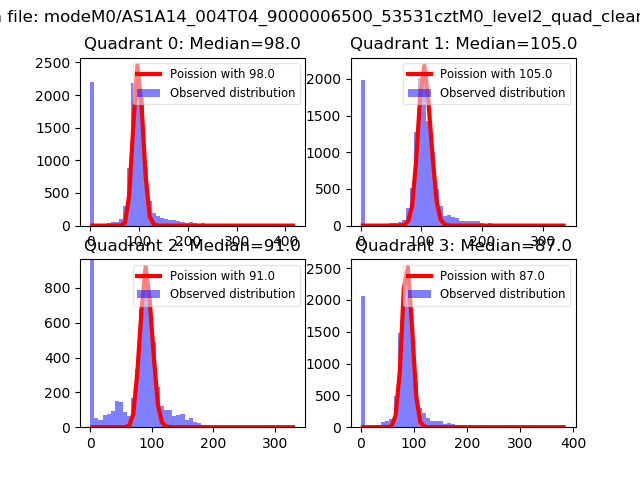 |
 |
| Quadrant-wise count rates Data is divided into 100 sec bins |
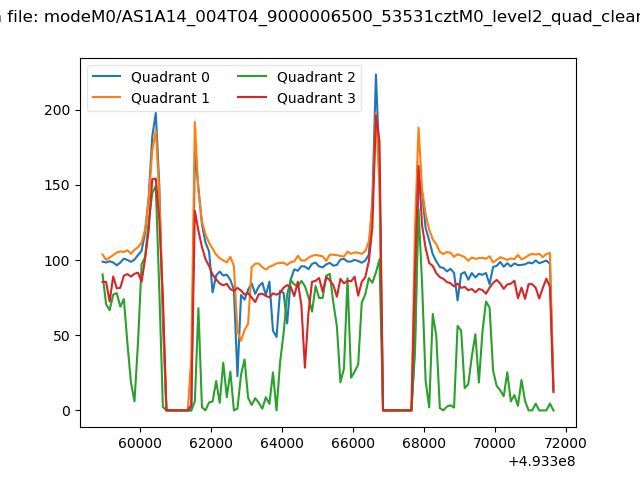 |
|
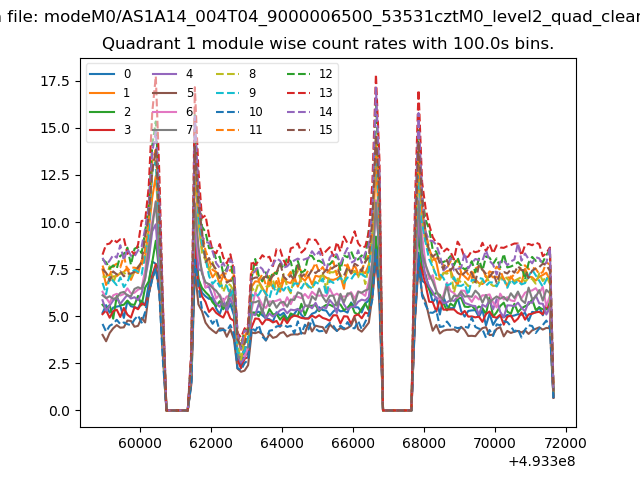
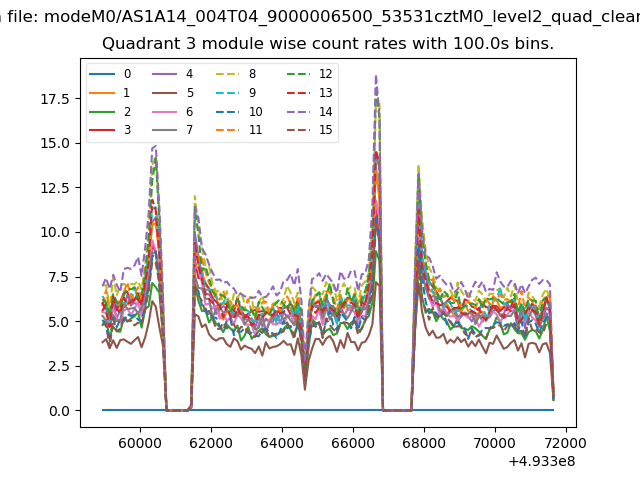
| Module-wise count rates for Quadrant A Data is divided into 100 sec bins |
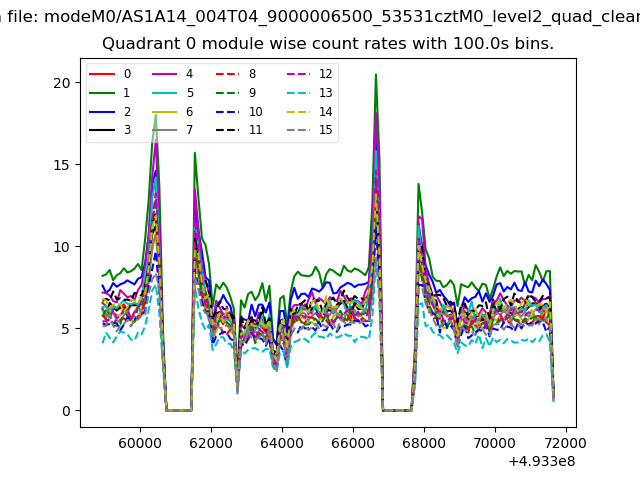 |
 |
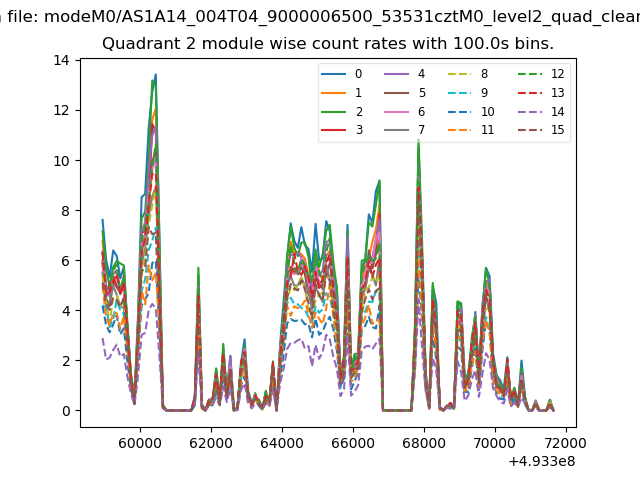
| Module-wise count rates for Quadrant B Data is divided into 100 sec bins |
 |
 |
| Module-wise count rates for Quadrant C Data is divided into 100 sec bins |
 |
 |
| Module-wise count rates for Quadrant D Data is divided into 100 sec bins |
 |
 |
| Parameter | Plot |
|---|---|
| CZT HV Monitor | 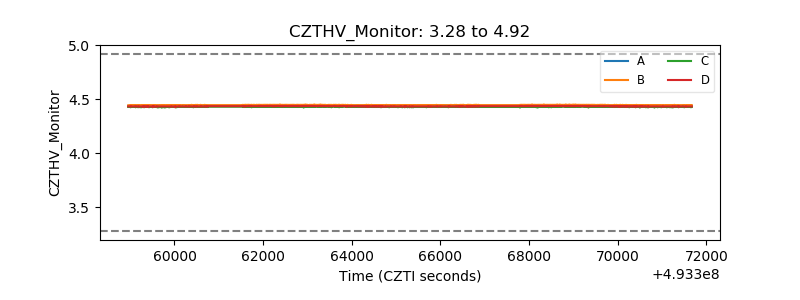 |
| D_VDD | 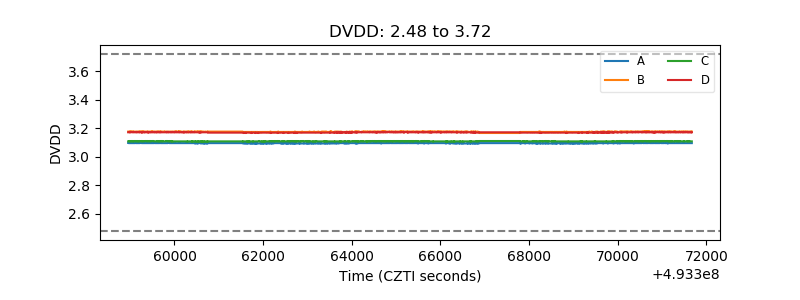 |
| Temperature 1 | 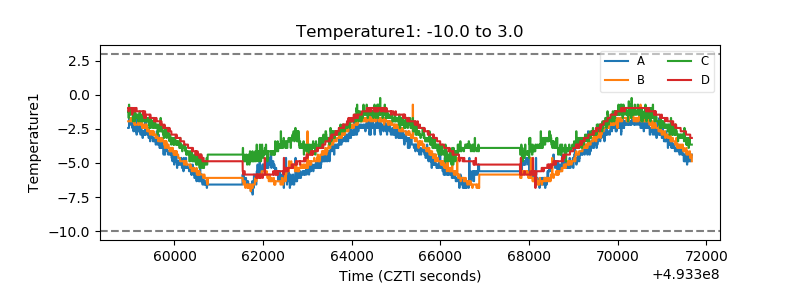 |
| Veto HV Monitor | 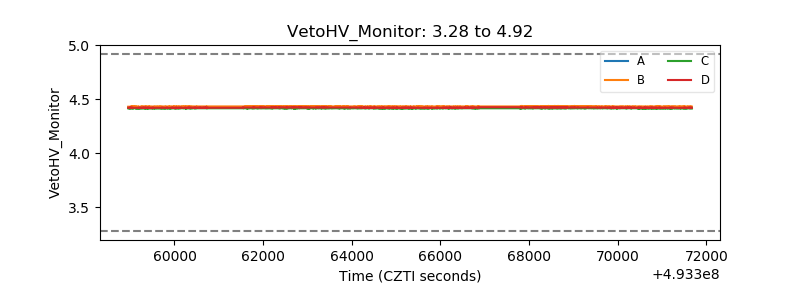 |
| Veto LLD | 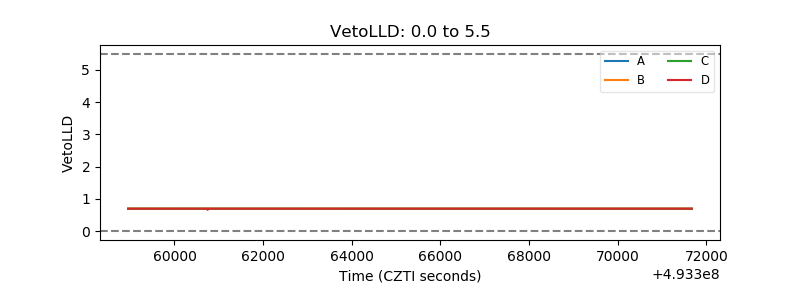 |
| Alpha Counter | 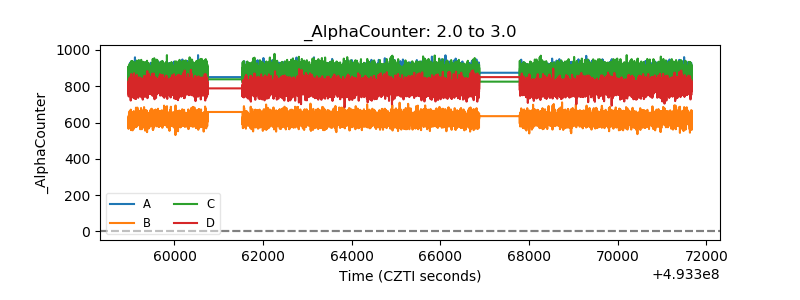 |
| _CPM_Rate | 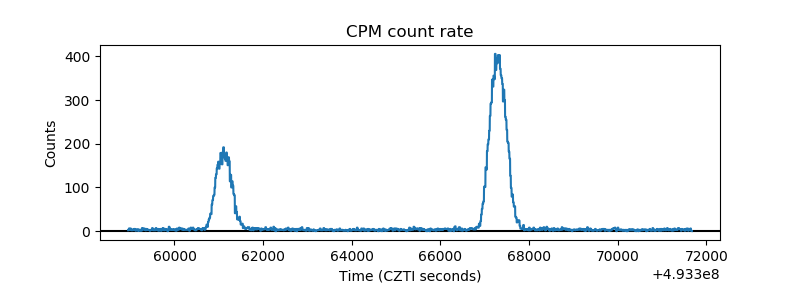 |
| CZT Counter | 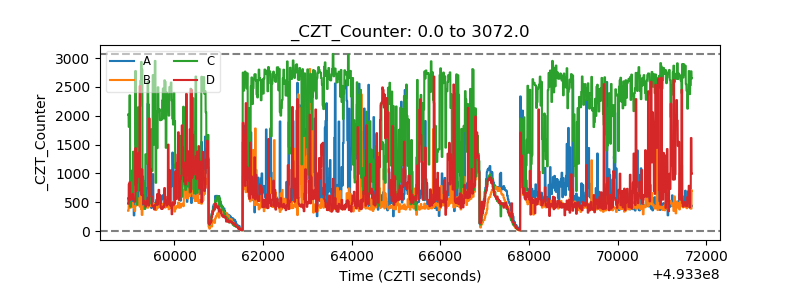 |
| +2.5 Volts monitor |  |
| +5 Volts monitor |  |
| _ROLL_ROT | 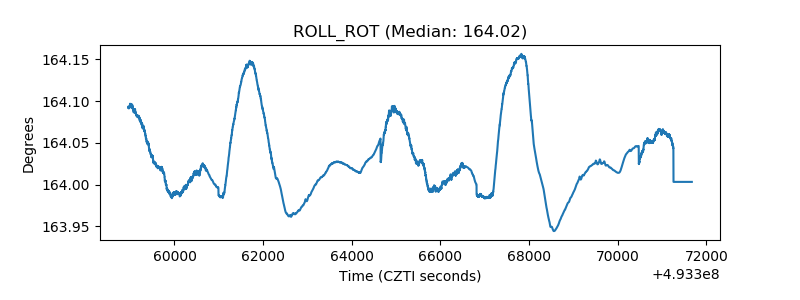 |
| _Roll_DEC | 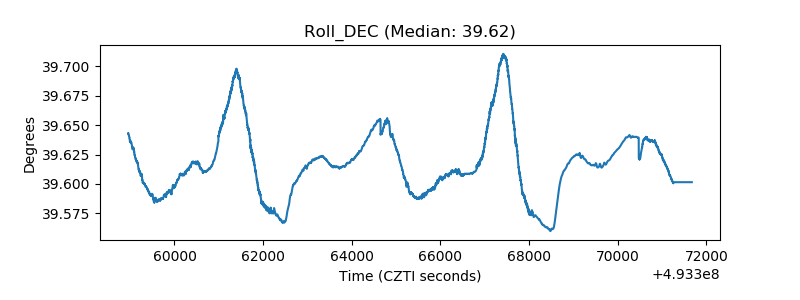 |
| _Roll_RA |  |
| Veto Counter | 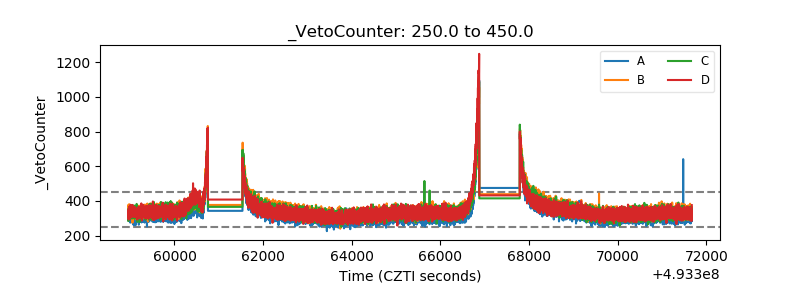 |