| Param | Original file | Final file |
|---|---|---|
| Filename | modeM0/AS1A14_004T05_9000006502cztM0_level2.fits | modeM0/AS1A14_004T05_9000006502cztM0_level2_quad_clean.evt |
| Size (bytes) | 3,932,375,040 | 1,498,348,800 |
| Size | 3.7 GB | 1.4 GB |
| Events in quadrant A | 22,305,718 | 2,596,524 |
| Events in quadrant B | 23,974,216 | 3,466,239 |
| Events in quadrant C | 19,680,476 | 1,982,360 |
| Events in quadrant D | 17,372,648 | 1,795,559 |
| Mode M9 | |||
|---|---|---|---|
| Quadrant | BADHDUFLAG | Total packets | Discarded packets |
| A | 0 | 623 | 0 |
| B | 0 | 623 | 0 |
| C | 0 | 623 | 0 |
| D | 0 | 623 | 0 |
| Mode SS | |||
|---|---|---|---|
| Quadrant | BADHDUFLAG | Total packets | Discarded packets |
| A | 0 | 10524 | 0 |
| B | 0 | 10524 | 0 |
| C | 0 | 10524 | 0 |
| D | 0 | 10524 | 0 |
| Mode M0 | |||
|---|---|---|---|
| Quadrant | BADHDUFLAG | Total packets | Discarded packets |
| A | 0 | 2281079 | 0 |
| B | 0 | 1533571 | 0 |
| C | 0 | 2563596 | 0 |
| D | 0 | 2298957 | 0 |
| Quadrant | Total seconds | Saturated seconds | Saturation percentage |
|---|---|---|---|
| A | 518329 | 153280 | 29.571951% |
| B | 518328 | 45322 | 8.743884% |
| C | 518329 | 186332 | 35.948596% |
| D | 518327 | 159647 | 30.800441% |
Noise dominated data is calculated using 1-second bins in cleaned event files. If a bin has >2000 counts, and if more than 50% of those come from <1% of pixels, then it is considered to be noise-dominated and hence unusable.
| Quadrant | # 1 sec bins | Bins with >0 counts | Bins with >2000 counts | High rate bins dominated by noise | Noise dominated (total time) | Noise dominated (detector-on time) | Marked lightcurve |
|---|---|---|---|---|---|---|---|
| A | 599707 | 516312 | 0 | 0 | 0.00% | 0.00% | 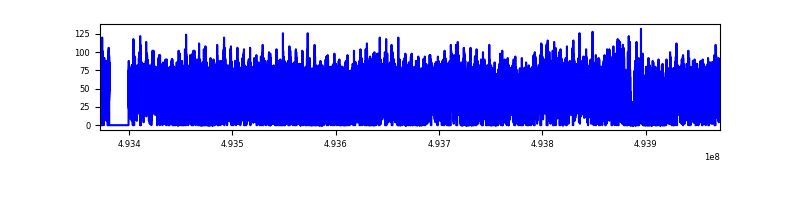 |
| B | 599707 | 517722 | 0 | 0 | 0.00% | 0.00% | 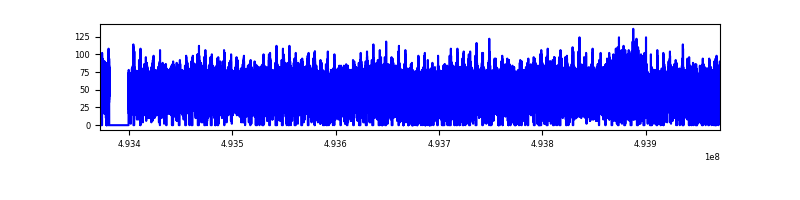 |
| C | 599707 | 506731 | 0 | 0 | 0.00% | 0.00% | 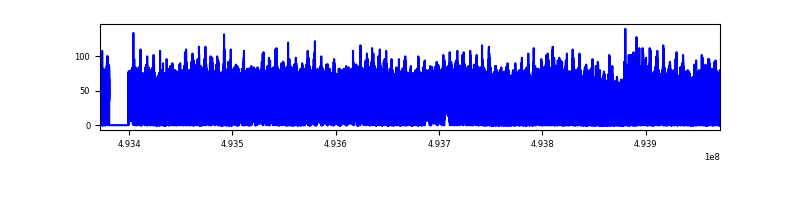 |
| D | 599707 | 476813 | 0 | 0 | 0.00% | 0.00% | 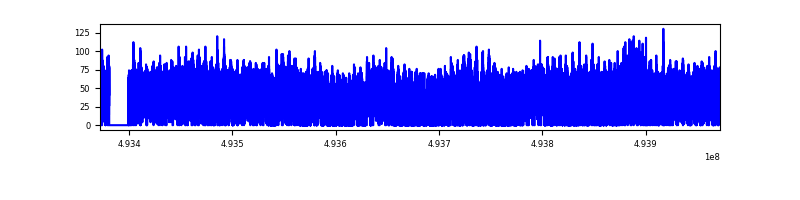 |
Top three noisy pixels from each quadrant. If the there are fewer than three noisy pixels in the level2.evt file, extra rows are filled as -1
| Pixel properties | Quadrant properties | ||||||
|---|---|---|---|---|---|---|---|
| Quadrant | DetID | PixID | Counts | Sigma | Mean | Median | Sigma |
| A | 14 | 188 | 25156 | 10.12 | 5880 | 5425 | 1949.5 |
| A | 9 | 255 | 23173 | 9.1 | 5880 | 5425 | 1949.5 |
| A | 14 | 204 | 20255 | 7.61 | 5880 | 5425 | 1949.5 |
| B | 2 | 9 | 27471 | 14.41 | 6370 | 6018 | 1488.6 |
| B | 2 | 8 | 24758 | 12.59 | 6370 | 6018 | 1488.6 |
| B | 3 | 25 | 19721 | 9.21 | 6370 | 6018 | 1488.6 |
| C | 15 | 175 | 16402 | 6.4 | 5287 | 4811 | 1809.7 |
| C | 15 | 255 | 15704 | 6.02 | 5287 | 4811 | 1809.7 |
| C | 2 | 31 | 15444 | 5.88 | 5287 | 4811 | 1809.7 |
| D | 6 | 218 | 22274 | 10.62 | 4994 | 4422 | 1681.3 |
| D | 15 | 11 | 16990 | 7.47 | 4994 | 4422 | 1681.3 |
| D | 3 | 30 | 15778 | 6.75 | 4994 | 4422 | 1681.3 |
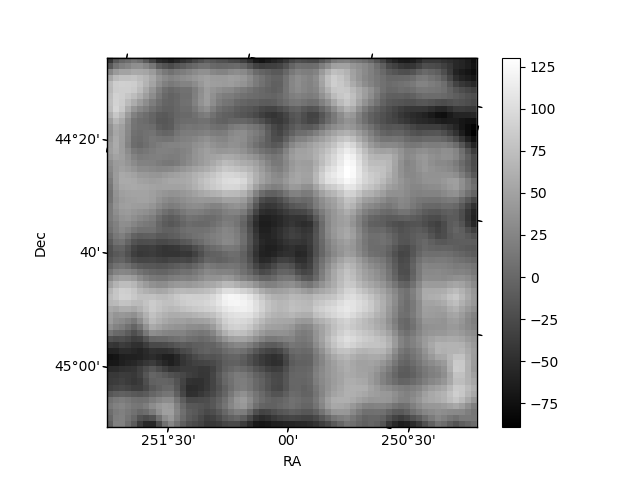
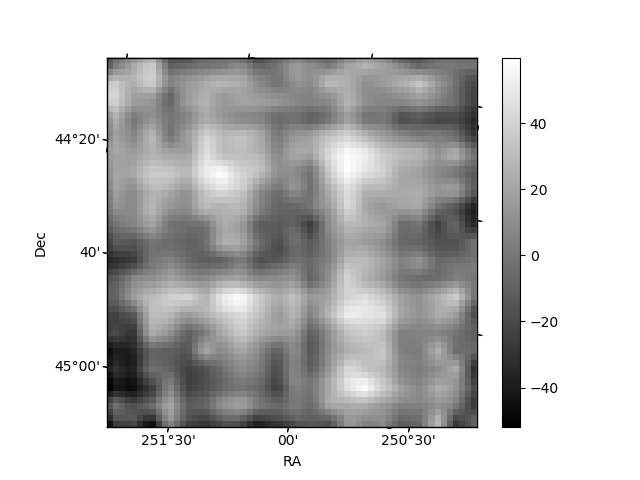
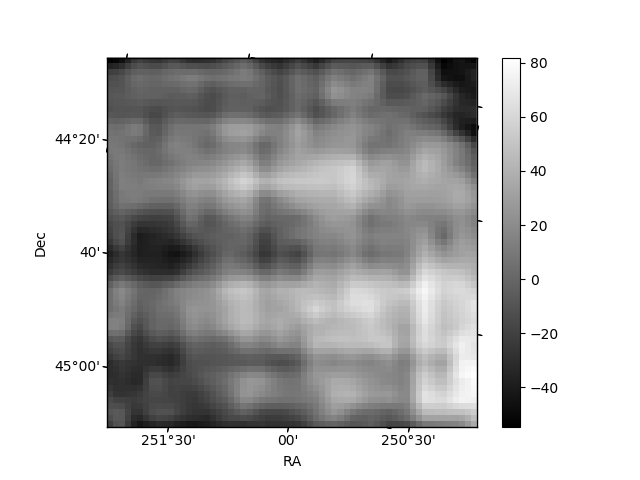
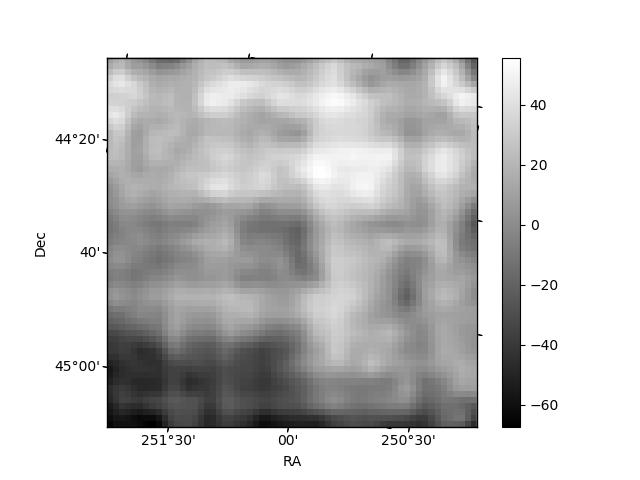
Histogram calculated using DETX and DETY for each event in the final _common_clean file
| Quadrant A | 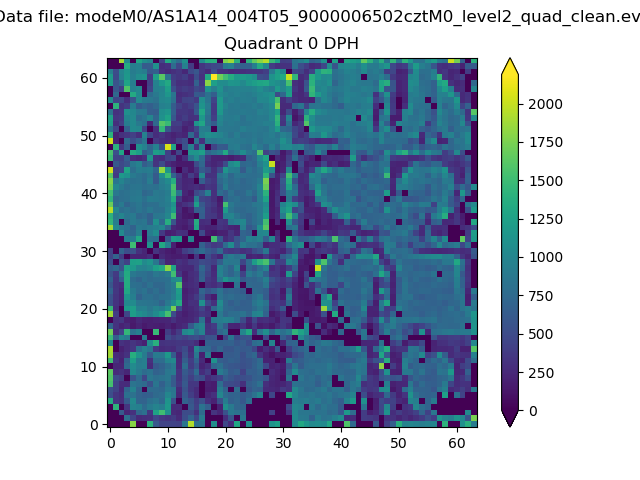 |
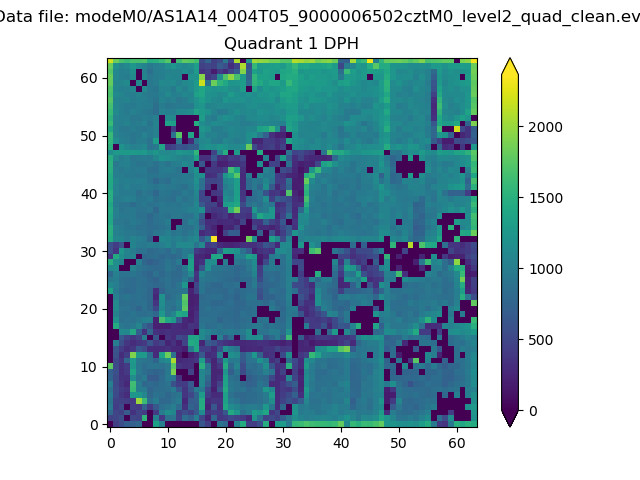 |
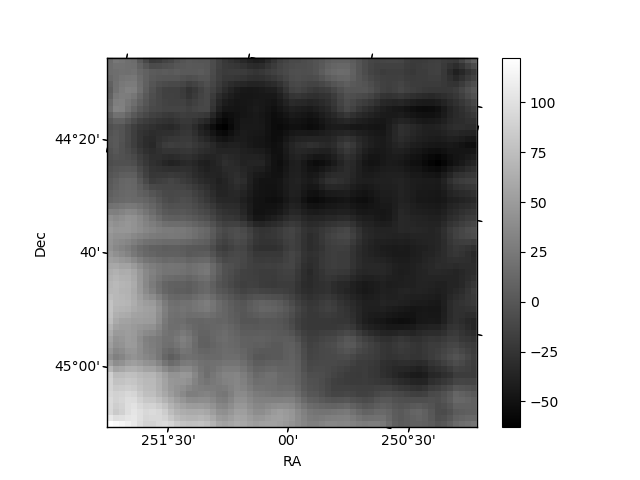
Quadrant B |
|---|---|---|---|
| Quadrant D | 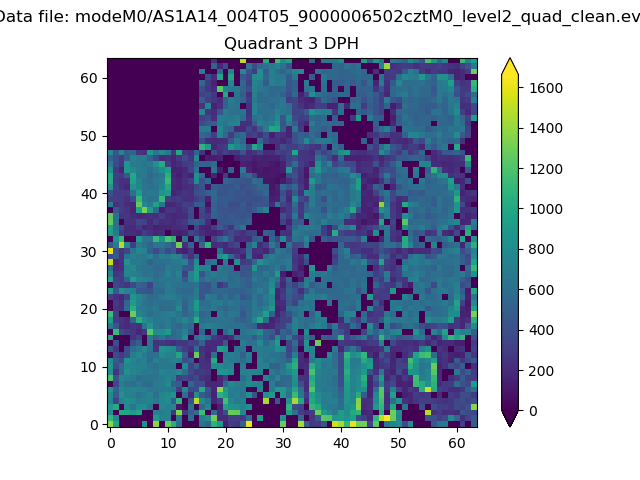 |
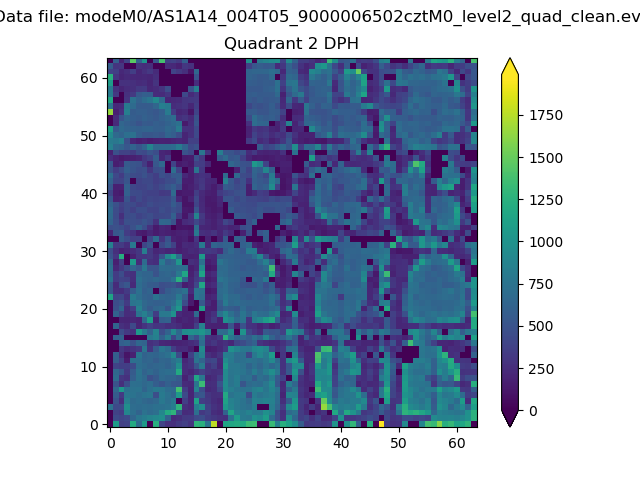 |
Quadrant C |
| Plot type | Count rate plots | Images |
|---|---|---|
| Comparison with Poisson distribution Blue bars denote a histogram of data divided into 1 sec bins. Red curve is a Poisson curve with rate = median count rate of data. |
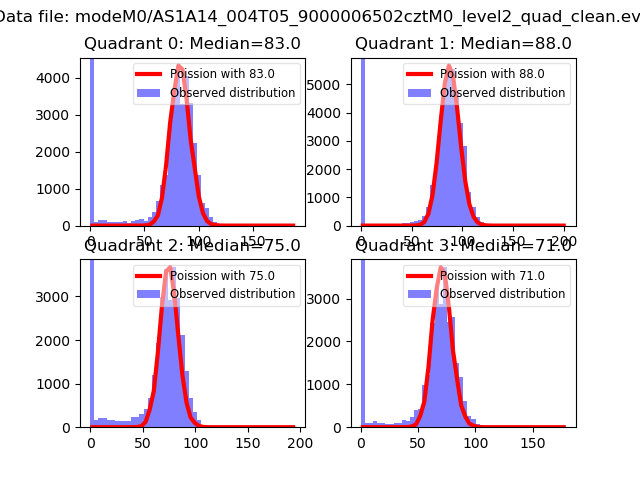 |
 |
| Quadrant-wise count rates Data is divided into 100 sec bins |
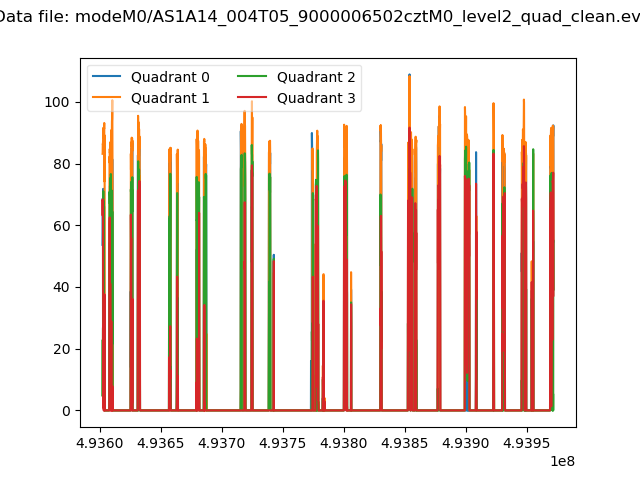 |
|
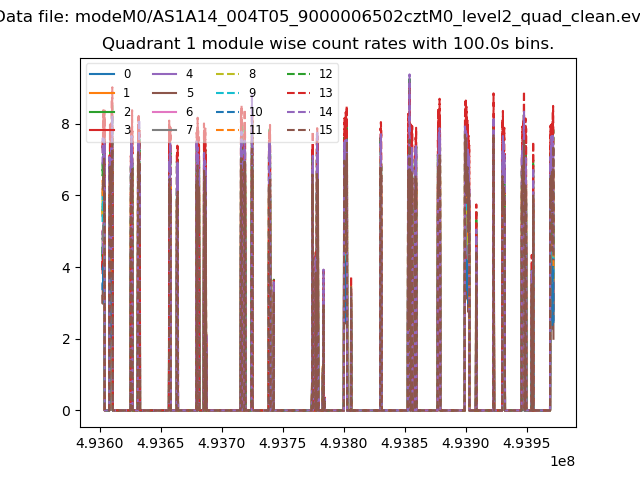
| Module-wise count rates for Quadrant A Data is divided into 100 sec bins |
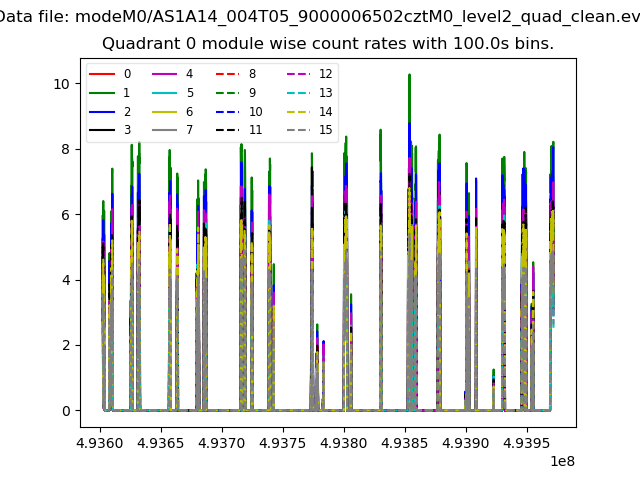 |
 |
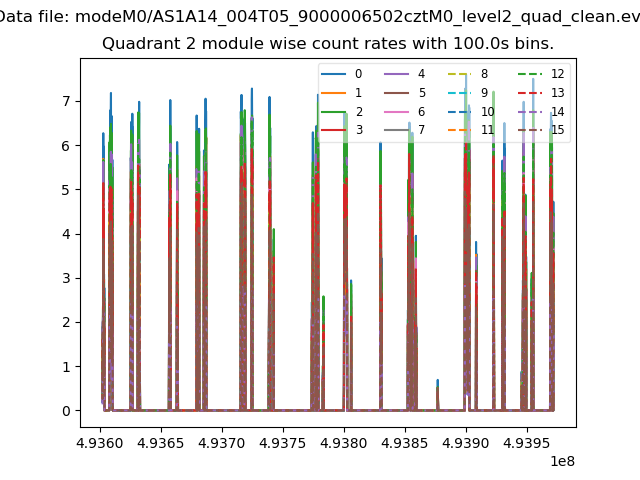
| Module-wise count rates for Quadrant B Data is divided into 100 sec bins |
 |
 |
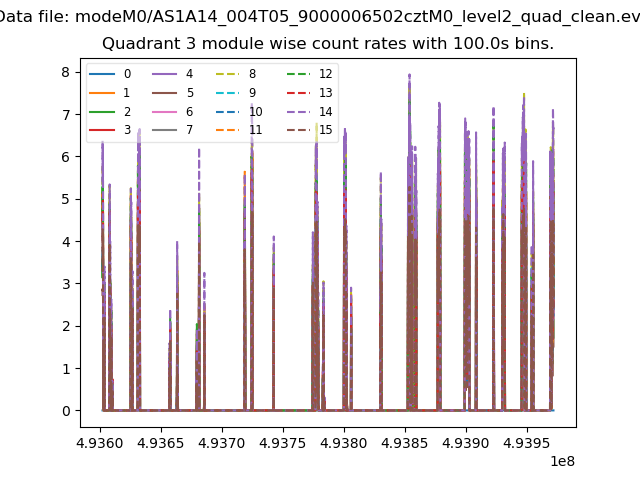
| Module-wise count rates for Quadrant C Data is divided into 100 sec bins |
 |
 |
| Module-wise count rates for Quadrant D Data is divided into 100 sec bins |
 |
 |
| Parameter | Plot |
|---|---|
| CZT HV Monitor | 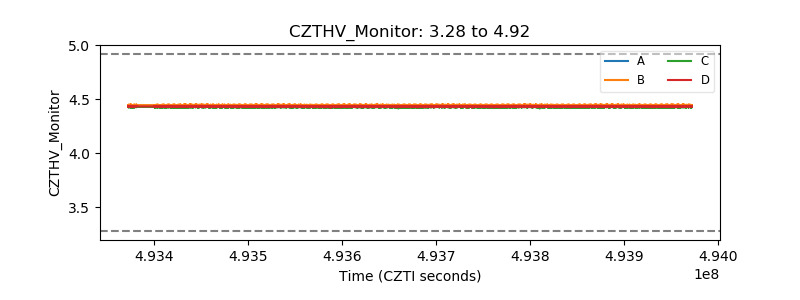 |
| D_VDD | 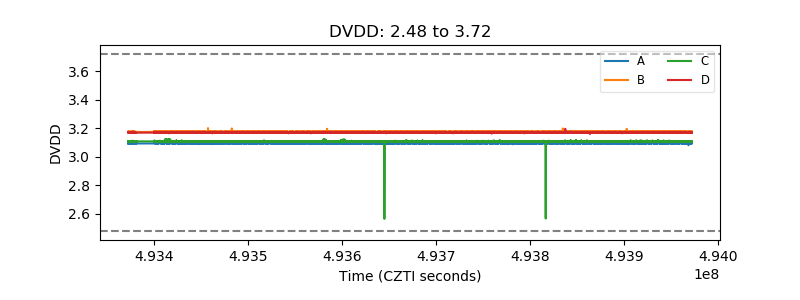 |
| Temperature 1 | 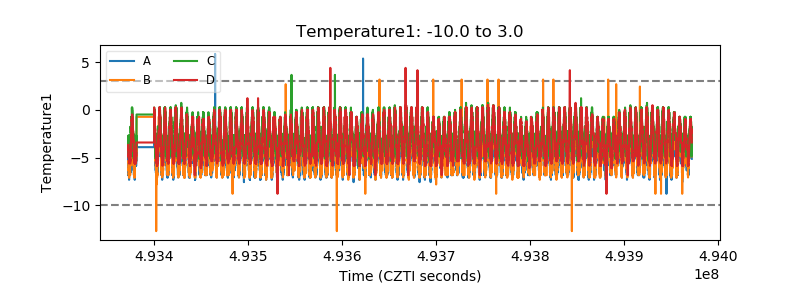 |
| Veto HV Monitor | 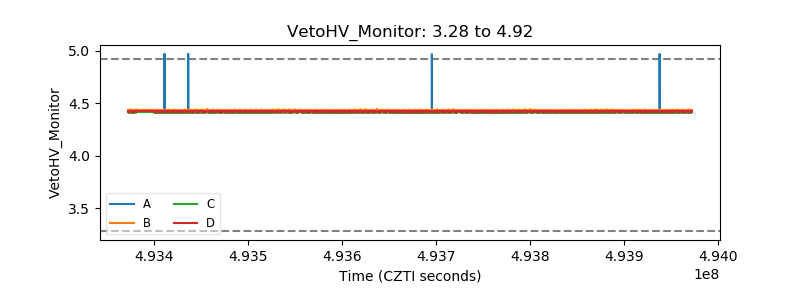 |
| Veto LLD | 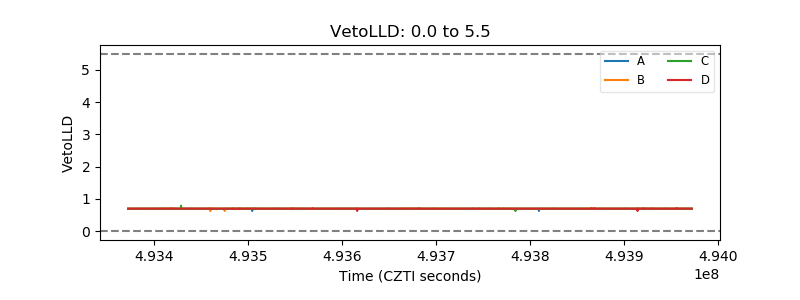 |
| Alpha Counter | 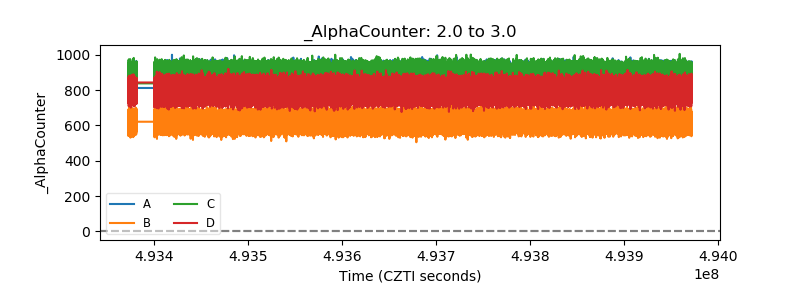 |
| _CPM_Rate | 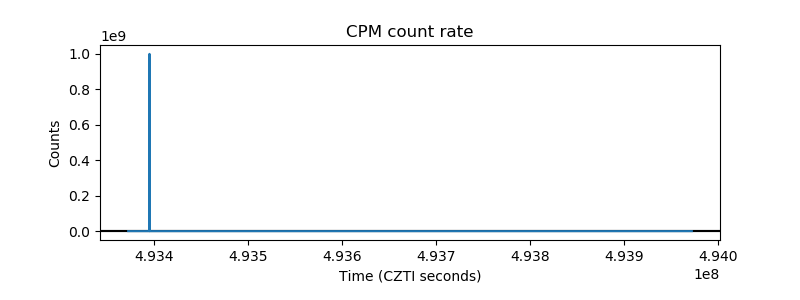 |
| CZT Counter | 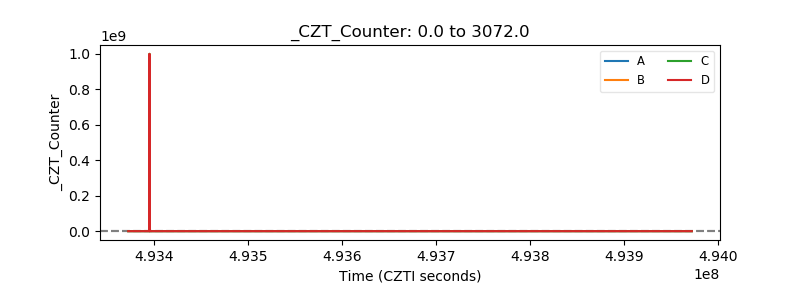 |
| +2.5 Volts monitor | 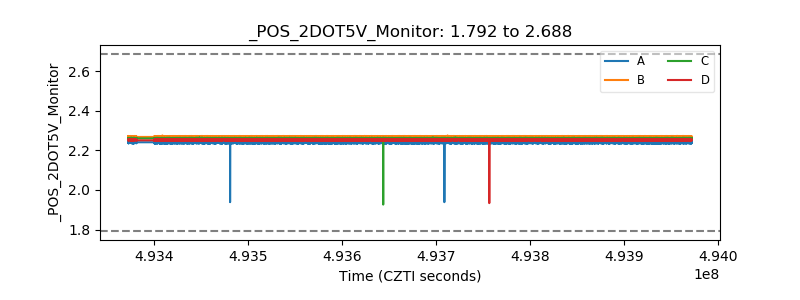 |
| +5 Volts monitor | 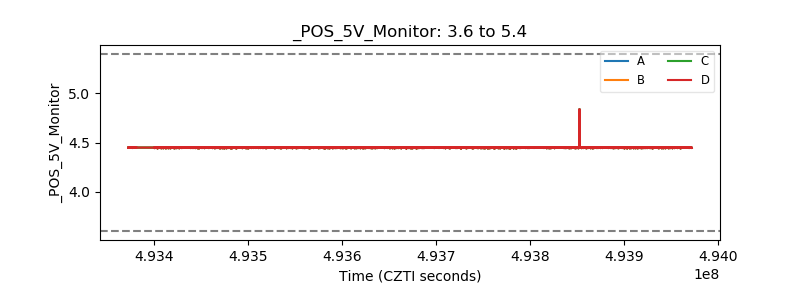 |
| _ROLL_ROT | 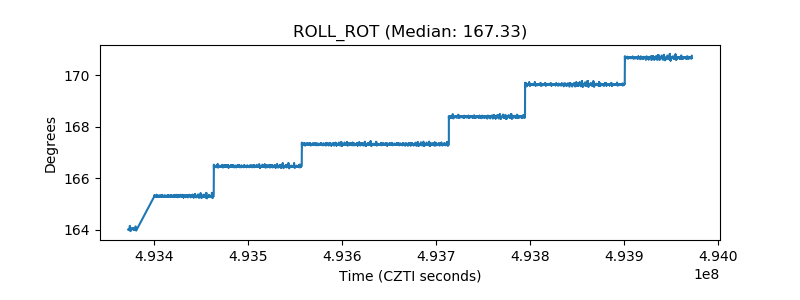 |
| _Roll_DEC | 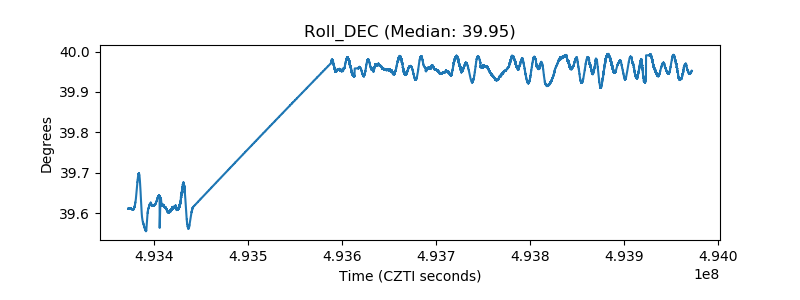 |
| _Roll_RA | 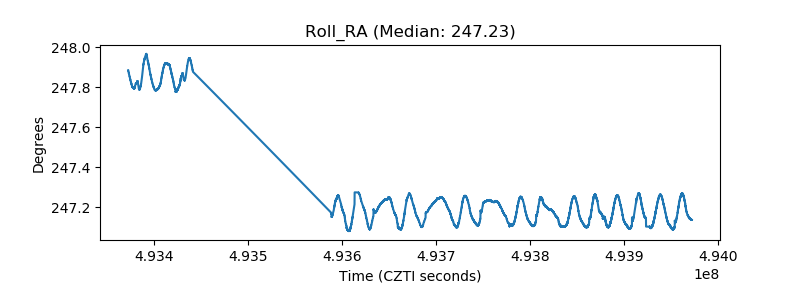 |
| Veto Counter | 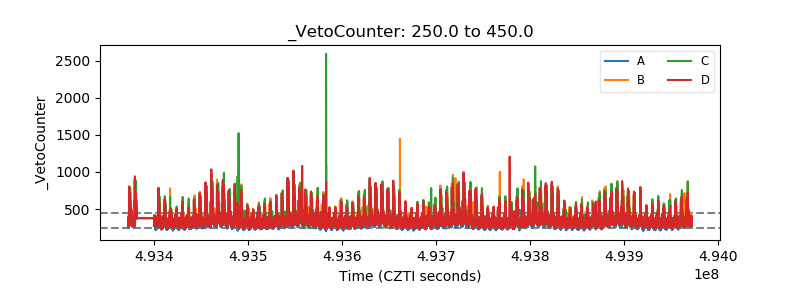 |