| Param | Original file | Final file |
|---|---|---|
| Filename | modeM0/AS1A14_004T05_9000006502_53527cztM0_level2.fits | modeM0/AS1A14_004T05_9000006502_53527cztM0_level2_quad_clean.evt |
| Size (bytes) | 621,527,040 | 88,421,760 |
| Size | 592.7 MB | 84.3 MB |
| Events in quadrant A | 4,454,585 | 622,131 |
| Events in quadrant B | 3,714,346 | 669,685 |
| Events in quadrant C | 9,320,615 | 402,678 |
| Events in quadrant D | 5,031,988 | 545,805 |
| Mode M9 | |||
|---|---|---|---|
| Quadrant | BADHDUFLAG | Total packets | Discarded packets |
| A | 0 | 11 | 0 |
| B | 0 | 11 | 0 |
| C | 0 | 11 | 0 |
| D | 0 | 11 | 0 |
| Mode SS | |||
|---|---|---|---|
| Quadrant | BADHDUFLAG | Total packets | Discarded packets |
| A | 0 | 128 | 0 |
| B | 0 | 128 | 0 |
| C | 0 | 128 | 0 |
| D | 0 | 128 | 0 |
| Mode M0 | |||
|---|---|---|---|
| Quadrant | BADHDUFLAG | Total packets | Discarded packets |
| A | 0 | 17429 | 1 |
| B | 0 | 15281 | 1 |
| C | 0 | 31964 | 1 |
| D | 0 | 19094 | 1 |
| Quadrant | Total seconds | Saturated seconds | Saturation percentage |
|---|---|---|---|
| A | 6257 | 335 | 5.354004% |
| B | 6257 | 280 | 4.474988% |
| C | 6257 | 2331 | 37.254275% |
| D | 6257 | 495 | 7.911140% |
Noise dominated data is calculated using 1-second bins in cleaned event files. If a bin has >2000 counts, and if more than 50% of those come from <1% of pixels, then it is considered to be noise-dominated and hence unusable.
| Quadrant | # 1 sec bins | Bins with >0 counts | Bins with >2000 counts | High rate bins dominated by noise | Noise dominated (total time) | Noise dominated (detector-on time) | Marked lightcurve |
|---|---|---|---|---|---|---|---|
| A | 7367 | 6257 | 189 | 189 | 2.57% | 3.02% | 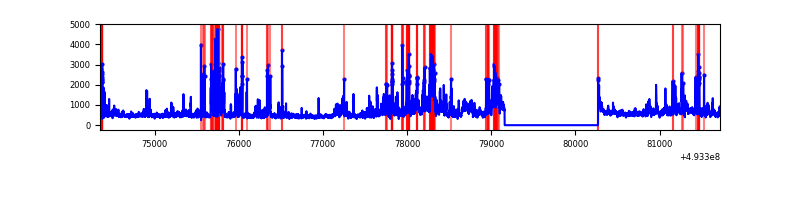 |
| B | 7367 | 6257 | 116 | 116 | 1.57% | 1.85% | 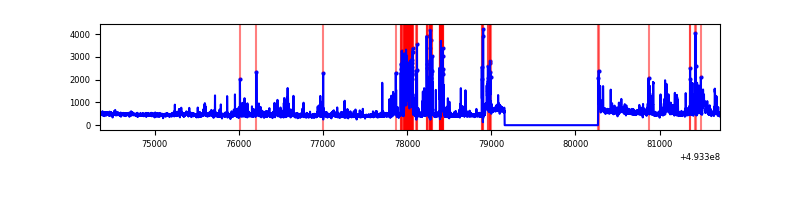 |
| C | 7367 | 6257 | 2045 | 2045 | 27.76% | 32.68% | 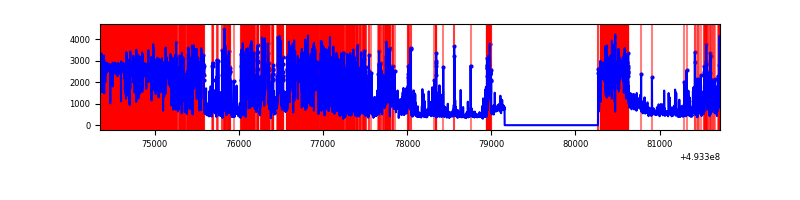 |
| D | 7367 | 6257 | 394 | 394 | 5.35% | 6.30% | 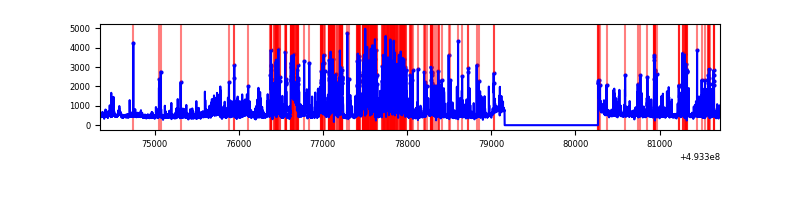 |
Top three noisy pixels from each quadrant. If the there are fewer than three noisy pixels in the level2.evt file, extra rows are filled as -1
| Pixel properties | Quadrant properties | ||||||
|---|---|---|---|---|---|---|---|
| Quadrant | DetID | PixID | Counts | Sigma | Mean | Median | Sigma |
| A | 3 | 62 | 742655 | 4311.18 | 703 | 685 | 172.1 |
| A | 15 | 174 | 496704 | 2882.1 | 703 | 685 | 172.1 |
| A | 3 | 63 | 242193 | 1403.27 | 703 | 685 | 172.1 |
| B | 2 | 249 | 483815 | 3245.39 | 696 | 674 | 148.9 |
| B | 5 | 185 | 201922 | 1351.84 | 696 | 674 | 148.9 |
| B | 10 | 28 | 52937 | 351.06 | 696 | 674 | 148.9 |
| C | 15 | 224 | 2322353 | 15014.89 | 560 | 554 | 154.6 |
| C | 7 | 64 | 2080176 | 13448.75 | 560 | 554 | 154.6 |
| C | 1 | 241 | 1678235 | 10849.43 | 560 | 554 | 154.6 |
| D | 6 | 239 | 768696 | 3996.22 | 677 | 648 | 192.2 |
| D | 3 | 12 | 543746 | 2825.79 | 677 | 648 | 192.2 |
| D | 7 | 70 | 246027 | 1276.73 | 677 | 648 | 192.2 |
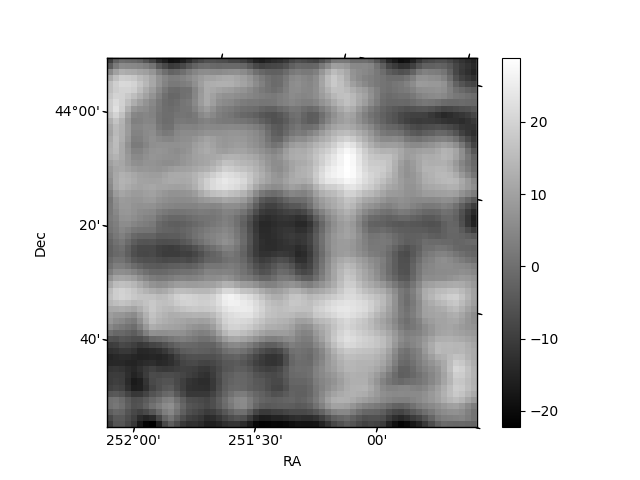
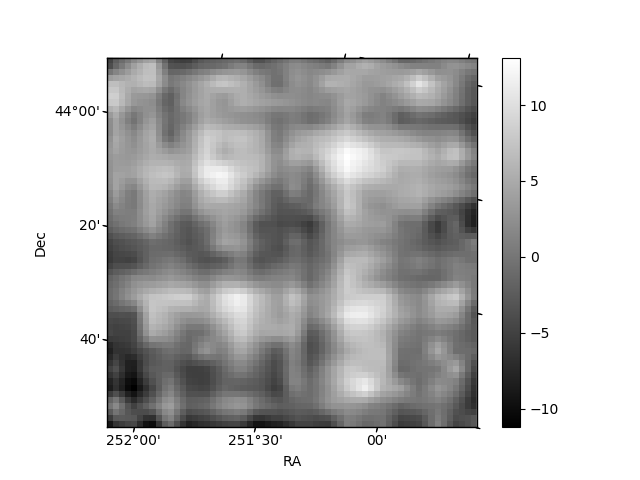
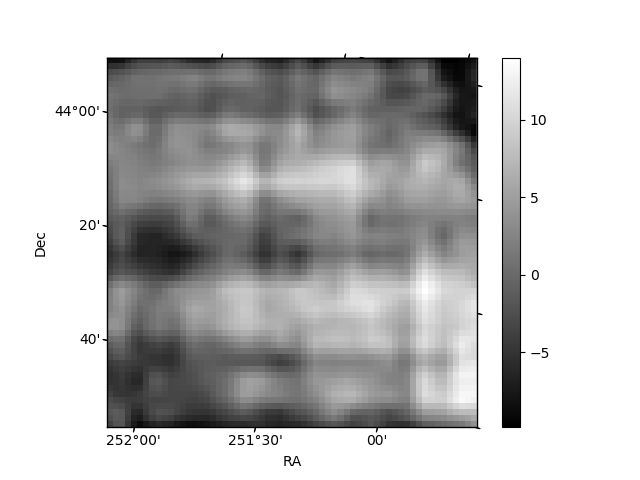
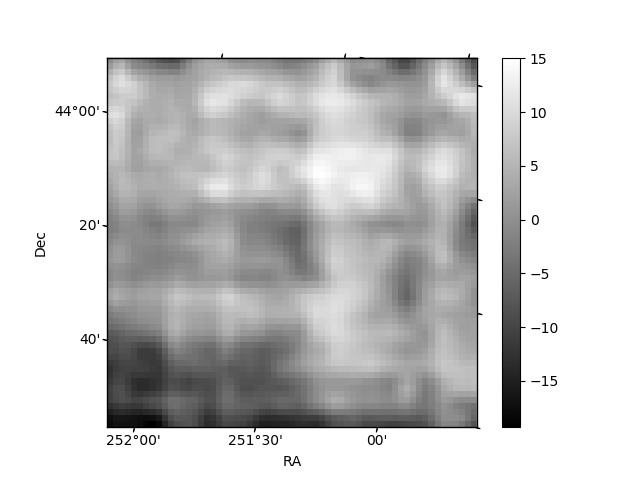
Histogram calculated using DETX and DETY for each event in the final _common_clean file
| Quadrant A | 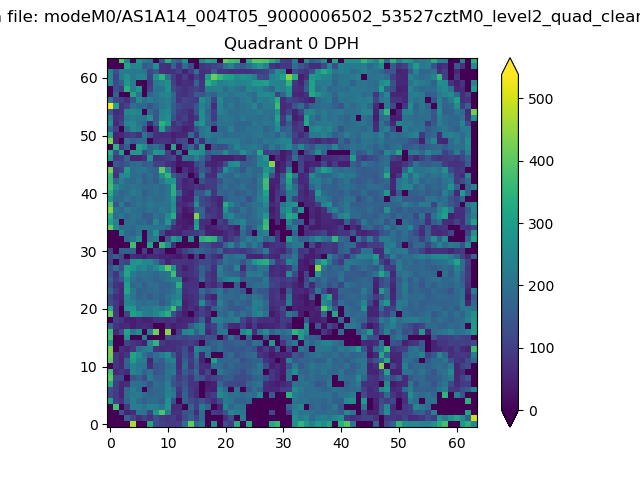 |
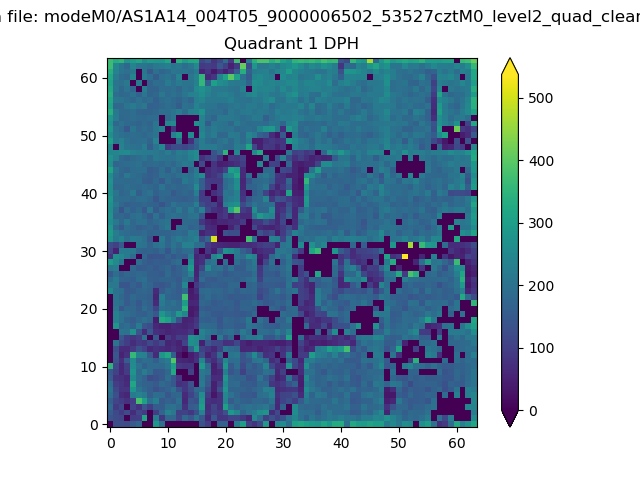 |
Quadrant B |
|---|---|---|---|
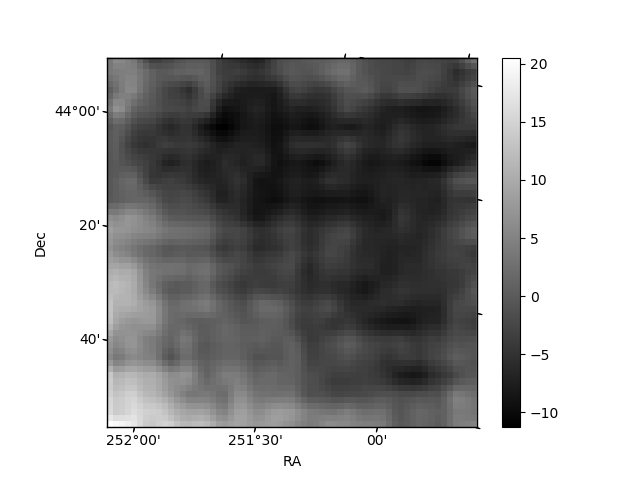
| Quadrant D | 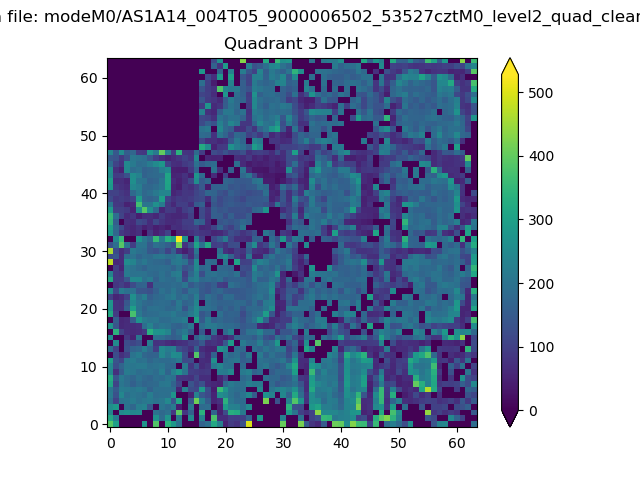 |
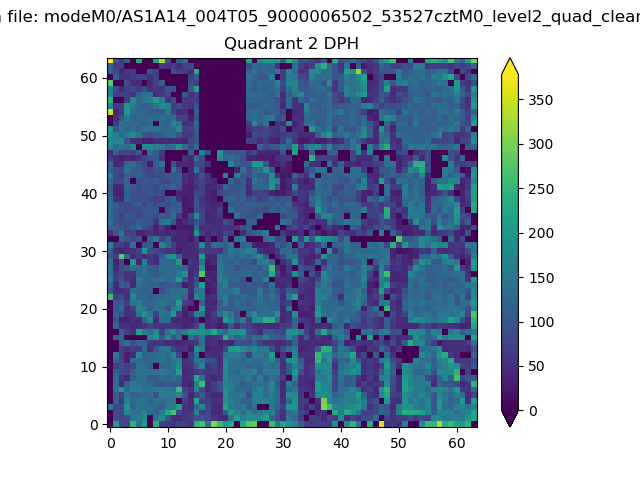 |
Quadrant C |
| Plot type | Count rate plots | Images |
|---|---|---|
| Comparison with Poisson distribution Blue bars denote a histogram of data divided into 1 sec bins. Red curve is a Poisson curve with rate = median count rate of data. |
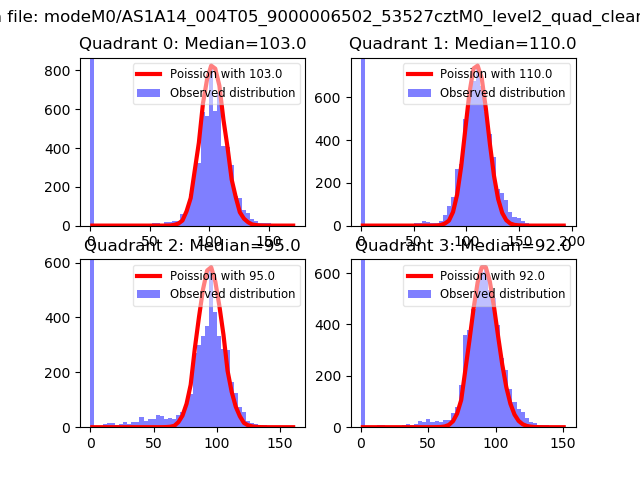 |
 |
| Quadrant-wise count rates Data is divided into 100 sec bins |
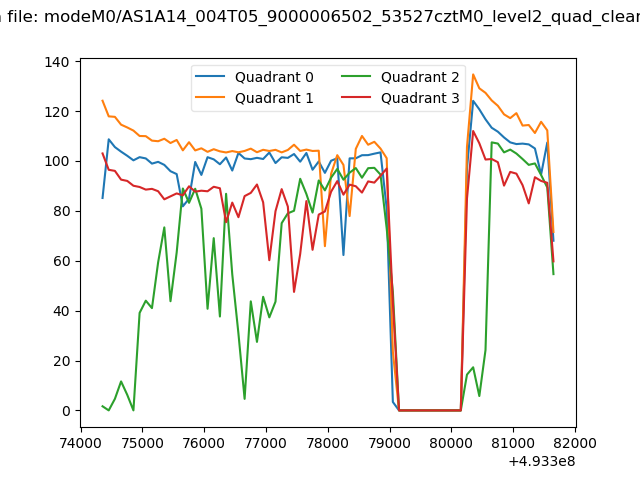 |
|
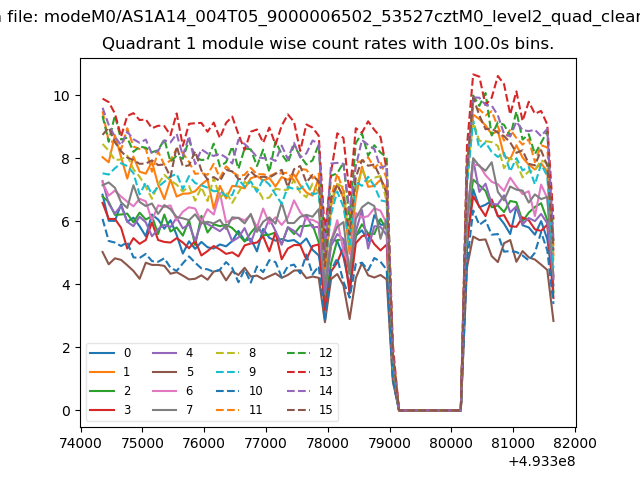
| Module-wise count rates for Quadrant A Data is divided into 100 sec bins |
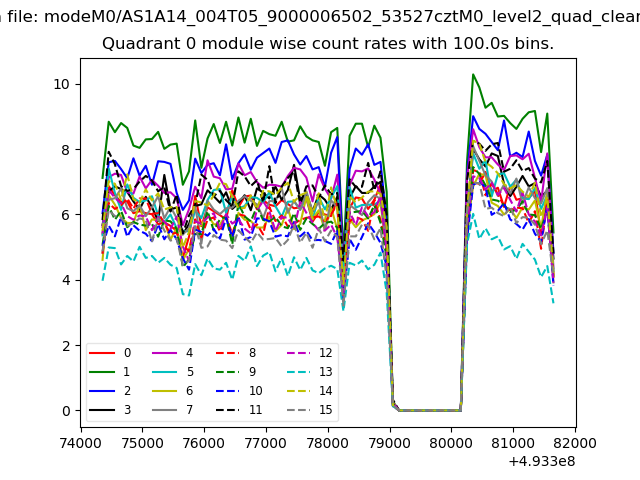 |
 |
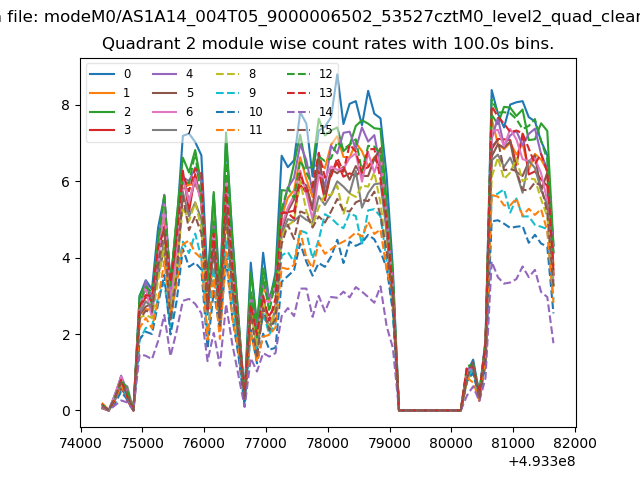
| Module-wise count rates for Quadrant B Data is divided into 100 sec bins |
 |
 |
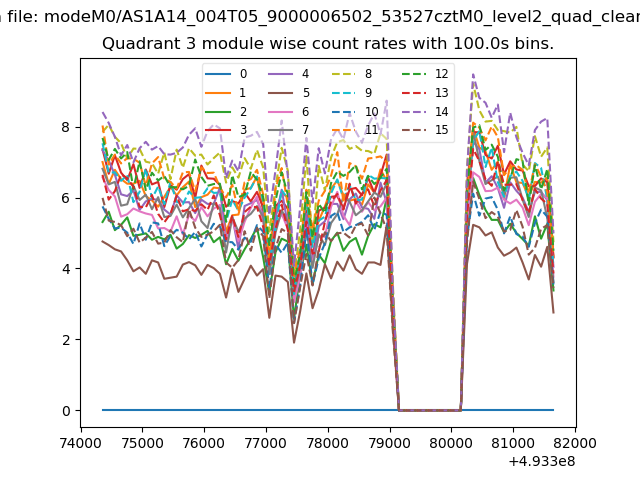
| Module-wise count rates for Quadrant C Data is divided into 100 sec bins |
 |
 |
| Module-wise count rates for Quadrant D Data is divided into 100 sec bins |
 |
 |
| Parameter | Plot |
|---|---|
| CZT HV Monitor | 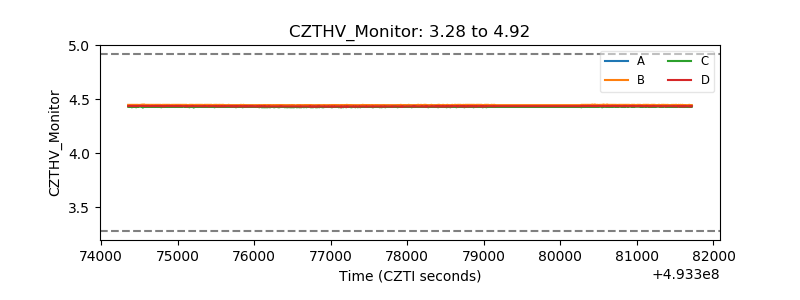 |
| D_VDD | 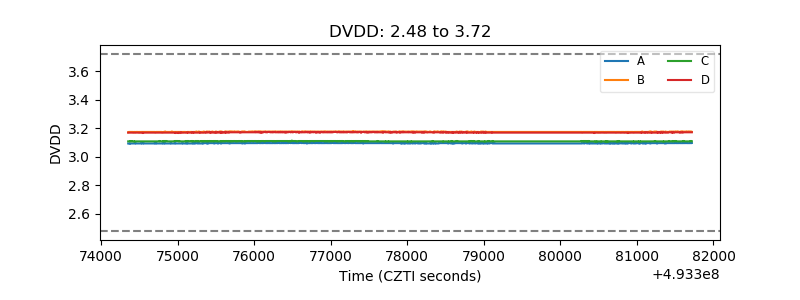 |
| Temperature 1 | 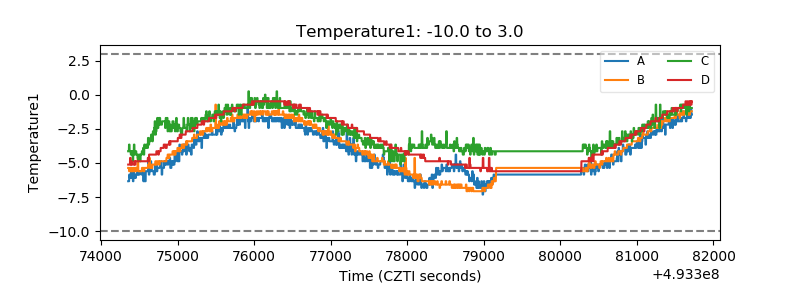 |
| Veto HV Monitor | 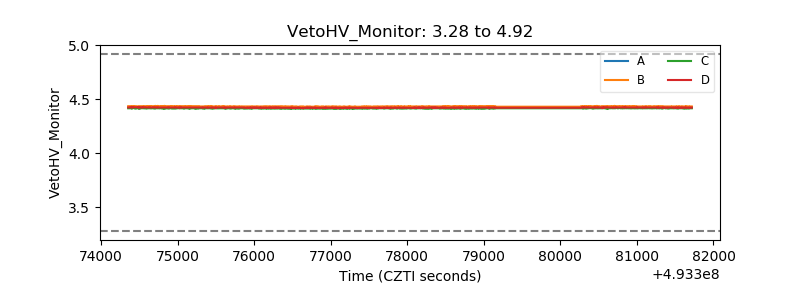 |
| Veto LLD | 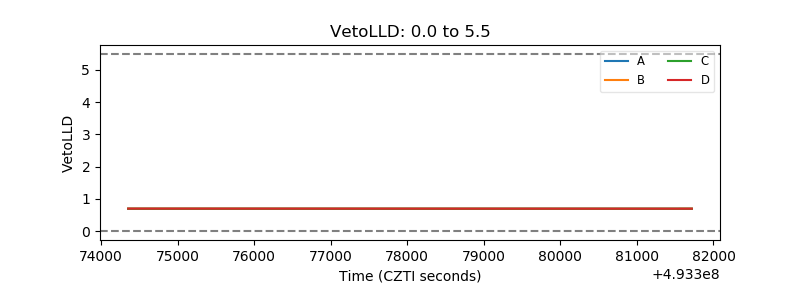 |
| Alpha Counter | 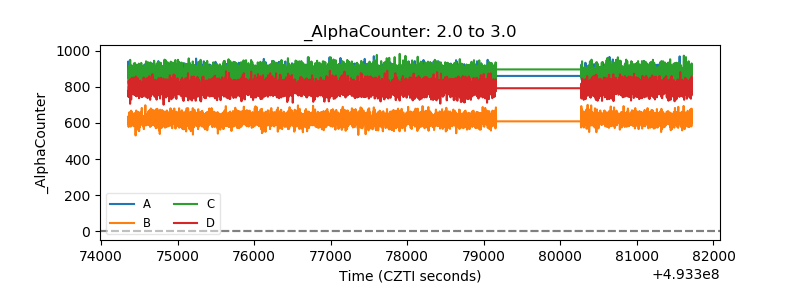 |
| _CPM_Rate | 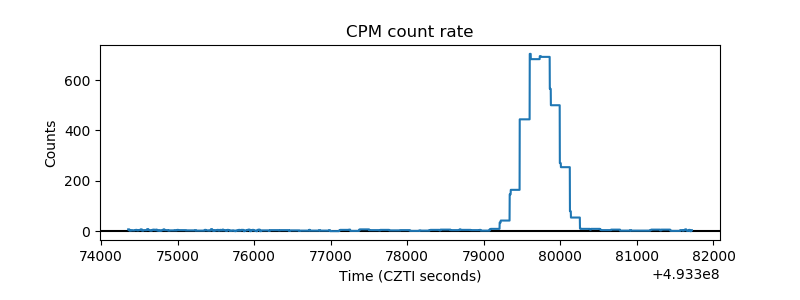 |
| CZT Counter | 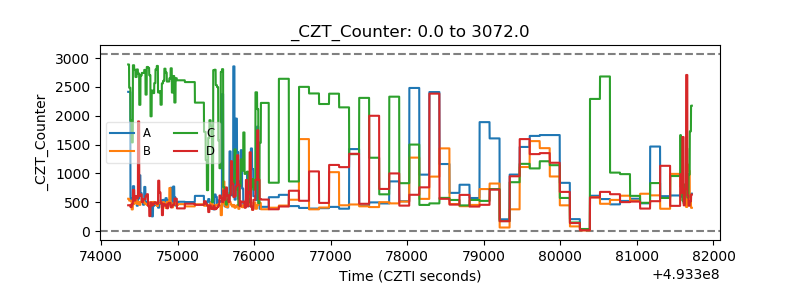 |
| +2.5 Volts monitor | 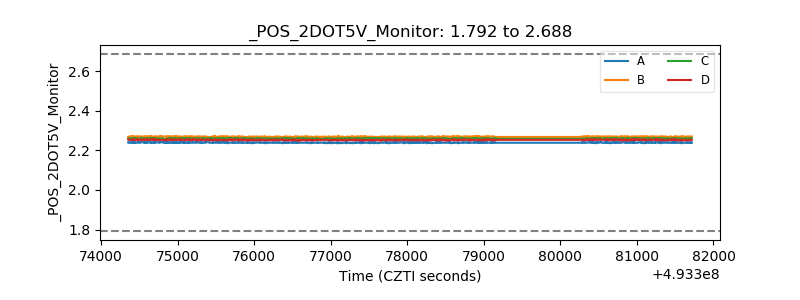 |
| +5 Volts monitor | 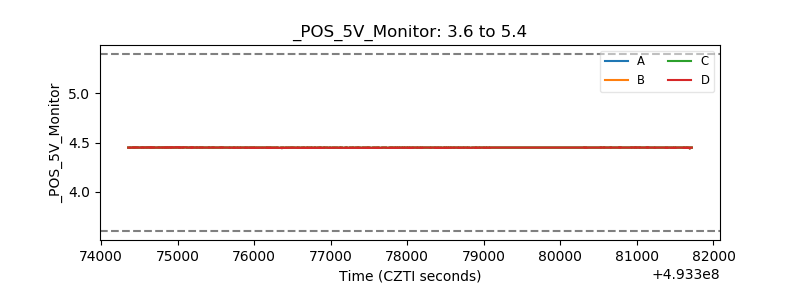 |
| _ROLL_ROT | 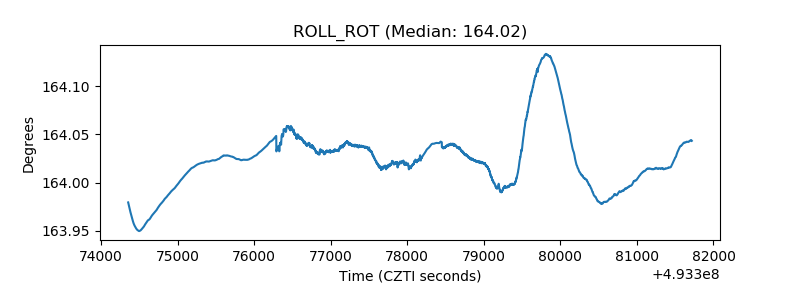 |
| _Roll_DEC | 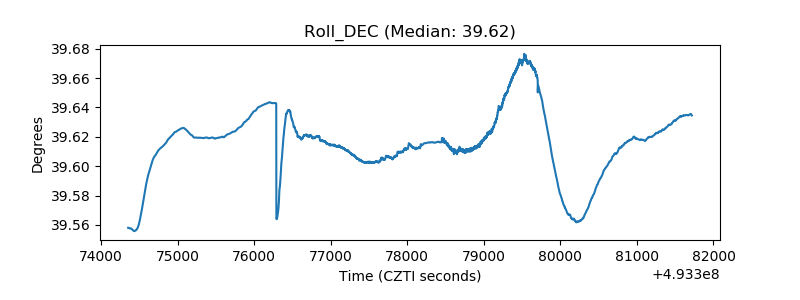 |
| _Roll_RA | 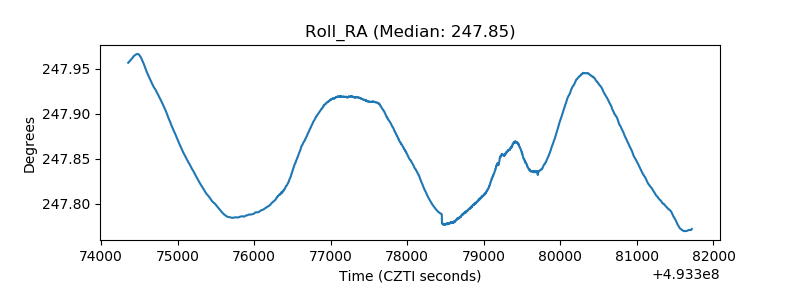 |
| Veto Counter | 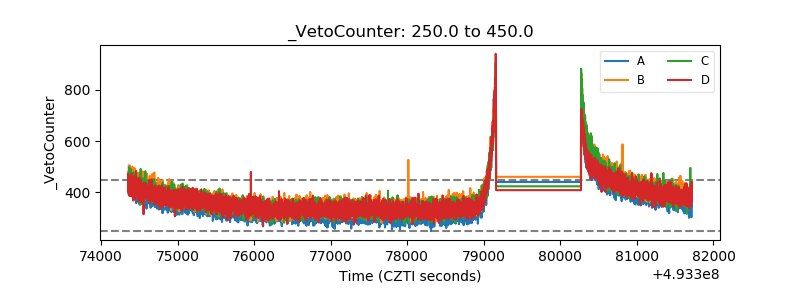 |