| Param | Original file | Final file |
|---|---|---|
| Filename | modeM0/AS1A14_004T05_9000006502_53528cztM0_level2.fits | modeM0/AS1A14_004T05_9000006502_53528cztM0_level2_quad_clean.evt |
| Size (bytes) | 840,971,520 | 89,778,240 |
| Size | 802.0 MB | 85.6 MB |
| Events in quadrant A | 6,730,173 | 667,586 |
| Events in quadrant B | 5,884,522 | 681,315 |
| Events in quadrant C | 12,034,818 | 285,549 |
| Events in quadrant D | 5,953,640 | 609,139 |
| Mode M9 | |||
|---|---|---|---|
| Quadrant | BADHDUFLAG | Total packets | Discarded packets |
| A | 0 | 13 | 0 |
| B | 0 | 14 | 0 |
| C | 0 | 14 | 0 |
| D | 0 | 14 | 0 |
| Mode SS | |||
|---|---|---|---|
| Quadrant | BADHDUFLAG | Total packets | Discarded packets |
| A | 0 | 140 | 0 |
| B | 0 | 140 | 0 |
| C | 0 | 140 | 0 |
| D | 0 | 140 | 0 |
| Mode M0 | |||
|---|---|---|---|
| Quadrant | BADHDUFLAG | Total packets | Discarded packets |
| A | 0 | 24778 | 2 |
| B | 0 | 22114 | 2 |
| C | 0 | 40392 | 7 |
| D | 0 | 22234 | 2 |
| Quadrant | Total seconds | Saturated seconds | Saturation percentage |
|---|---|---|---|
| A | 6806 | 742 | 10.902145% |
| B | 6806 | 935 | 13.737878% |
| C | 6805 | 4181 | 61.440118% |
| D | 6805 | 580 | 8.523145% |
Noise dominated data is calculated using 1-second bins in cleaned event files. If a bin has >2000 counts, and if more than 50% of those come from <1% of pixels, then it is considered to be noise-dominated and hence unusable.
| Quadrant | # 1 sec bins | Bins with >0 counts | Bins with >2000 counts | High rate bins dominated by noise | Noise dominated (total time) | Noise dominated (detector-on time) | Marked lightcurve |
|---|---|---|---|---|---|---|---|
| A | 7941 | 6806 | 470 | 470 | 5.92% | 6.91% | 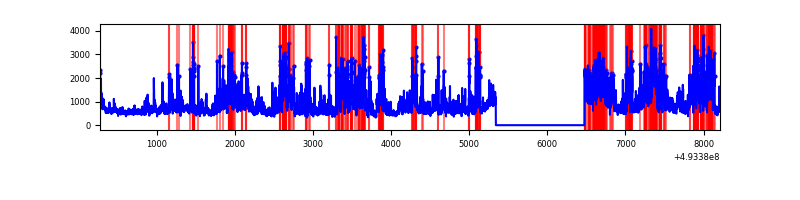 |
| B | 7941 | 6806 | 688 | 688 | 8.66% | 10.11% | 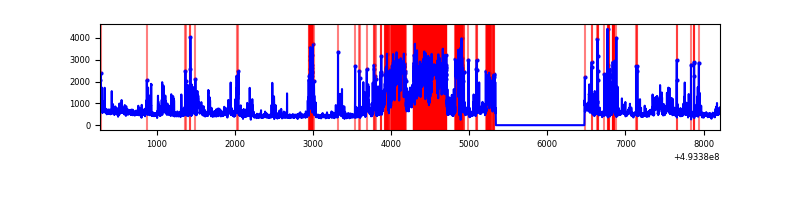 |
| C | 7939 | 6804 | 3219 | 3219 | 40.55% | 47.31% | 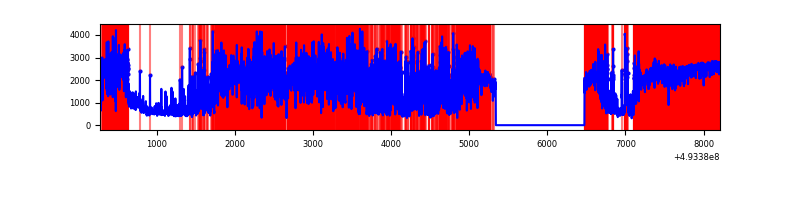 |
| D | 7940 | 6805 | 392 | 392 | 4.94% | 5.76% | 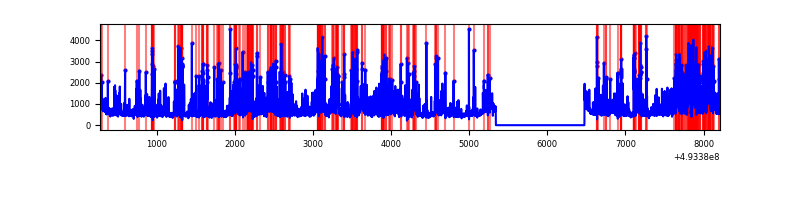 |
Top three noisy pixels from each quadrant. If the there are fewer than three noisy pixels in the level2.evt file, extra rows are filled as -1
| Pixel properties | Quadrant properties | ||||||
|---|---|---|---|---|---|---|---|
| Quadrant | DetID | PixID | Counts | Sigma | Mean | Median | Sigma |
| A | 3 | 62 | 1672695 | 8783.49 | 772 | 752 | 190.4 |
| A | 15 | 174 | 716525 | 3760.29 | 772 | 752 | 190.4 |
| A | 12 | 115 | 570930 | 2995.41 | 772 | 752 | 190.4 |
| B | 10 | 254 | 1149922 | 7408.64 | 734 | 709 | 155.1 |
| B | 2 | 249 | 1076069 | 6932.53 | 734 | 709 | 155.1 |
| B | 5 | 185 | 251756 | 1618.43 | 734 | 709 | 155.1 |
| C | 15 | 217 | 7331436 | 56634.92 | 470 | 466 | 129.4 |
| C | 15 | 224 | 1602776 | 12378.54 | 470 | 466 | 129.4 |
| C | 1 | 241 | 774606 | 5980.56 | 470 | 466 | 129.4 |
| D | 6 | 239 | 805211 | 3730.38 | 755 | 720 | 215.7 |
| D | 3 | 12 | 625451 | 2896.84 | 755 | 720 | 215.7 |
| D | 2 | 153 | 335519 | 1552.44 | 755 | 720 | 215.7 |
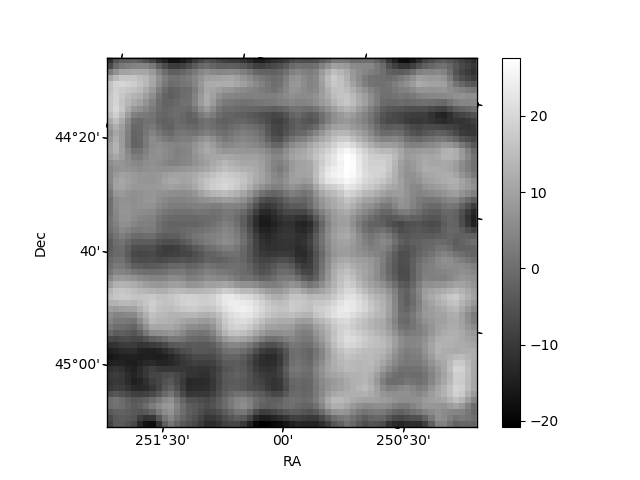
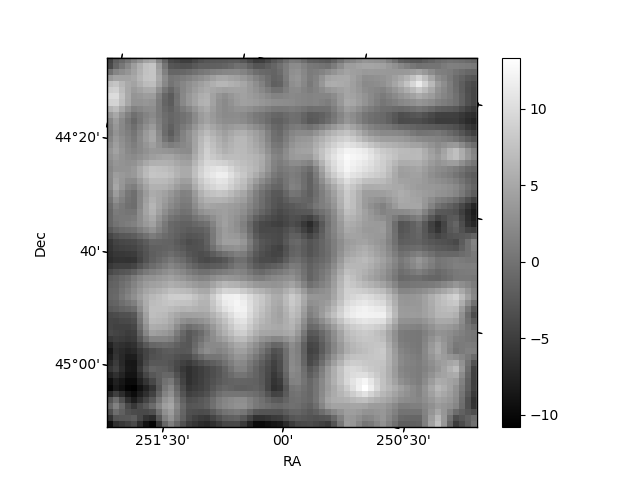
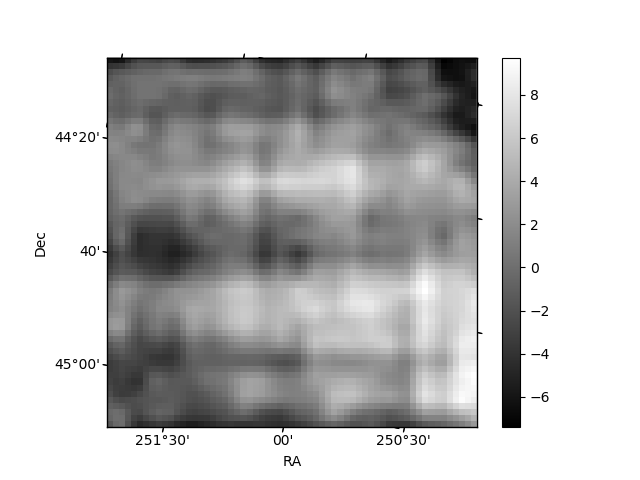
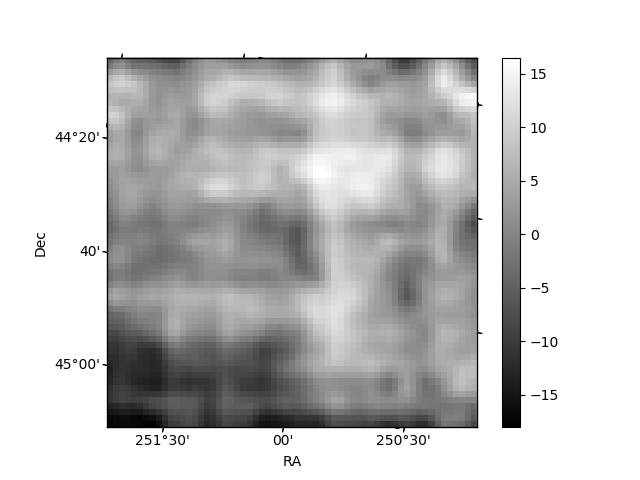
Histogram calculated using DETX and DETY for each event in the final _common_clean file
| Quadrant A | 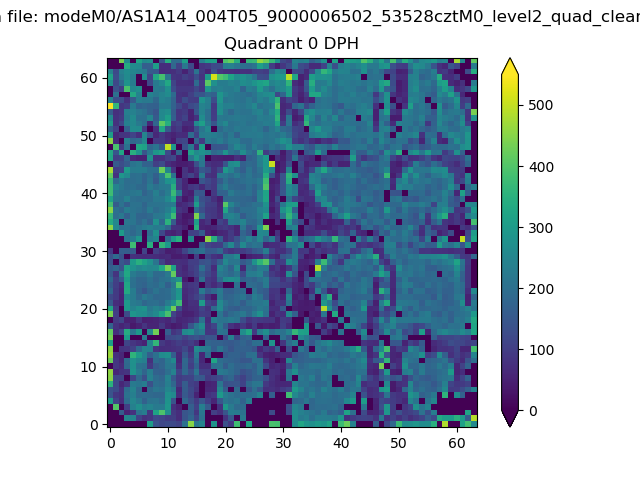 |
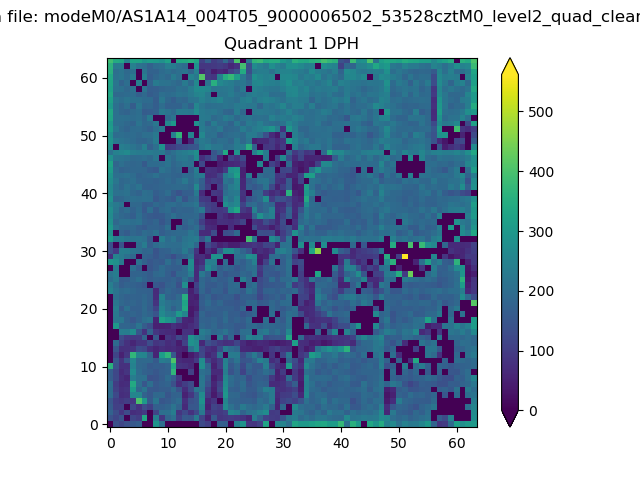 |
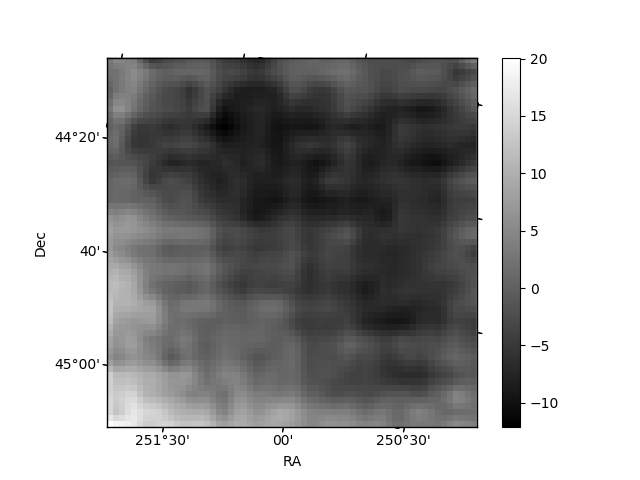
Quadrant B |
|---|---|---|---|
| Quadrant D | 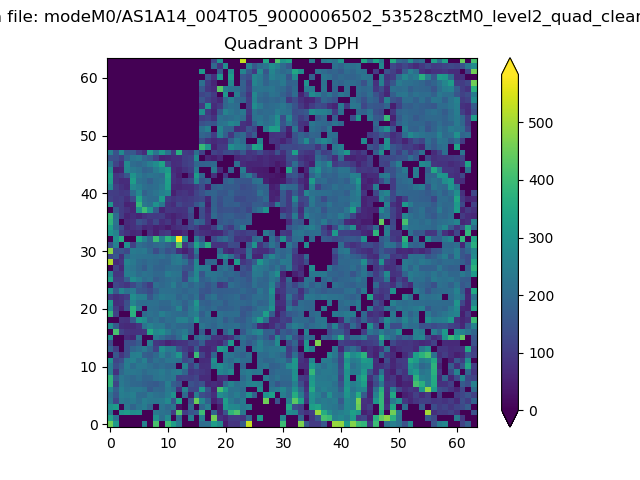 |
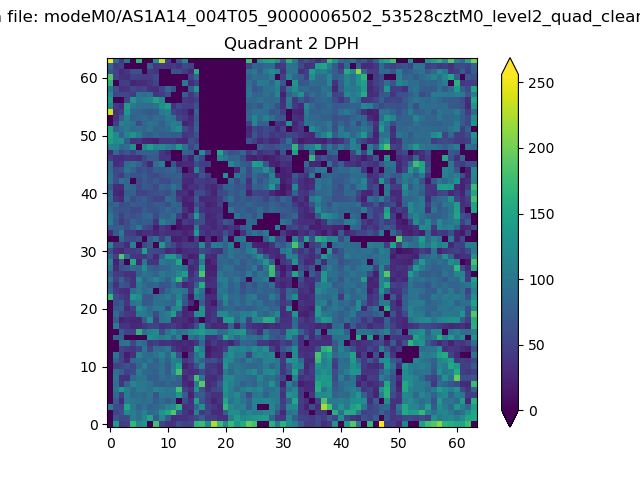 |
Quadrant C |
| Plot type | Count rate plots | Images |
|---|---|---|
| Comparison with Poisson distribution Blue bars denote a histogram of data divided into 1 sec bins. Red curve is a Poisson curve with rate = median count rate of data. |
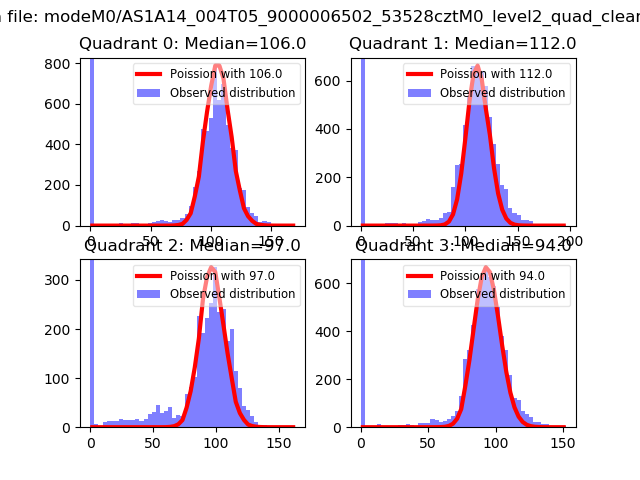 |
 |
| Quadrant-wise count rates Data is divided into 100 sec bins |
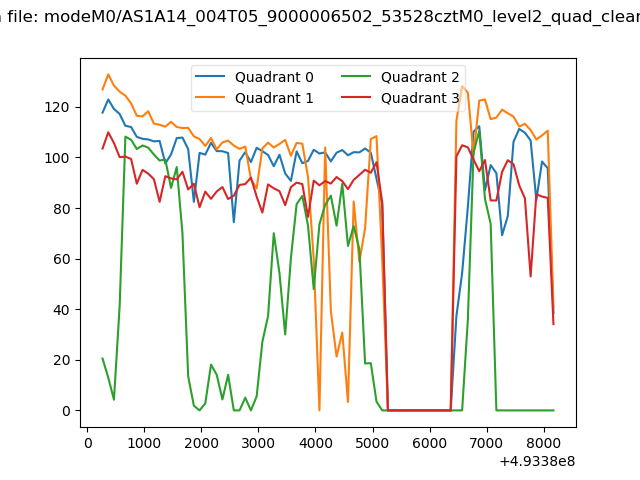 |
|
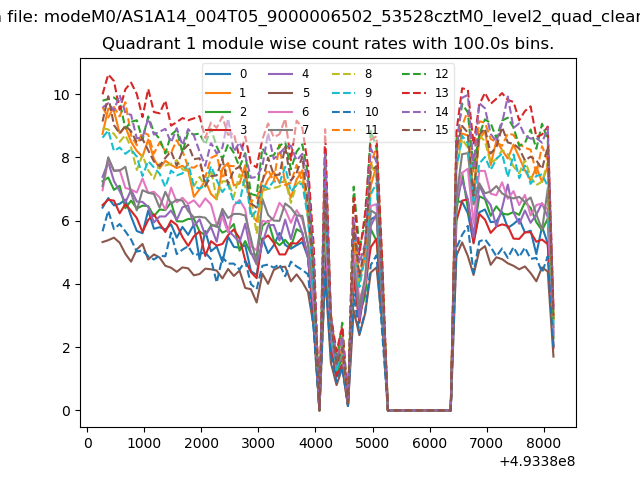
| Module-wise count rates for Quadrant A Data is divided into 100 sec bins |
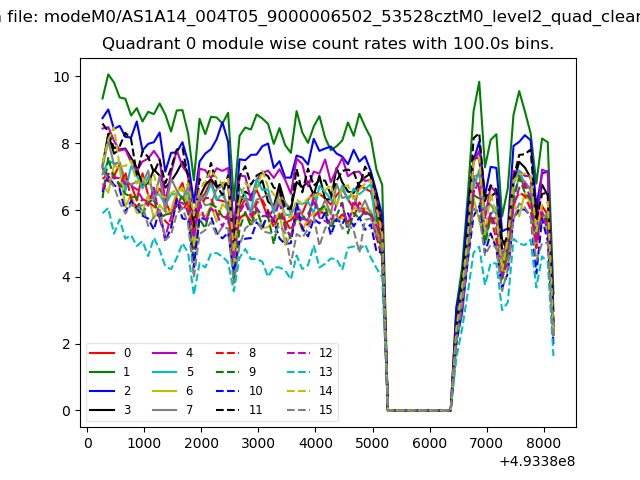 |
 |
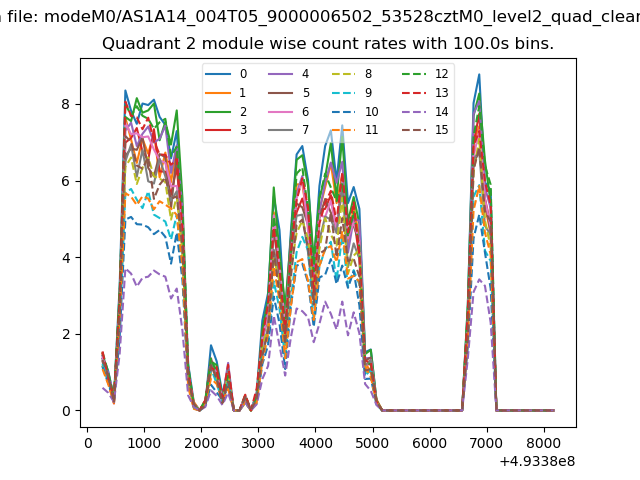
| Module-wise count rates for Quadrant B Data is divided into 100 sec bins |
 |
 |
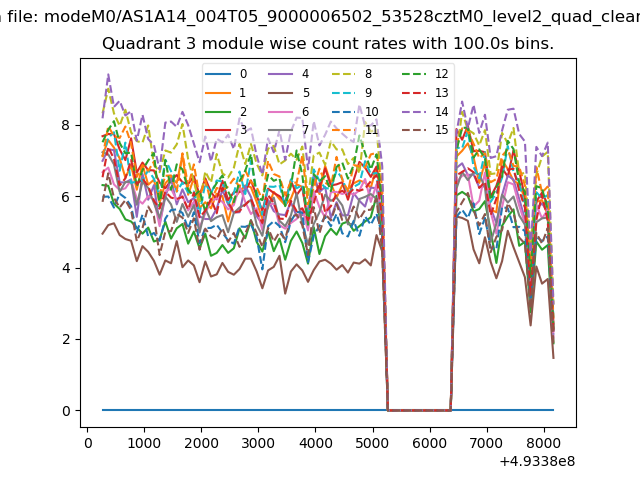
| Module-wise count rates for Quadrant C Data is divided into 100 sec bins |
 |
 |
| Module-wise count rates for Quadrant D Data is divided into 100 sec bins |
 |
 |
| Parameter | Plot |
|---|---|
| CZT HV Monitor | 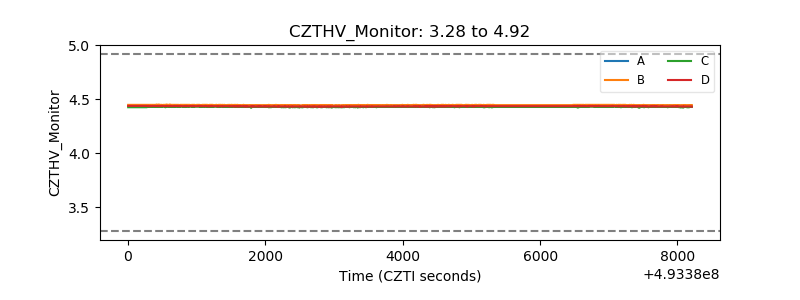 |
| D_VDD | 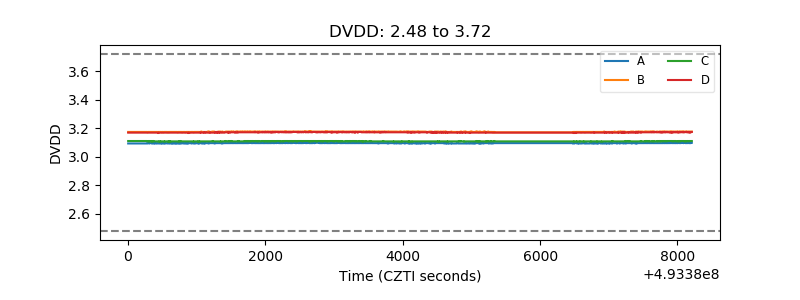 |
| Temperature 1 | 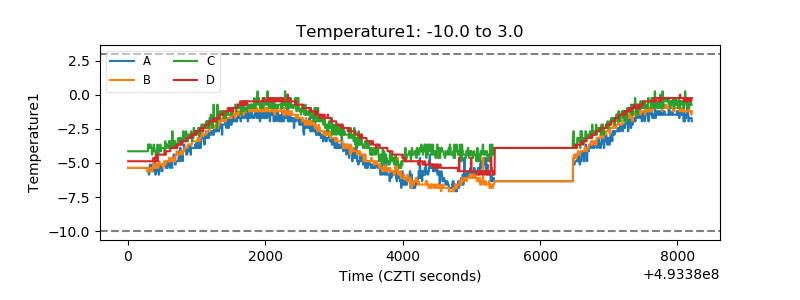 |
| Veto HV Monitor |  |
| Veto LLD | 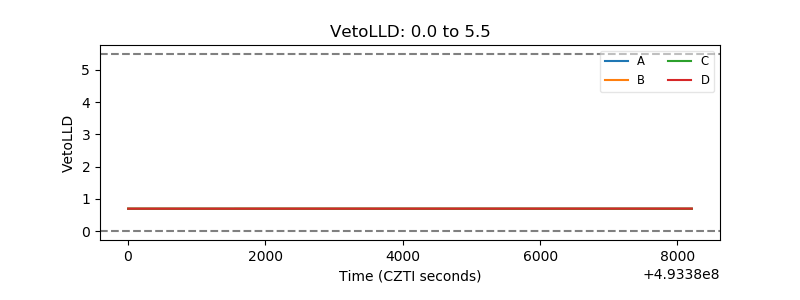 |
| Alpha Counter | 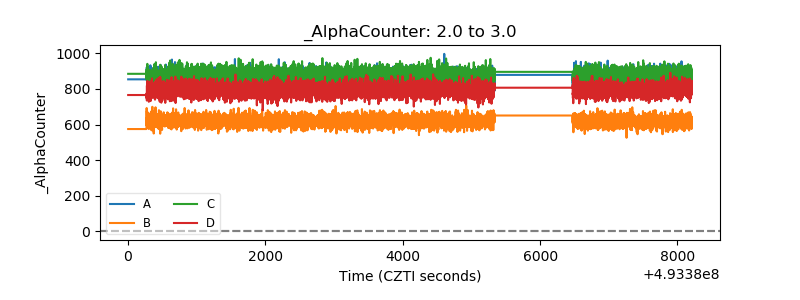 |
| _CPM_Rate | 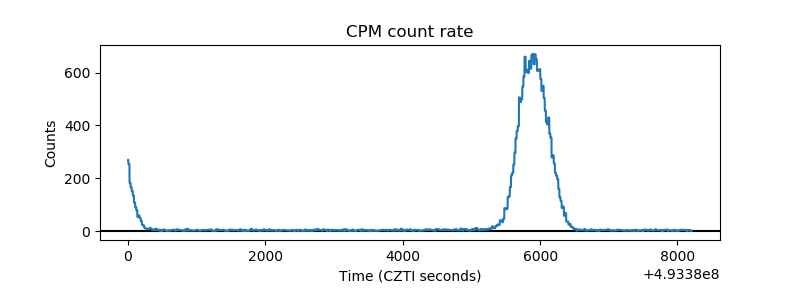 |
| CZT Counter | 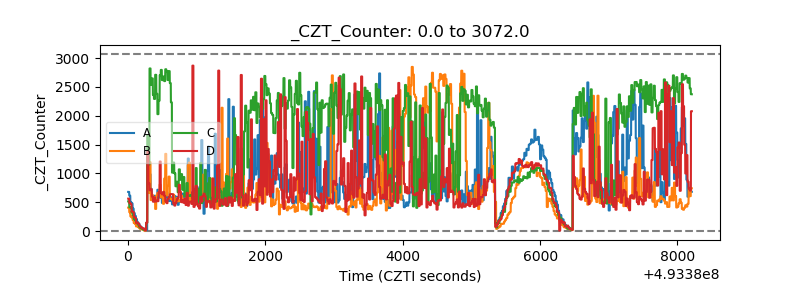 |
| +2.5 Volts monitor | 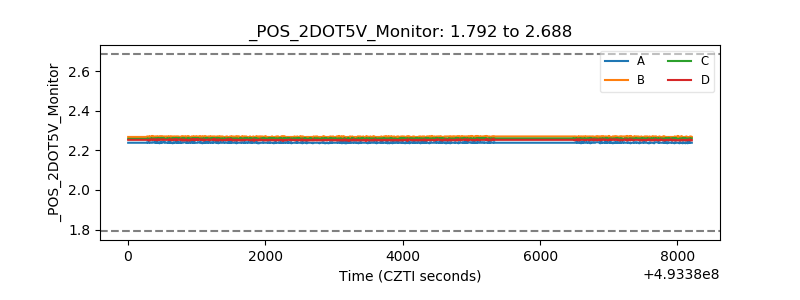 |
| +5 Volts monitor | 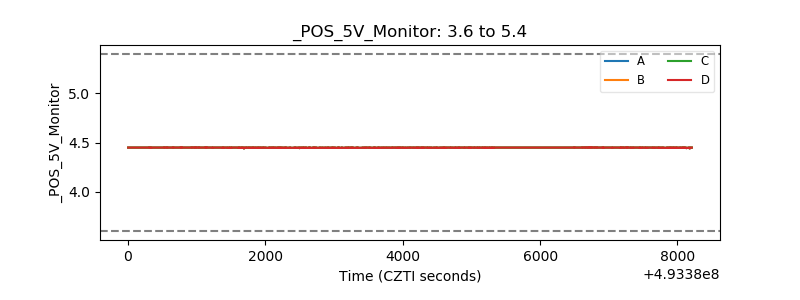 |
| _ROLL_ROT | 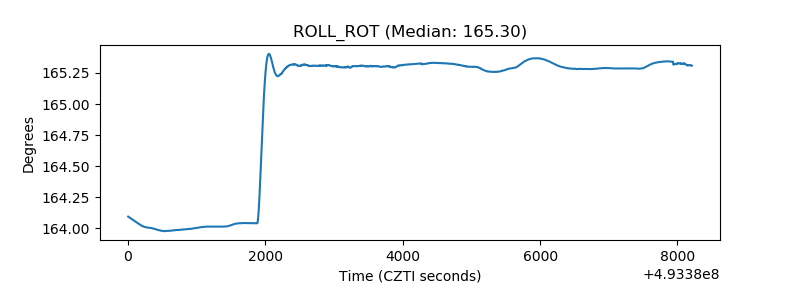 |
| _Roll_DEC | 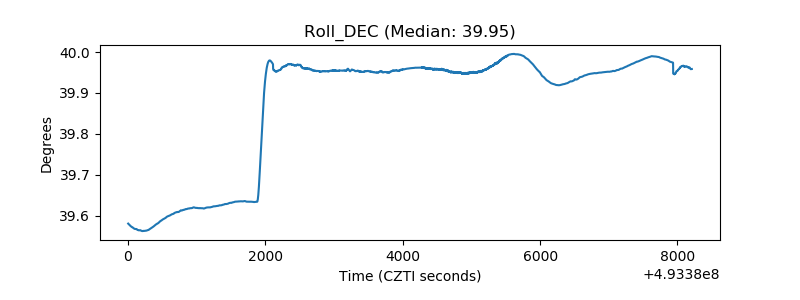 |
| _Roll_RA | 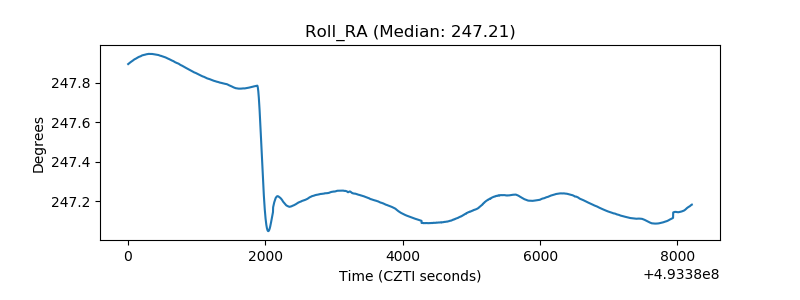 |
| Veto Counter | 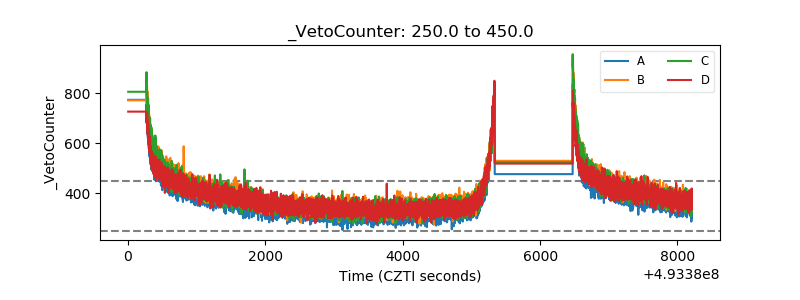 |