| Param | Original file | Final file |
|---|---|---|
| Filename | modeM0/AS1A14_004T05_9000006502_53529cztM0_level2.fits | modeM0/AS1A14_004T05_9000006502_53529cztM0_level2_quad_clean.evt |
| Size (bytes) | 644,310,720 | 77,253,120 |
| Size | 614.5 MB | 73.7 MB |
| Events in quadrant A | 4,346,927 | 575,919 |
| Events in quadrant B | 3,634,327 | 612,420 |
| Events in quadrant C | 9,711,057 | 267,128 |
| Events in quadrant D | 5,714,088 | 483,759 |
| Mode M9 | |||
|---|---|---|---|
| Quadrant | BADHDUFLAG | Total packets | Discarded packets |
| A | 0 | 12 | 0 |
| B | 0 | 12 | 0 |
| C | 0 | 12 | 0 |
| D | 0 | 12 | 0 |
| Mode SS | |||
|---|---|---|---|
| Quadrant | BADHDUFLAG | Total packets | Discarded packets |
| A | 0 | 116 | 0 |
| B | 0 | 116 | 0 |
| C | 0 | 116 | 0 |
| D | 0 | 116 | 0 |
| Mode M0 | |||
|---|---|---|---|
| Quadrant | BADHDUFLAG | Total packets | Discarded packets |
| A | 0 | 16711 | 1 |
| B | 0 | 14727 | 1 |
| C | 0 | 32849 | 6 |
| D | 0 | 20830 | 1 |
| Quadrant | Total seconds | Saturated seconds | Saturation percentage |
|---|---|---|---|
| A | 5720 | 322 | 5.629371% |
| B | 5720 | 202 | 3.531469% |
| C | 5720 | 3153 | 55.122378% |
| D | 5720 | 712 | 12.447552% |
Noise dominated data is calculated using 1-second bins in cleaned event files. If a bin has >2000 counts, and if more than 50% of those come from <1% of pixels, then it is considered to be noise-dominated and hence unusable.
| Quadrant | # 1 sec bins | Bins with >0 counts | Bins with >2000 counts | High rate bins dominated by noise | Noise dominated (total time) | Noise dominated (detector-on time) | Marked lightcurve |
|---|---|---|---|---|---|---|---|
| A | 6910 | 5721 | 211 | 211 | 3.05% | 3.69% | 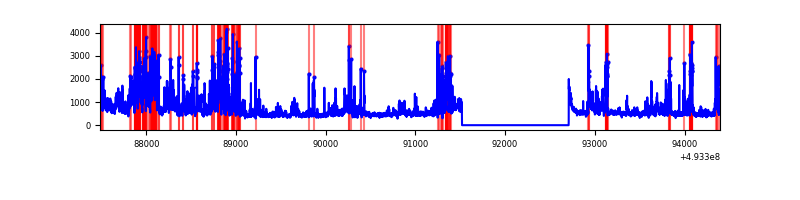 |
| B | 6910 | 5721 | 79 | 79 | 1.14% | 1.38% | 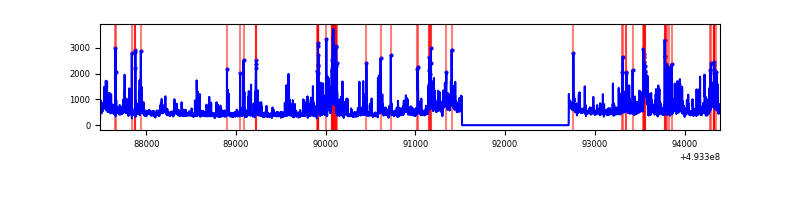 |
| C | 6909 | 5720 | 2845 | 2845 | 41.18% | 49.74% | 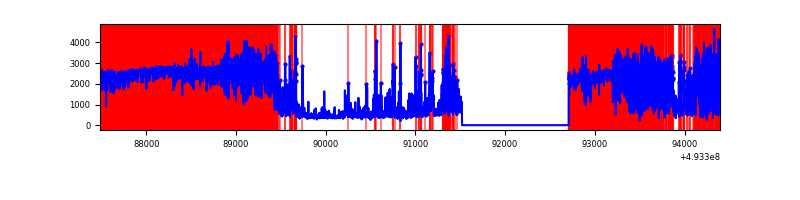 |
| D | 6910 | 5721 | 615 | 615 | 8.90% | 10.75% | 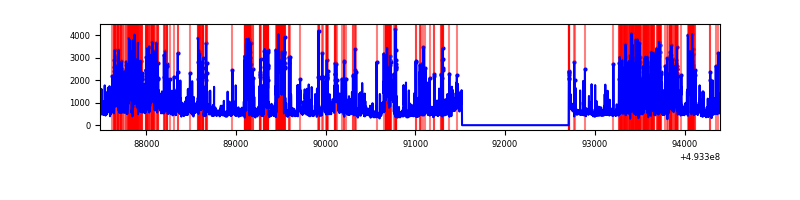 |
Top three noisy pixels from each quadrant. If the there are fewer than three noisy pixels in the level2.evt file, extra rows are filled as -1
| Pixel properties | Quadrant properties | ||||||
|---|---|---|---|---|---|---|---|
| Quadrant | DetID | PixID | Counts | Sigma | Mean | Median | Sigma |
| A | 3 | 62 | 893901 | 5704.05 | 630 | 614 | 156.6 |
| A | 0 | 8 | 241796 | 1540.06 | 630 | 614 | 156.6 |
| A | 3 | 63 | 217948 | 1387.78 | 630 | 614 | 156.6 |
| B | 10 | 28 | 439848 | 3347.53 | 622 | 600 | 131.2 |
| B | 2 | 249 | 332046 | 2525.97 | 622 | 600 | 131.2 |
| B | 5 | 185 | 54154 | 408.14 | 622 | 600 | 131.2 |
| C | 15 | 217 | 5857351 | 52186.49 | 402 | 399 | 112.2 |
| C | 15 | 224 | 1868718 | 16647.06 | 402 | 399 | 112.2 |
| C | 1 | 241 | 167885 | 1492.33 | 402 | 399 | 112.2 |
| D | 6 | 239 | 887810 | 5261.18 | 594 | 569 | 168.6 |
| D | 7 | 96 | 698965 | 4141.36 | 594 | 569 | 168.6 |
| D | 3 | 12 | 674717 | 3997.57 | 594 | 569 | 168.6 |
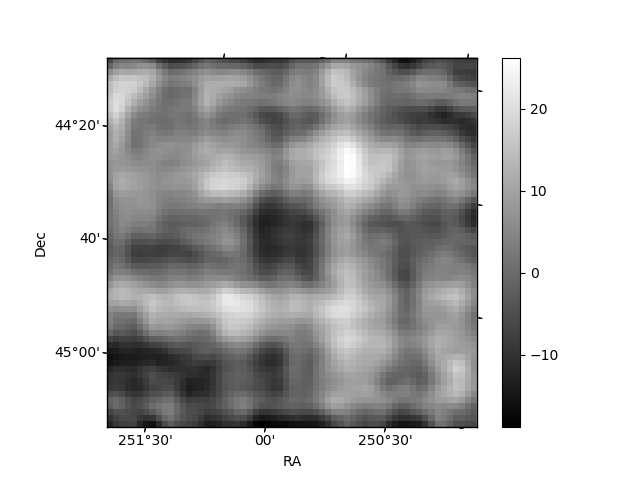
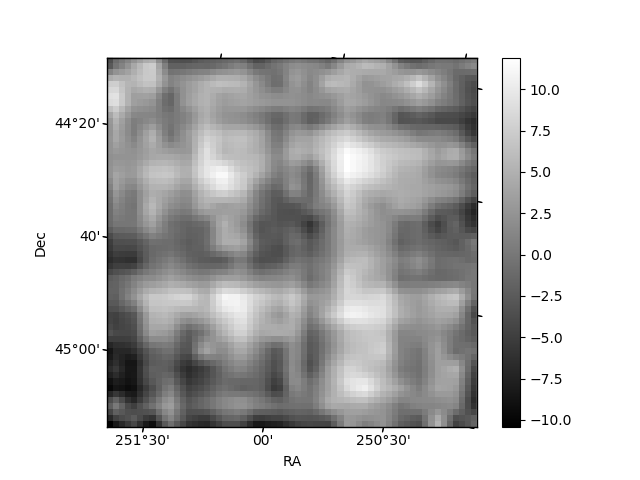
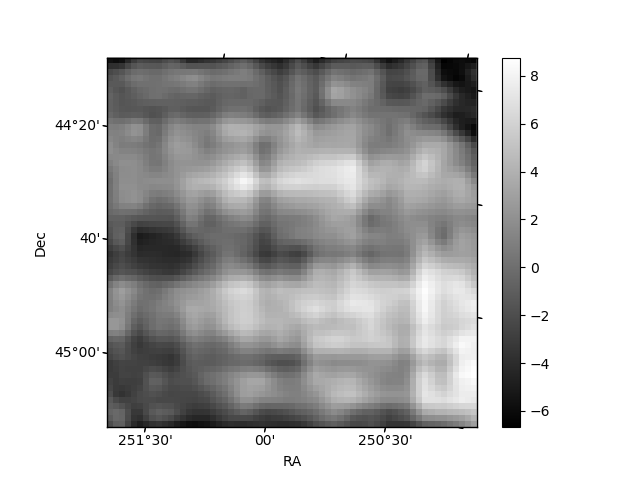
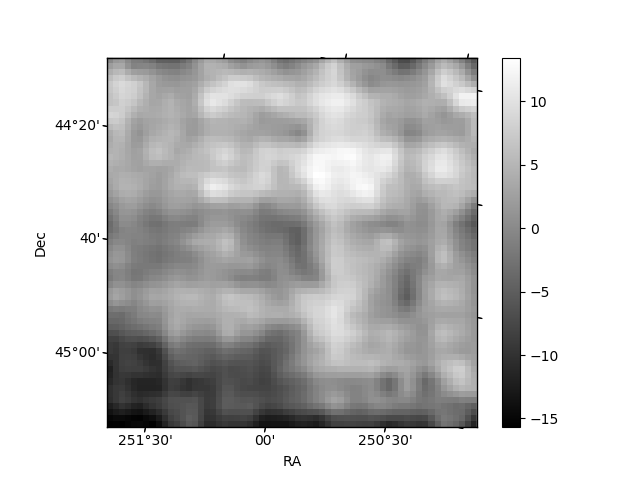
Histogram calculated using DETX and DETY for each event in the final _common_clean file
| Quadrant A | 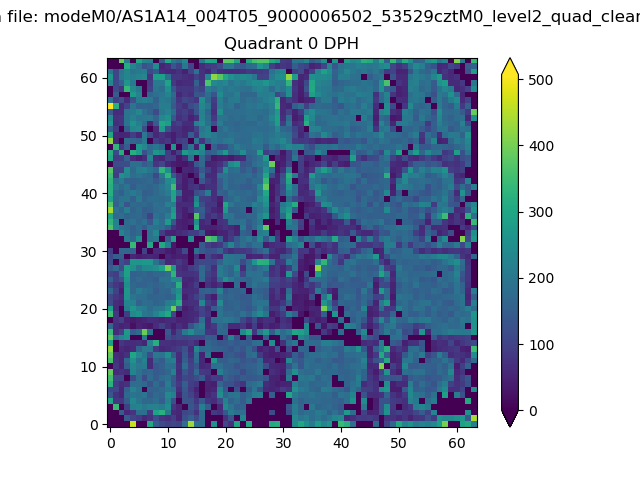 |
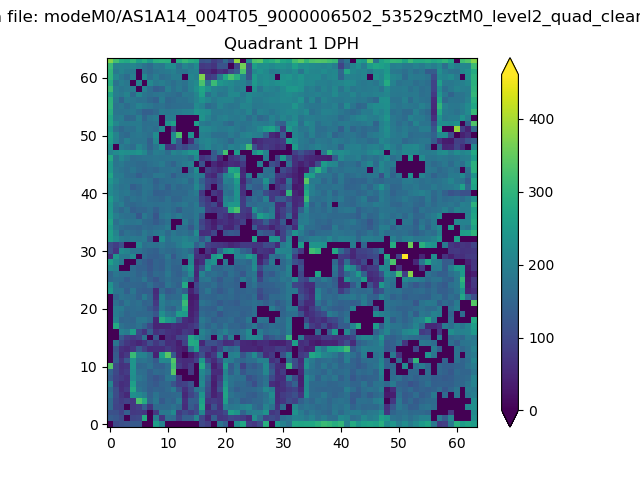 |
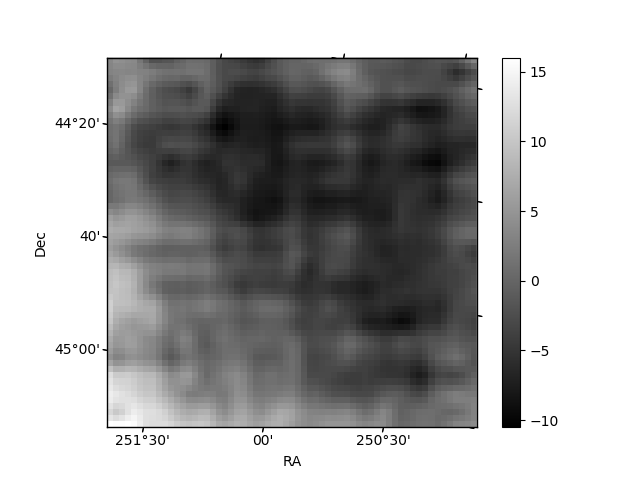
Quadrant B |
|---|---|---|---|
| Quadrant D | 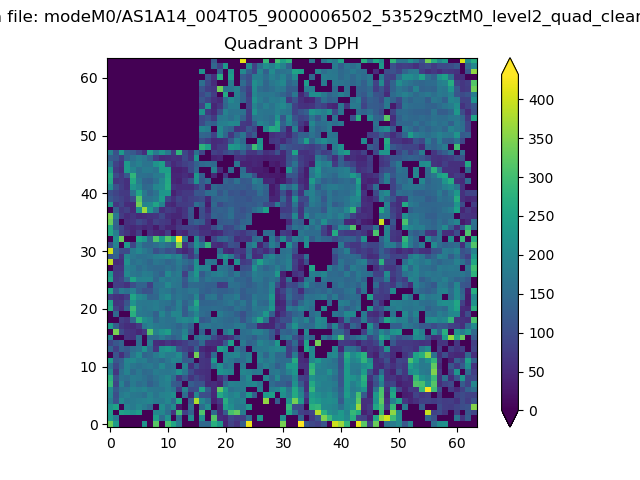 |
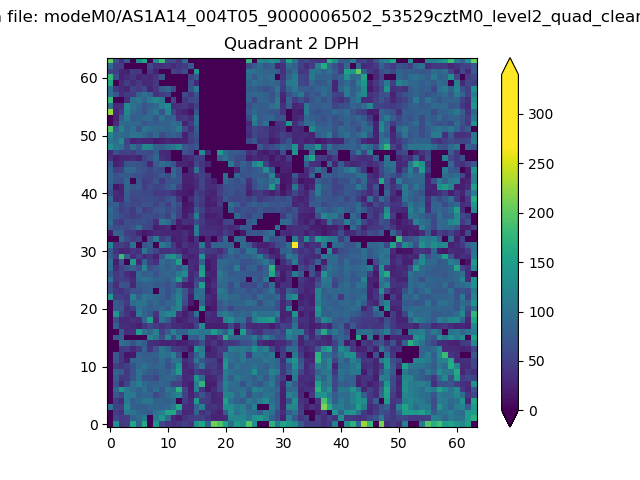 |
Quadrant C |
| Plot type | Count rate plots | Images |
|---|---|---|
| Comparison with Poisson distribution Blue bars denote a histogram of data divided into 1 sec bins. Red curve is a Poisson curve with rate = median count rate of data. |
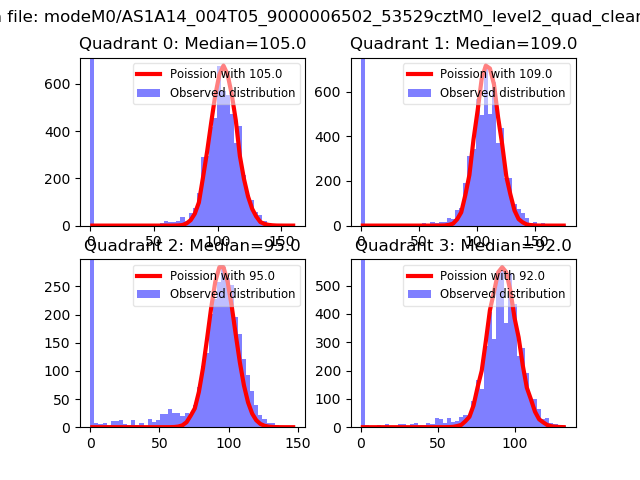 |
 |
| Quadrant-wise count rates Data is divided into 100 sec bins |
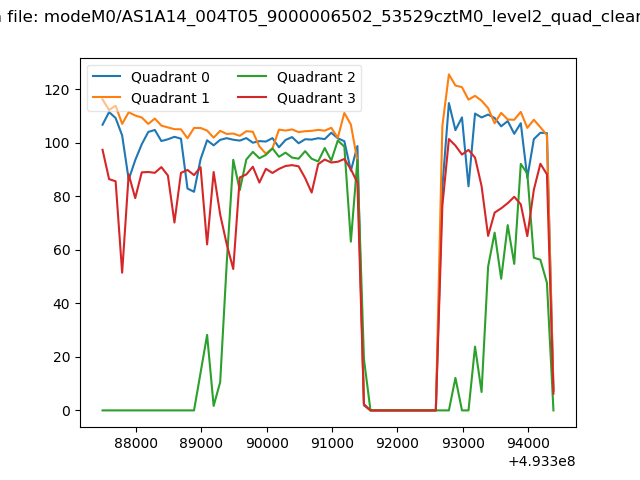 |
|
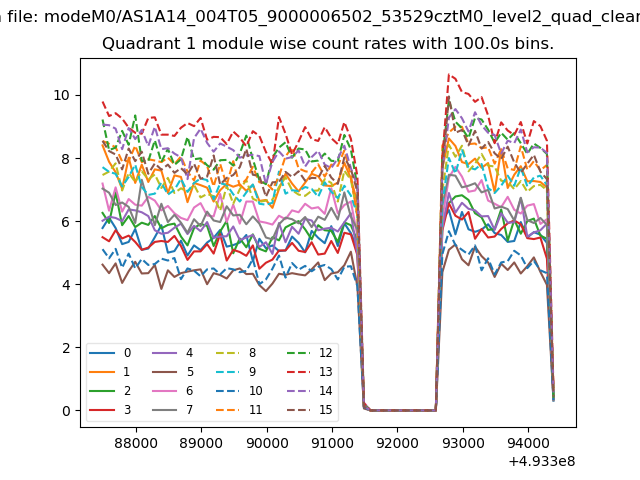
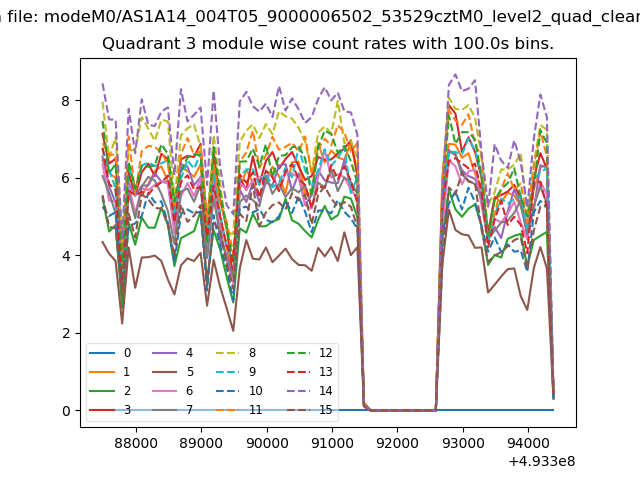
| Module-wise count rates for Quadrant A Data is divided into 100 sec bins |
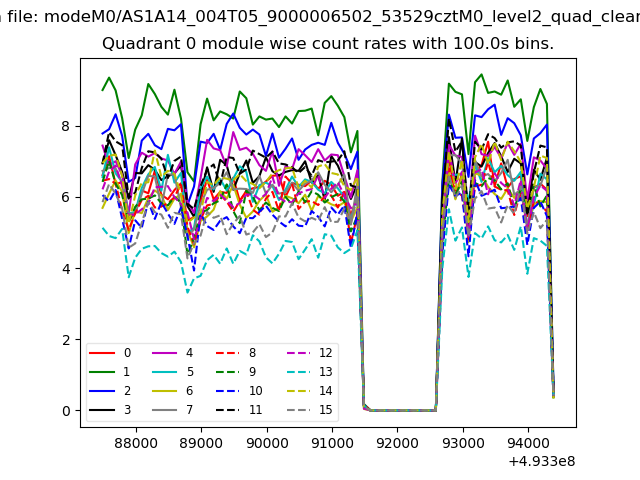 |
 |
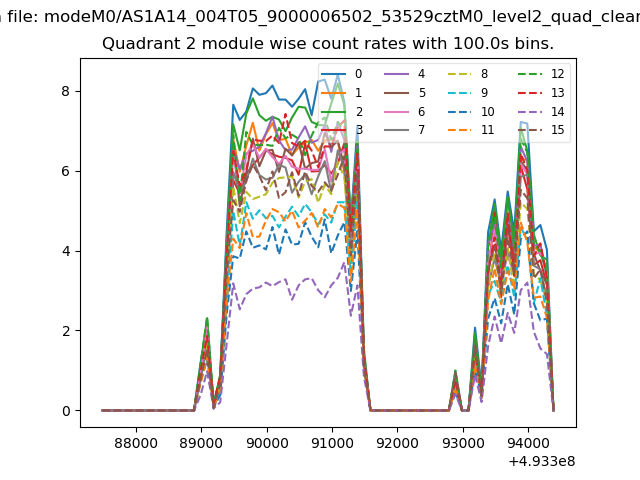
| Module-wise count rates for Quadrant B Data is divided into 100 sec bins |
 |
 |
| Module-wise count rates for Quadrant C Data is divided into 100 sec bins |
 |
 |
| Module-wise count rates for Quadrant D Data is divided into 100 sec bins |
 |
 |
| Parameter | Plot |
|---|---|
| CZT HV Monitor | 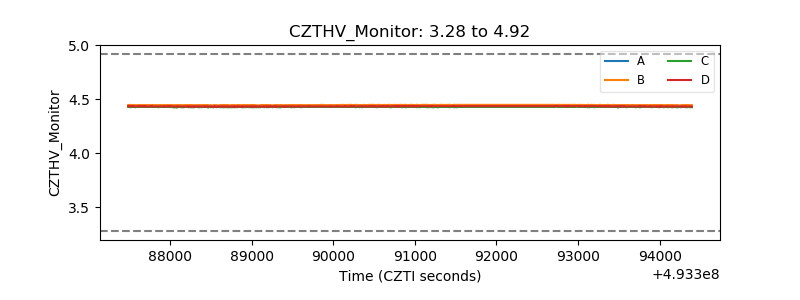 |
| D_VDD | 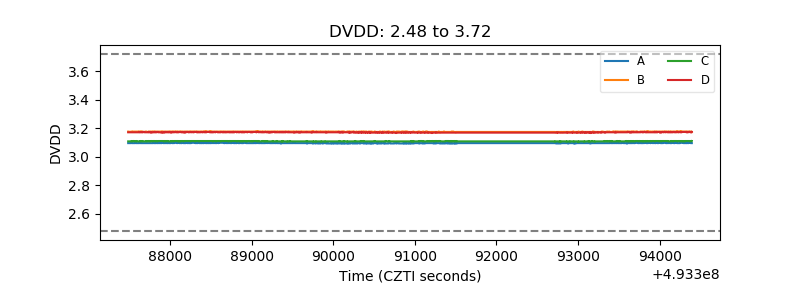 |
| Temperature 1 | 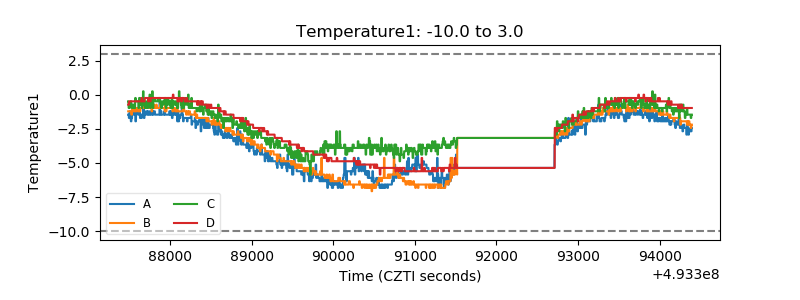 |
| Veto HV Monitor |  |
| Veto LLD | 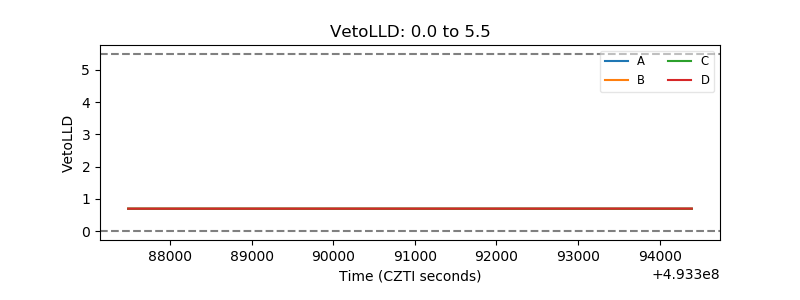 |
| Alpha Counter | 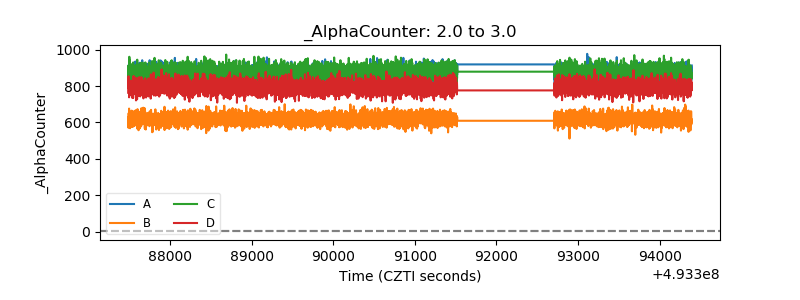 |
| _CPM_Rate | 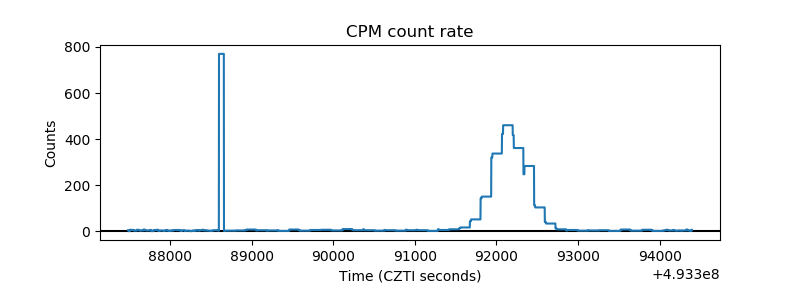 |
| CZT Counter | 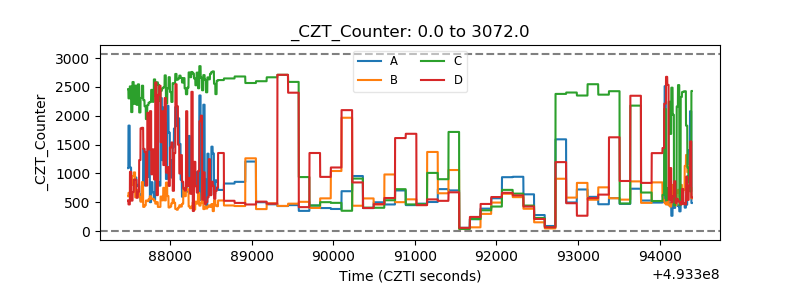 |
| +2.5 Volts monitor |  |
| +5 Volts monitor |  |
| _ROLL_ROT | 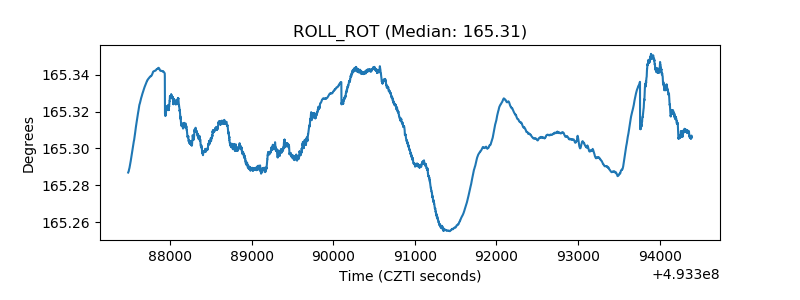 |
| _Roll_DEC | 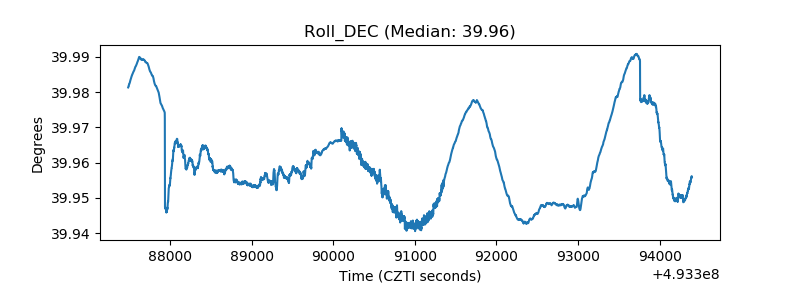 |
| _Roll_RA | 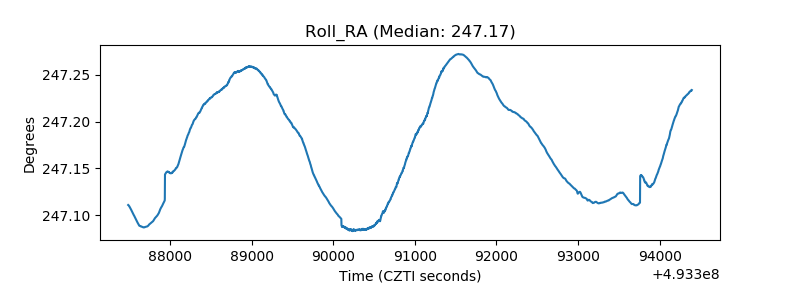 |
| Veto Counter | 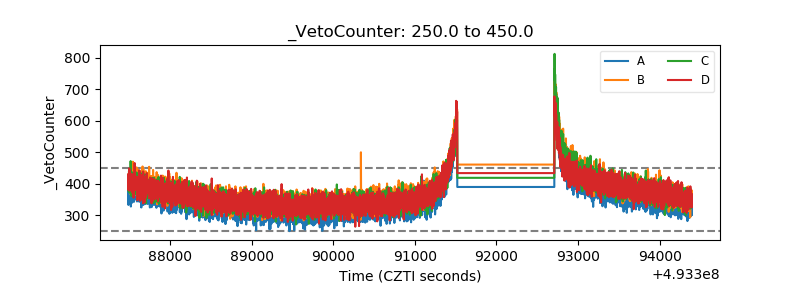 |