| Param | Original file | Final file |
|---|---|---|
| Filename | modeM0/AS1A14_004T05_9000006502_53531cztM0_level2.fits | modeM0/AS1A14_004T05_9000006502_53531cztM0_level2_quad_clean.evt |
| Size (bytes) | 1,290,430,080 | 179,101,440 |
| Size | 1.2 GB | 170.8 MB |
| Events in quadrant A | 9,074,333 | 1,262,284 |
| Events in quadrant B | 7,366,329 | 1,350,317 |
| Events in quadrant C | 18,357,360 | 845,885 |
| Events in quadrant D | 11,976,916 | 1,076,371 |
| Mode M9 | |||
|---|---|---|---|
| Quadrant | BADHDUFLAG | Total packets | Discarded packets |
| A | 0 | 30 | 0 |
| B | 0 | 30 | 0 |
| C | 0 | 30 | 0 |
| D | 0 | 30 | 0 |
| Mode SS | |||
|---|---|---|---|
| Quadrant | BADHDUFLAG | Total packets | Discarded packets |
| A | 0 | 260 | 0 |
| B | 0 | 260 | 0 |
| C | 0 | 260 | 0 |
| D | 0 | 260 | 0 |
| Mode M0 | |||
|---|---|---|---|
| Quadrant | BADHDUFLAG | Total packets | Discarded packets |
| A | 0 | 35814 | 3 |
| B | 0 | 30799 | 10 |
| C | 0 | 63384 | 3 |
| D | 0 | 44294 | 3 |
| Quadrant | Total seconds | Saturated seconds | Saturation percentage |
|---|---|---|---|
| A | 12852 | 681 | 5.298786% |
| B | 12850 | 463 | 3.603113% |
| C | 12852 | 4379 | 34.072518% |
| D | 12852 | 1469 | 11.430128% |
Noise dominated data is calculated using 1-second bins in cleaned event files. If a bin has >2000 counts, and if more than 50% of those come from <1% of pixels, then it is considered to be noise-dominated and hence unusable.
| Quadrant | # 1 sec bins | Bins with >0 counts | Bins with >2000 counts | High rate bins dominated by noise | Noise dominated (total time) | Noise dominated (detector-on time) | Marked lightcurve |
|---|---|---|---|---|---|---|---|
| A | 34577 | 12854 | 368 | 368 | 1.06% | 2.86% | 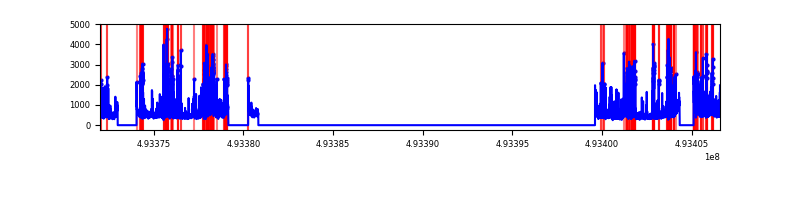 |
| B | 34576 | 12852 | 168 | 168 | 0.49% | 1.31% | 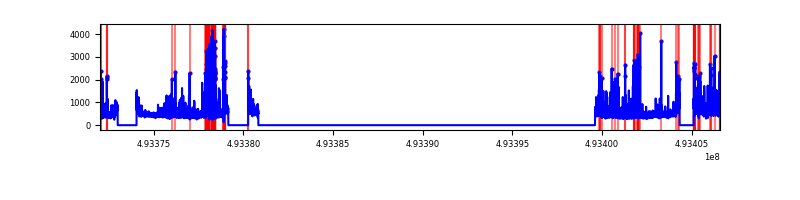 |
| C | 34575 | 12853 | 3953 | 3953 | 11.43% | 30.76% | 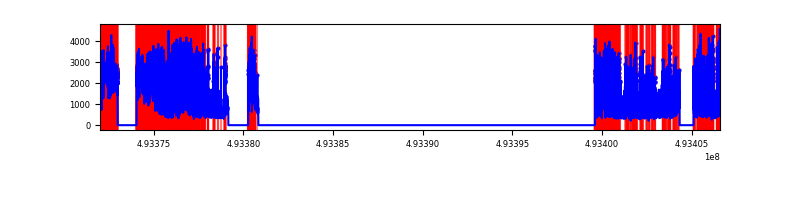 |
| D | 34576 | 12854 | 1219 | 1219 | 3.53% | 9.48% |  |
Top three noisy pixels from each quadrant. If the there are fewer than three noisy pixels in the level2.evt file, extra rows are filled as -1
| Pixel properties | Quadrant properties | ||||||
|---|---|---|---|---|---|---|---|
| Quadrant | DetID | PixID | Counts | Sigma | Mean | Median | Sigma |
| A | 3 | 62 | 1138107 | 3241.83 | 1424 | 1387 | 350.6 |
| A | 15 | 174 | 968294 | 2757.54 | 1424 | 1387 | 350.6 |
| A | 3 | 63 | 470548 | 1338.01 | 1424 | 1387 | 350.6 |
| B | 2 | 249 | 454763 | 1511.35 | 1413 | 1367 | 300.0 |
| B | 10 | 28 | 402952 | 1338.64 | 1413 | 1367 | 300.0 |
| B | 4 | 81 | 182824 | 604.87 | 1413 | 1367 | 300.0 |
| C | 15 | 224 | 4784263 | 14969.73 | 1154 | 1142 | 319.5 |
| C | 1 | 241 | 2936580 | 9187.04 | 1154 | 1142 | 319.5 |
| C | 7 | 64 | 2815142 | 8806.98 | 1154 | 1142 | 319.5 |
| D | 6 | 239 | 2371805 | 6166.23 | 1356 | 1299 | 384.4 |
| D | 3 | 12 | 1941437 | 5046.75 | 1356 | 1299 | 384.4 |
| D | 7 | 70 | 553254 | 1435.76 | 1356 | 1299 | 384.4 |
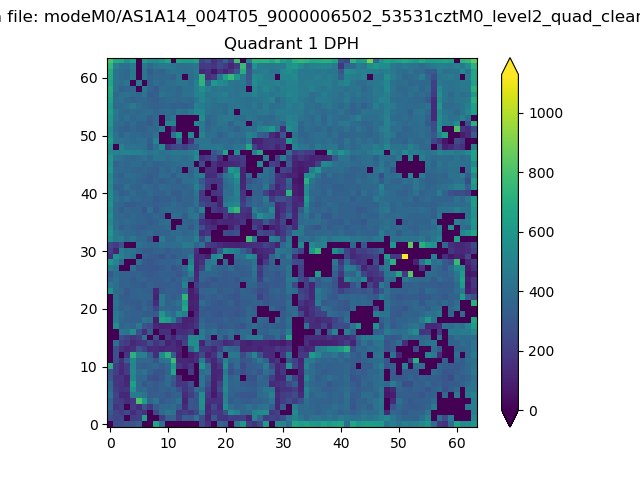
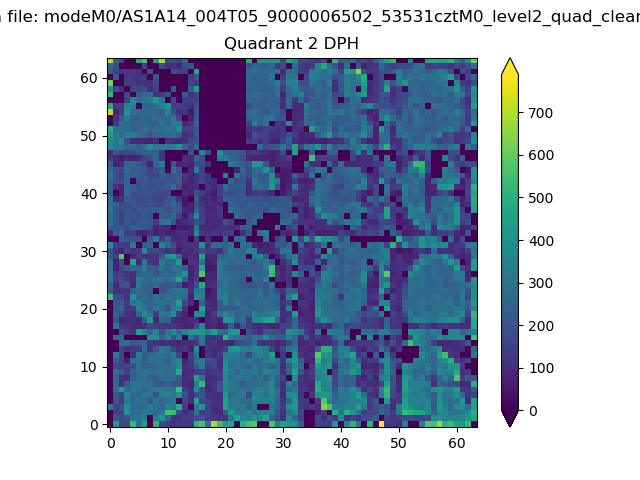
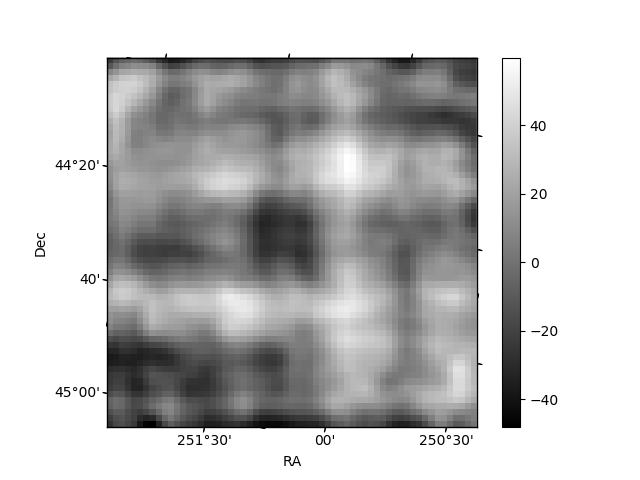
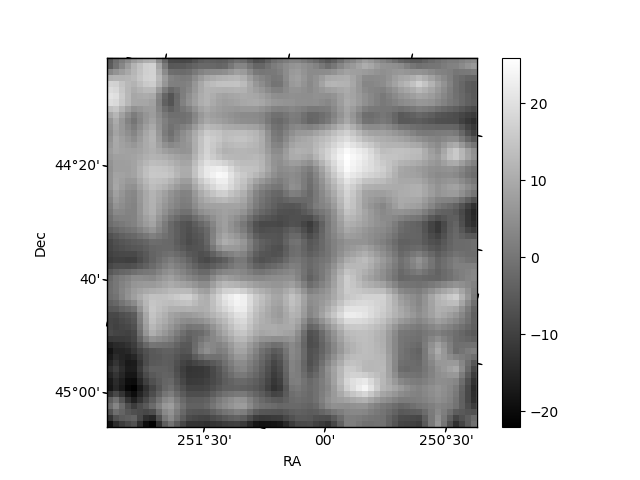
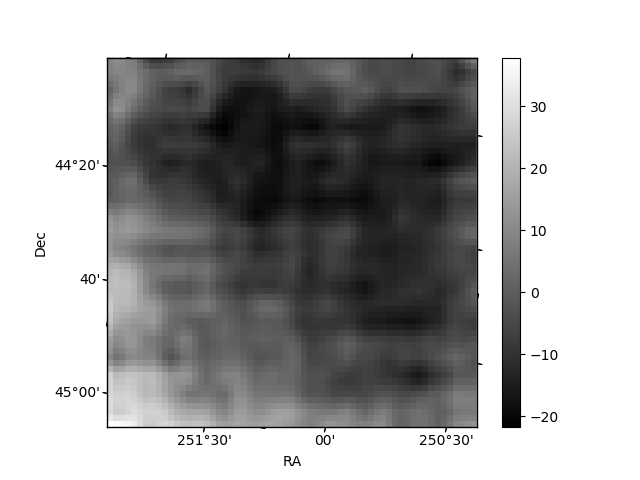
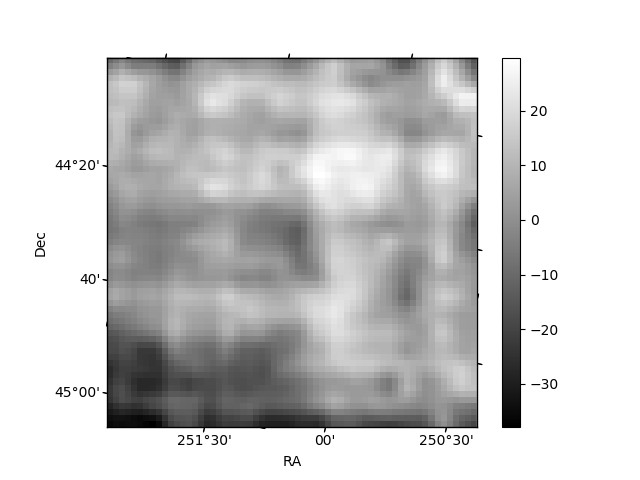
Histogram calculated using DETX and DETY for each event in the final _common_clean file
| Quadrant A | 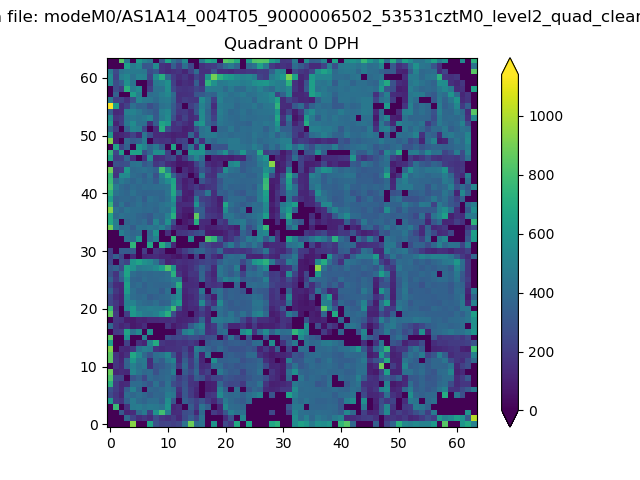 |
 |
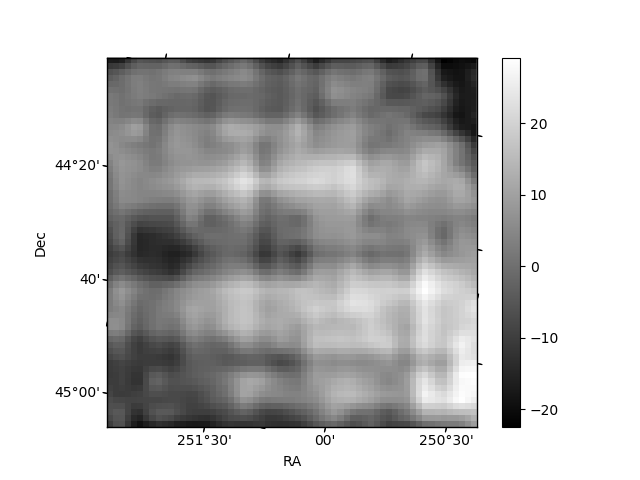
Quadrant B |
|---|---|---|---|
| Quadrant D | 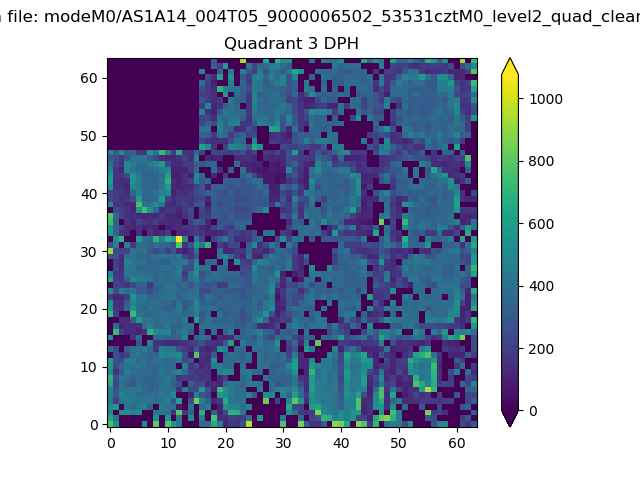 |
 |
Quadrant C |
| Plot type | Count rate plots | Images |
|---|---|---|
| Comparison with Poisson distribution Blue bars denote a histogram of data divided into 1 sec bins. Red curve is a Poisson curve with rate = median count rate of data. |
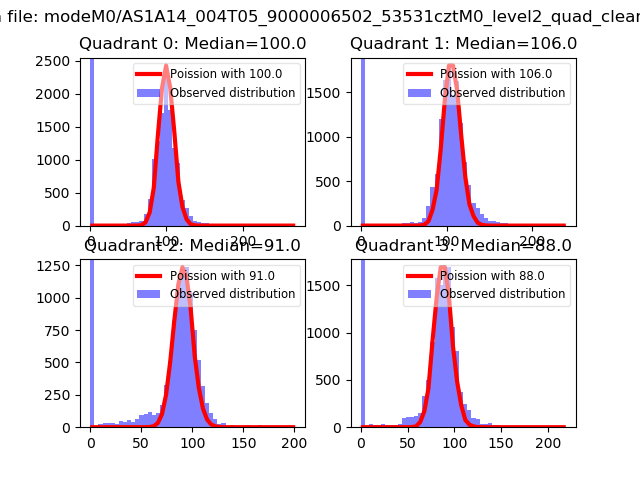 |
 |
| Quadrant-wise count rates Data is divided into 100 sec bins |
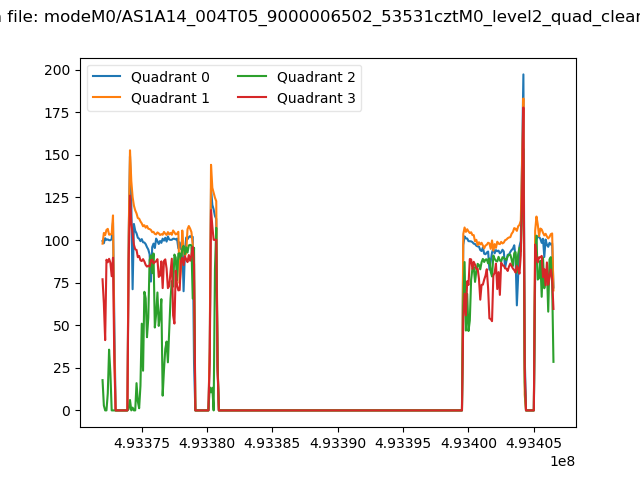 |
|
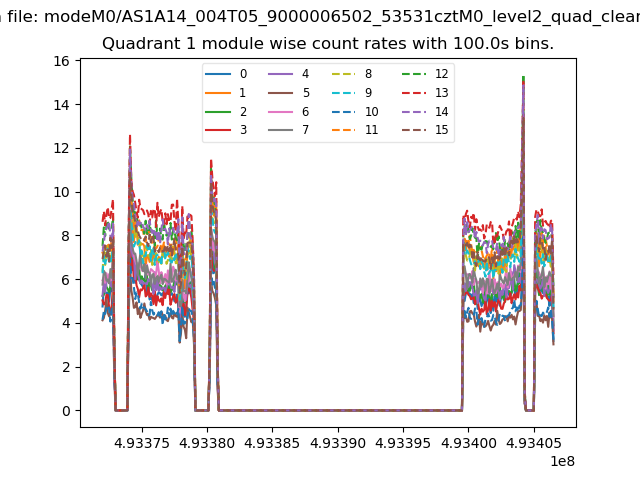
| Module-wise count rates for Quadrant A Data is divided into 100 sec bins |
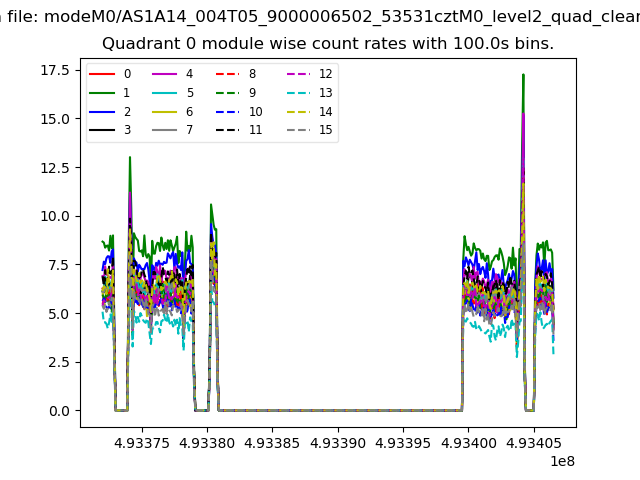 |
 |
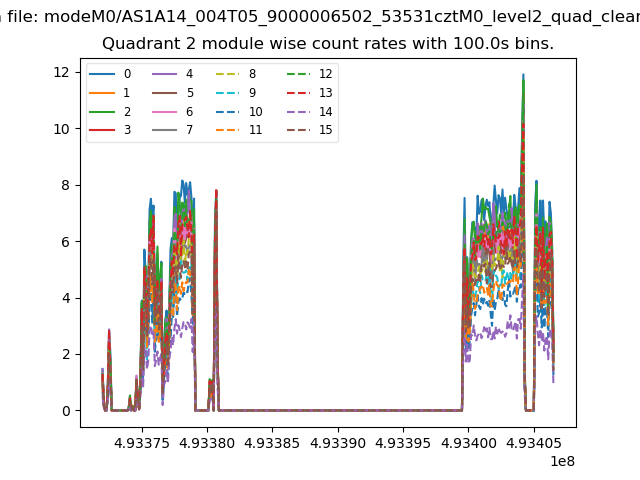
| Module-wise count rates for Quadrant B Data is divided into 100 sec bins |
 |
 |
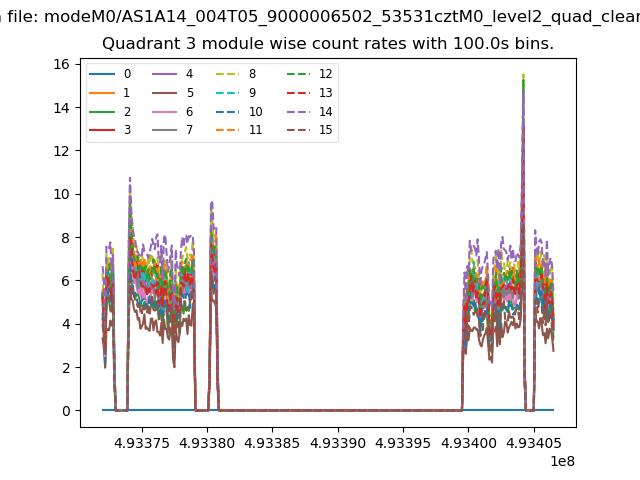
| Module-wise count rates for Quadrant C Data is divided into 100 sec bins |
 |
 |
| Module-wise count rates for Quadrant D Data is divided into 100 sec bins |
 |
 |
| Parameter | Plot |
|---|---|
| CZT HV Monitor | 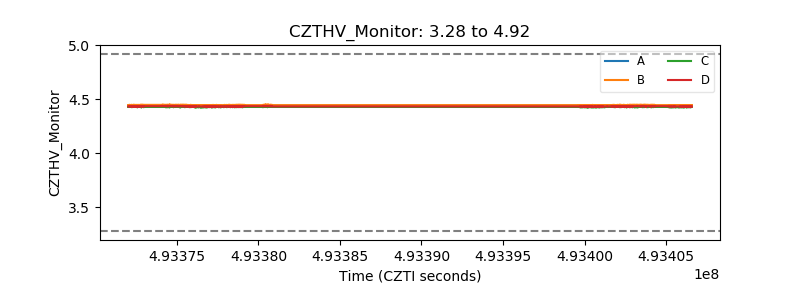 |
| D_VDD | 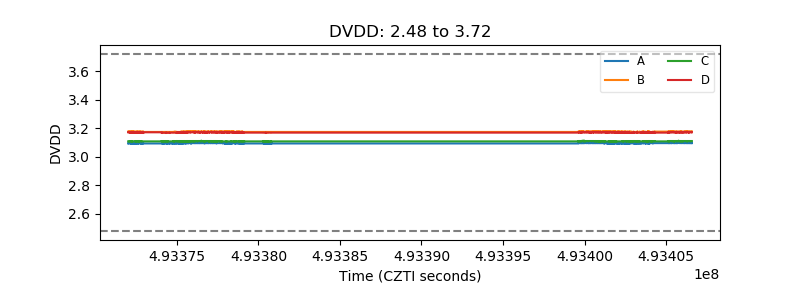 |
| Temperature 1 | 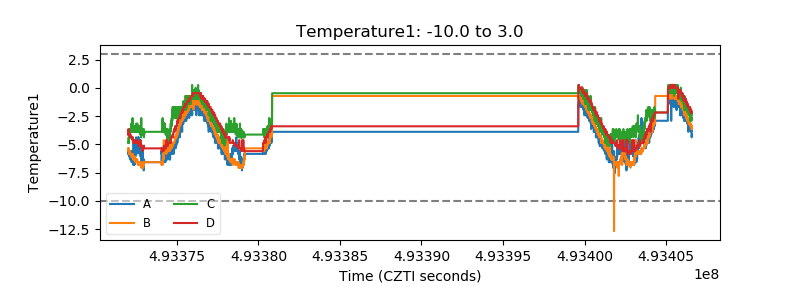 |
| Veto HV Monitor |  |
| Veto LLD | 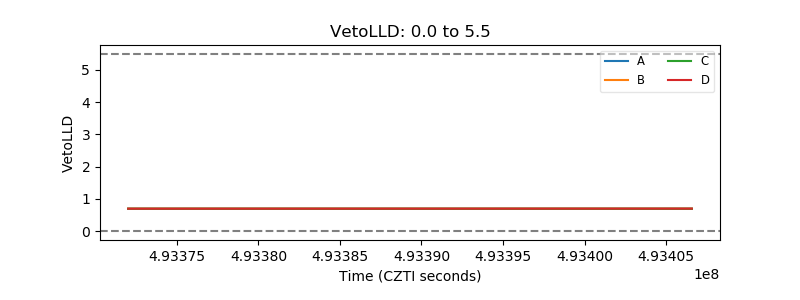 |
| Alpha Counter | 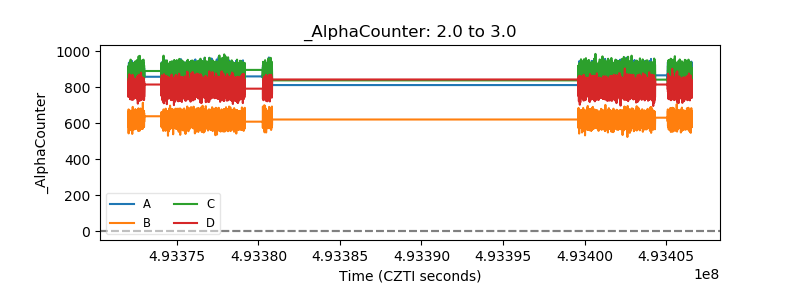 |
| _CPM_Rate | 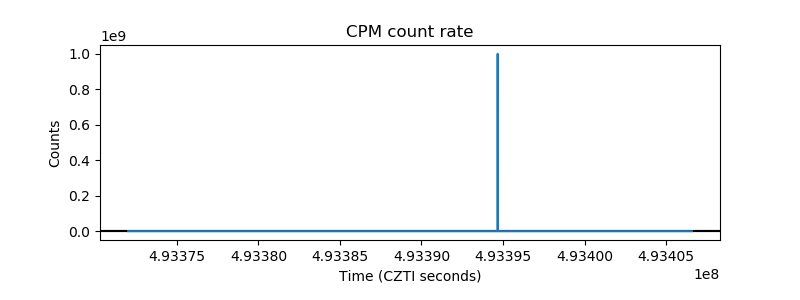 |
| CZT Counter | 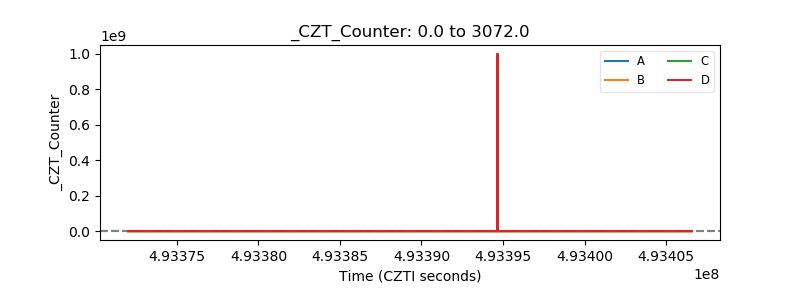 |
| +2.5 Volts monitor | 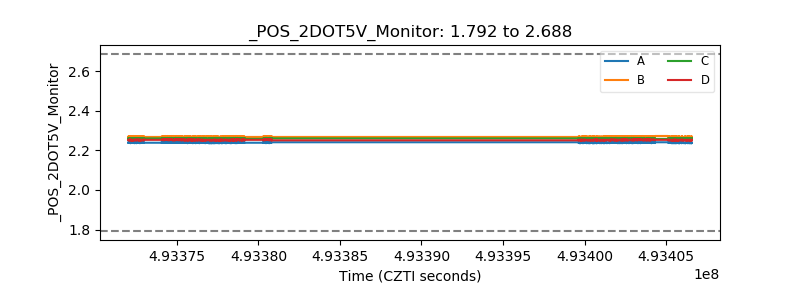 |
| +5 Volts monitor | 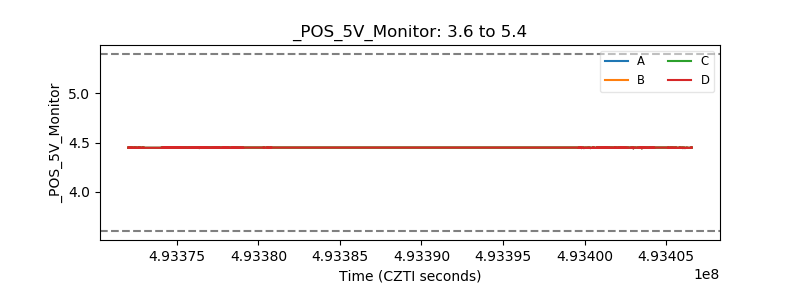 |
| _ROLL_ROT | 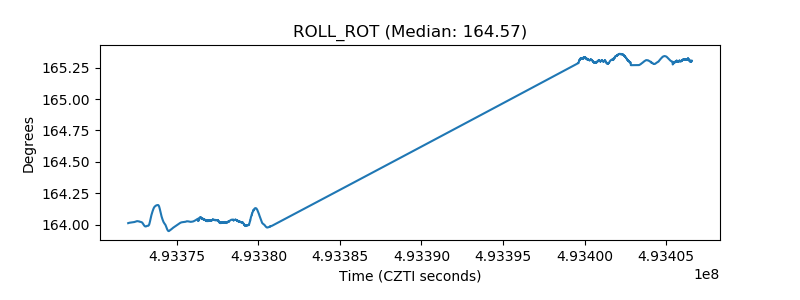 |
| _Roll_DEC | 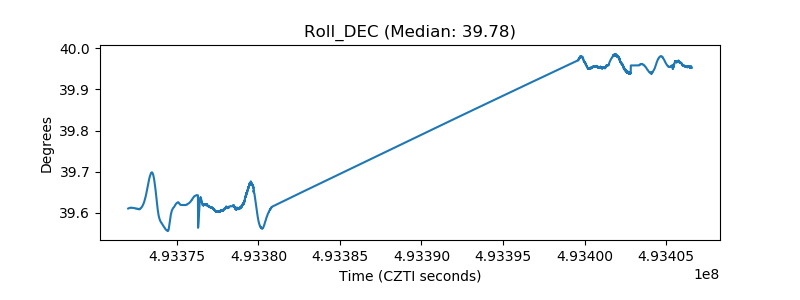 |
| _Roll_RA | 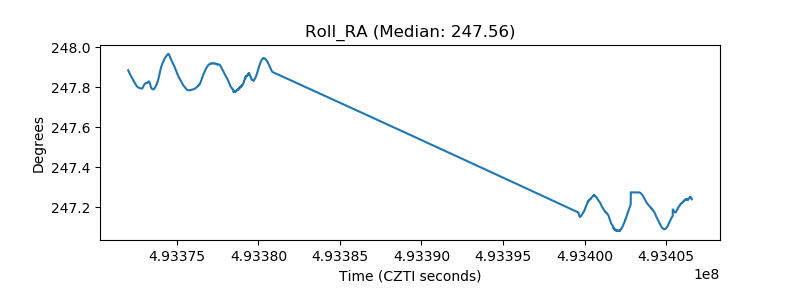 |
| Veto Counter | 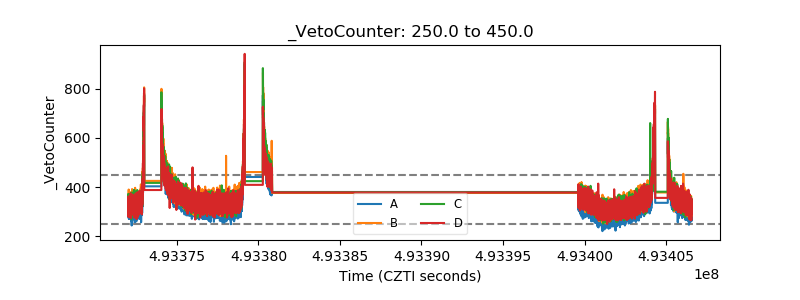 |