| Param | Original file | Final file |
|---|---|---|
| Filename | modeM0/AS1A14_004T05_9000006502_53532cztM0_level2.fits | modeM0/AS1A14_004T05_9000006502_53532cztM0_level2_quad_clean.evt |
| Size (bytes) | 677,666,880 | 102,980,160 |
| Size | 646.3 MB | 98.2 MB |
| Events in quadrant A | 4,680,673 | 709,161 |
| Events in quadrant B | 4,735,507 | 749,601 |
| Events in quadrant C | 8,460,536 | 550,135 |
| Events in quadrant D | 6,639,305 | 597,286 |
| Mode SS | |||
|---|---|---|---|
| Quadrant | BADHDUFLAG | Total packets | Discarded packets |
| A | 0 | 148 | 0 |
| B | 0 | 148 | 0 |
| C | 0 | 148 | 0 |
| D | 0 | 148 | 0 |
| Mode M0 | |||
|---|---|---|---|
| Quadrant | BADHDUFLAG | Total packets | Discarded packets |
| A | 0 | 19044 | 3 |
| B | 0 | 19009 | 4 |
| C | 0 | 30324 | 3 |
| D | 0 | 24792 | 3 |
| Quadrant | Total seconds | Saturated seconds | Saturation percentage |
|---|---|---|---|
| A | 7347 | 216 | 2.939976% |
| B | 7346 | 237 | 3.226246% |
| C | 7347 | 1627 | 22.145093% |
| D | 7347 | 803 | 10.929631% |
Noise dominated data is calculated using 1-second bins in cleaned event files. If a bin has >2000 counts, and if more than 50% of those come from <1% of pixels, then it is considered to be noise-dominated and hence unusable.
| Quadrant | # 1 sec bins | Bins with >0 counts | Bins with >2000 counts | High rate bins dominated by noise | Noise dominated (total time) | Noise dominated (detector-on time) | Marked lightcurve |
|---|---|---|---|---|---|---|---|
| A | 7442 | 7350 | 112 | 112 | 1.50% | 1.52% | 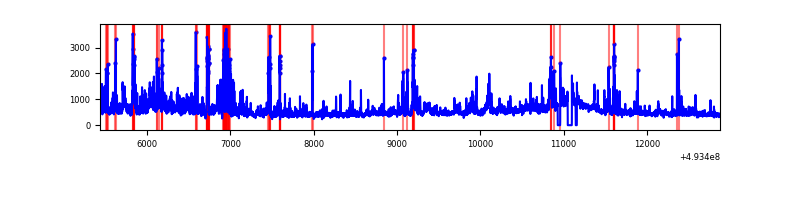 |
| B | 7441 | 7349 | 94 | 94 | 1.26% | 1.28% | 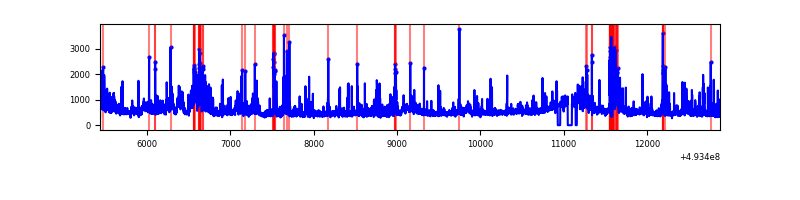 |
| C | 7442 | 7350 | 1332 | 1332 | 17.90% | 18.12% | 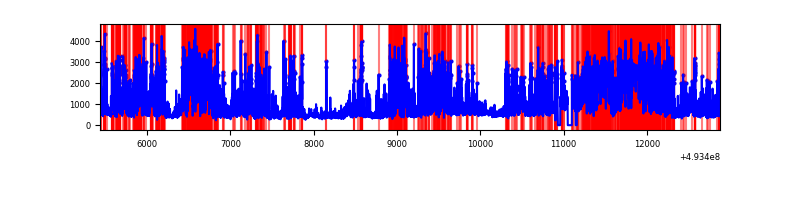 |
| D | 7442 | 7350 | 712 | 712 | 9.57% | 9.69% | 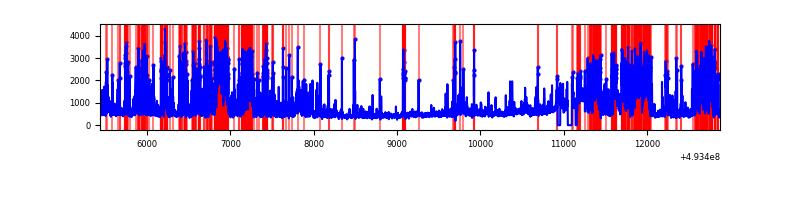 |
Top three noisy pixels from each quadrant. If the there are fewer than three noisy pixels in the level2.evt file, extra rows are filled as -1
| Pixel properties | Quadrant properties | ||||||
|---|---|---|---|---|---|---|---|
| Quadrant | DetID | PixID | Counts | Sigma | Mean | Median | Sigma |
| A | 3 | 62 | 455007 | 2265.84 | 809 | 789 | 200.5 |
| A | 0 | 8 | 357518 | 1779.52 | 809 | 789 | 200.5 |
| A | 3 | 63 | 304665 | 1515.87 | 809 | 789 | 200.5 |
| B | 10 | 254 | 332100 | 1918.29 | 796 | 767 | 172.7 |
| B | 4 | 81 | 278637 | 1608.76 | 796 | 767 | 172.7 |
| B | 10 | 28 | 236872 | 1366.96 | 796 | 767 | 172.7 |
| C | 15 | 224 | 4487556 | 22912.38 | 708 | 699 | 195.8 |
| C | 4 | 5 | 333246 | 1698.17 | 708 | 699 | 195.8 |
| C | 12 | 249 | 214701 | 1092.81 | 708 | 699 | 195.8 |
| D | 7 | 70 | 1421395 | 6556.3 | 762 | 727 | 216.7 |
| D | 6 | 239 | 787008 | 3628.64 | 762 | 727 | 216.7 |
| D | 3 | 12 | 439410 | 2024.5 | 762 | 727 | 216.7 |
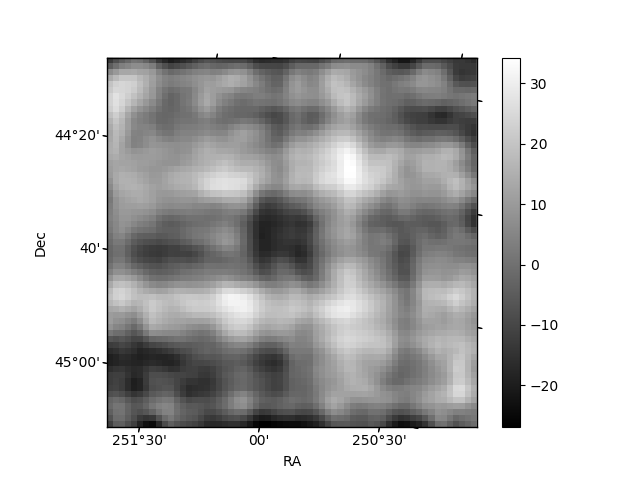
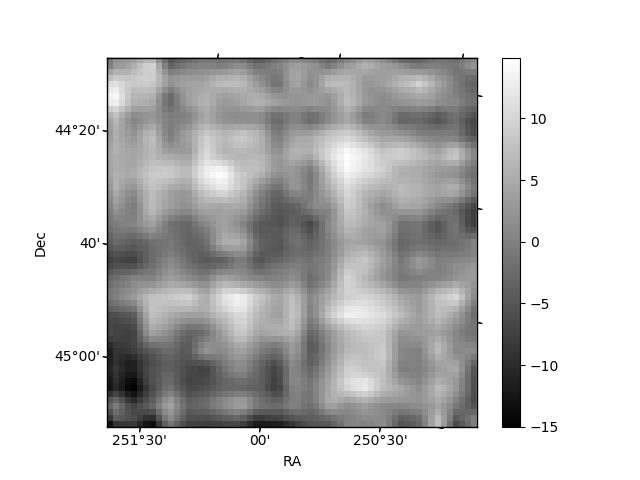
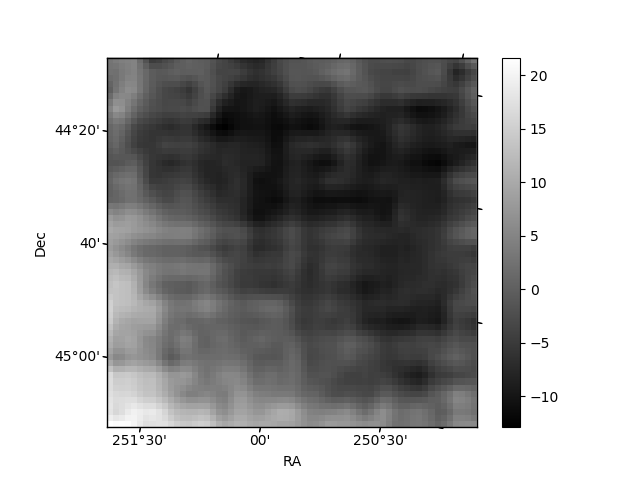
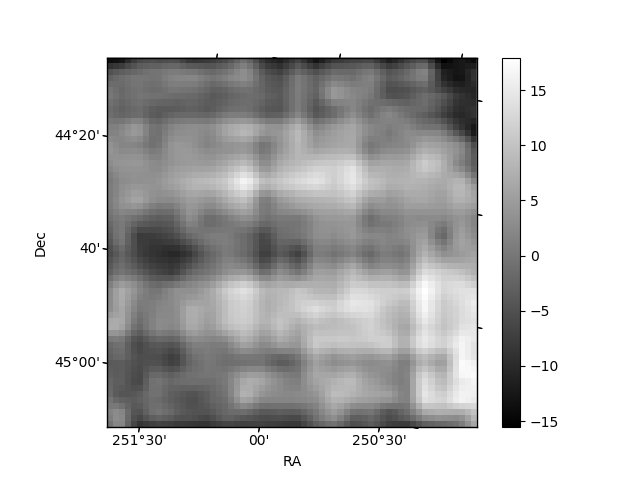
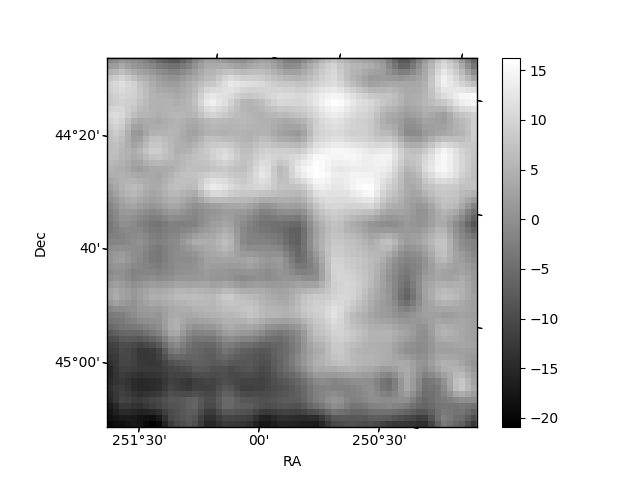
Histogram calculated using DETX and DETY for each event in the final _common_clean file
| Quadrant A | 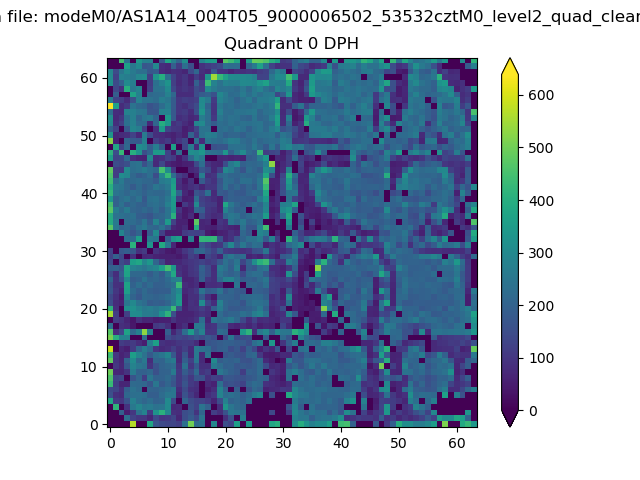 |
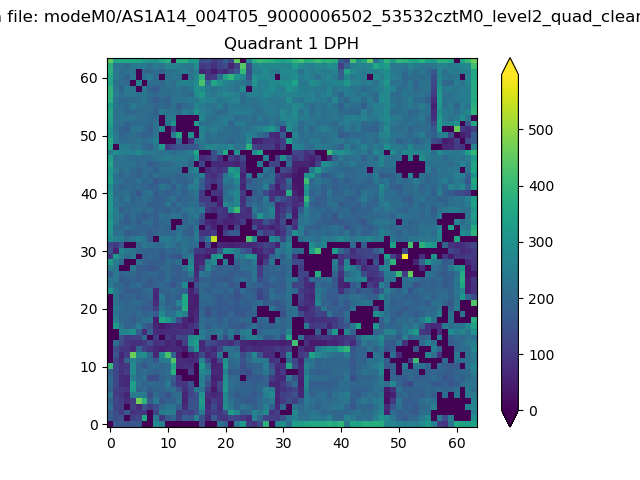 |
Quadrant B |
|---|---|---|---|
| Quadrant D | 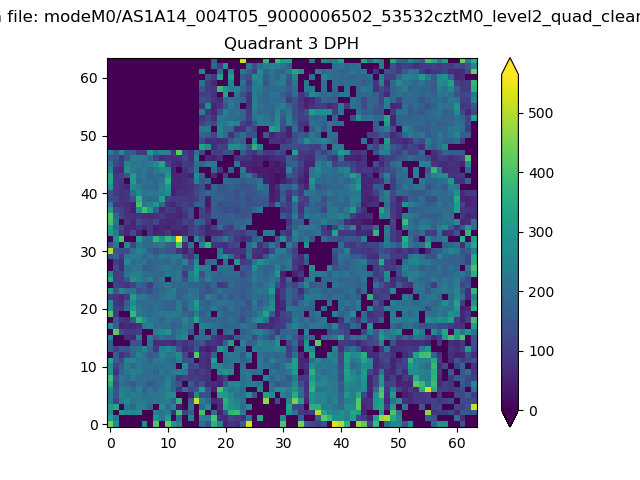 |
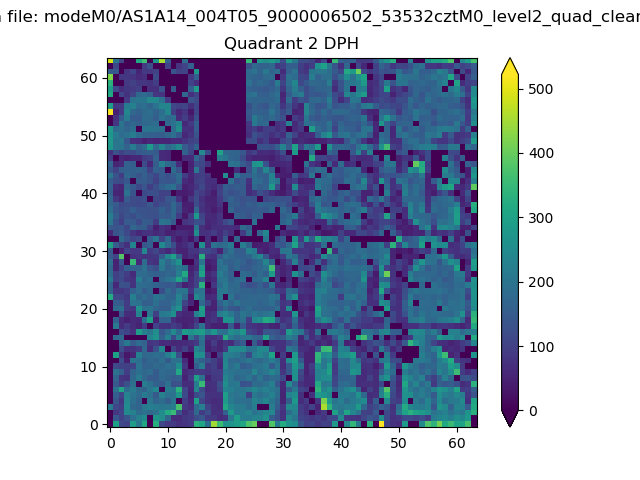 |
Quadrant C |
| Plot type | Count rate plots | Images |
|---|---|---|
| Comparison with Poisson distribution Blue bars denote a histogram of data divided into 1 sec bins. Red curve is a Poisson curve with rate = median count rate of data. |
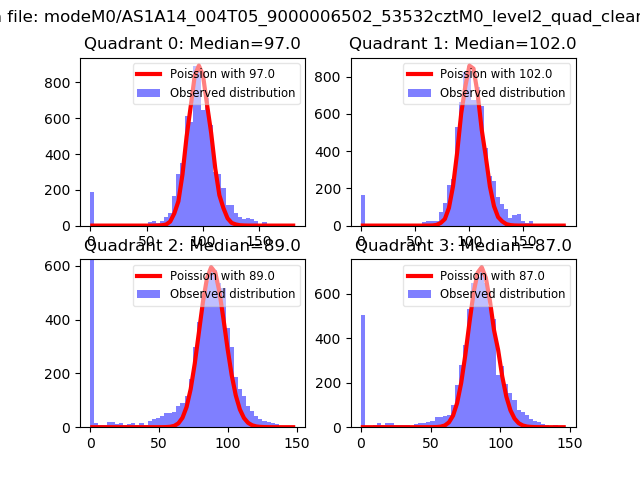 |
 |
| Quadrant-wise count rates Data is divided into 100 sec bins |
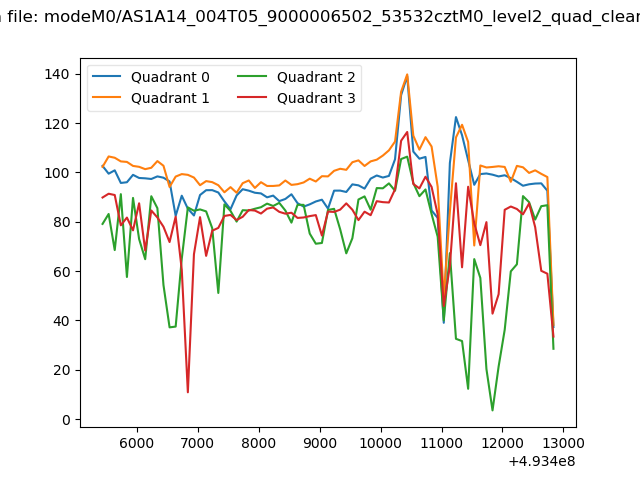 |
|
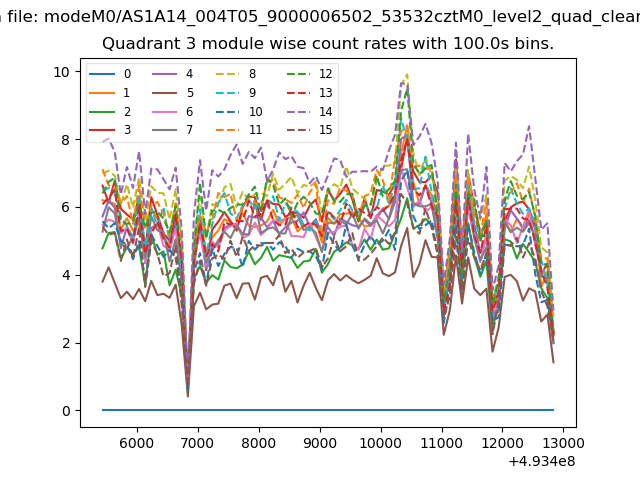
| Module-wise count rates for Quadrant A Data is divided into 100 sec bins |
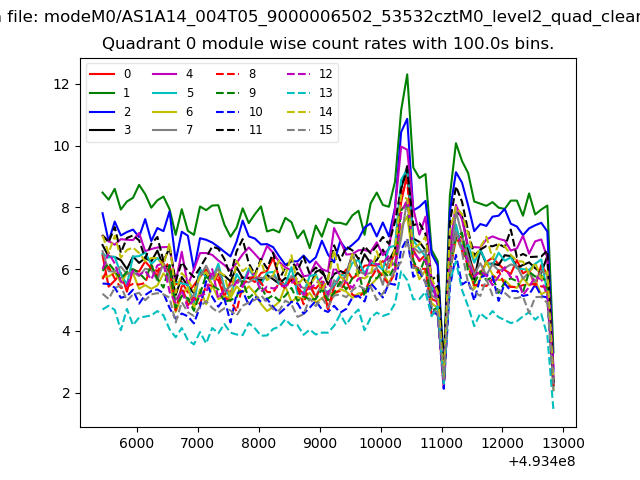 |
 |
| Module-wise count rates for Quadrant B Data is divided into 100 sec bins |
 |
 |
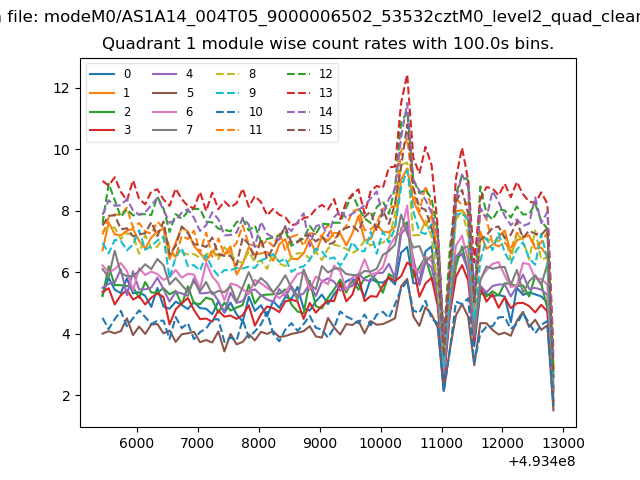
| Module-wise count rates for Quadrant C Data is divided into 100 sec bins |
 |
 |
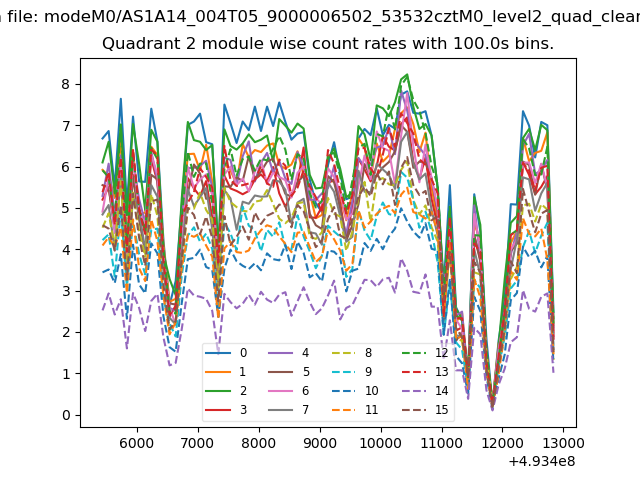
| Module-wise count rates for Quadrant D Data is divided into 100 sec bins |
 |
 |
| Parameter | Plot |
|---|---|
| CZT HV Monitor | 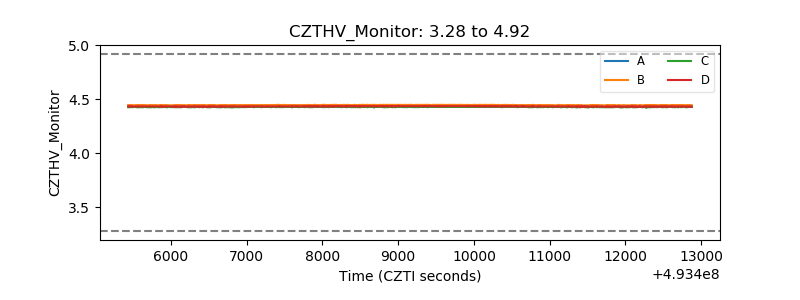 |
| D_VDD | 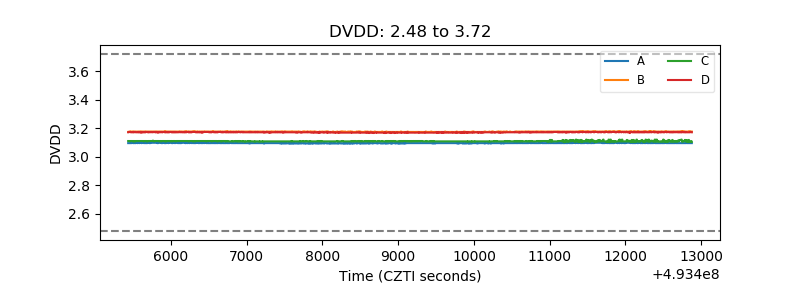 |
| Temperature 1 | 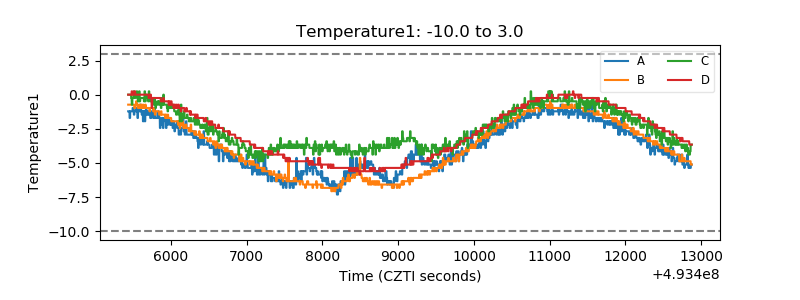 |
| Veto HV Monitor | 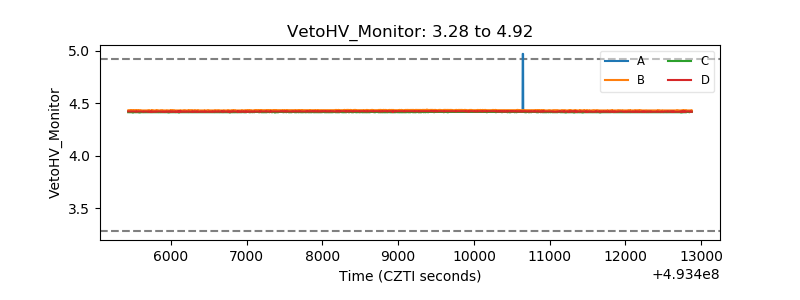 |
| Veto LLD | 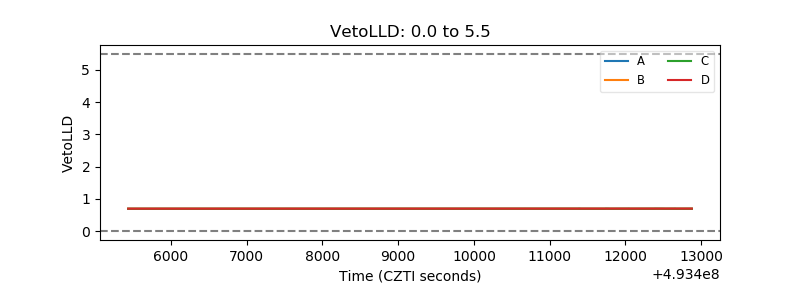 |
| Alpha Counter | 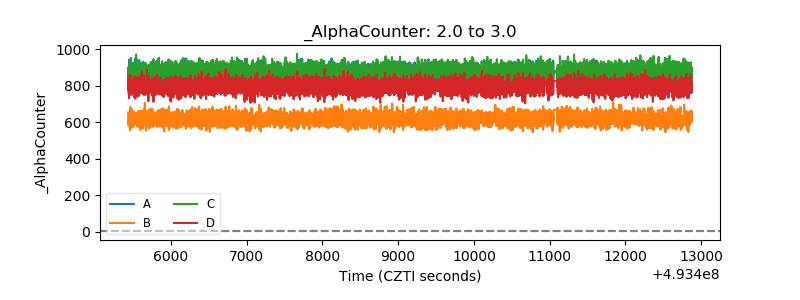 |
| _CPM_Rate | 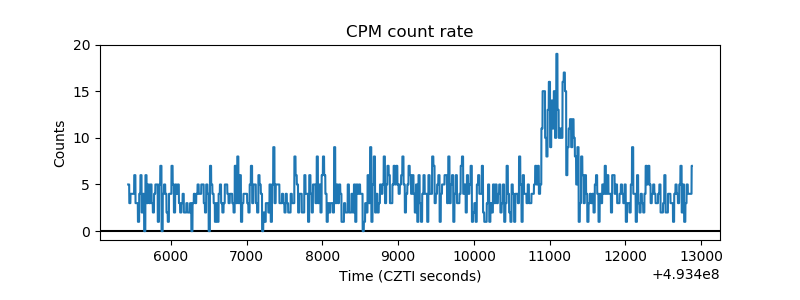 |
| CZT Counter | 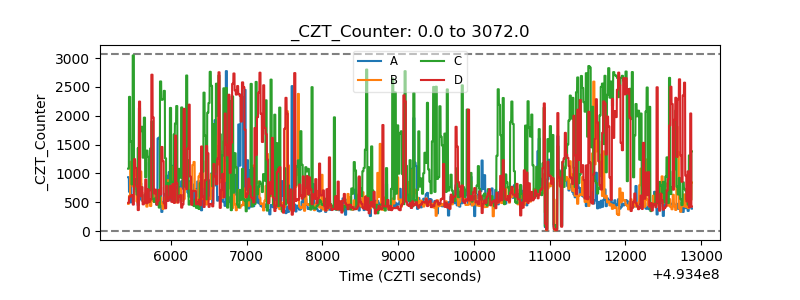 |
| +2.5 Volts monitor |  |
| +5 Volts monitor | 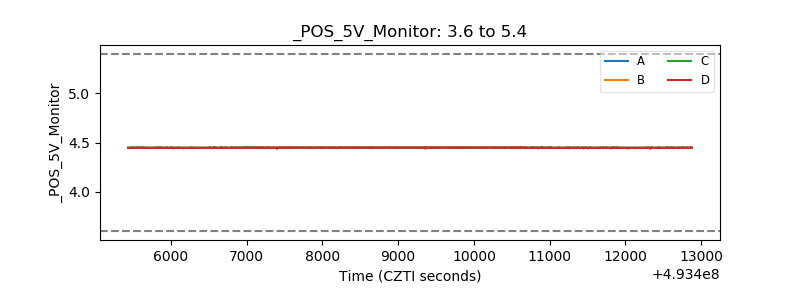 |
| _ROLL_ROT | 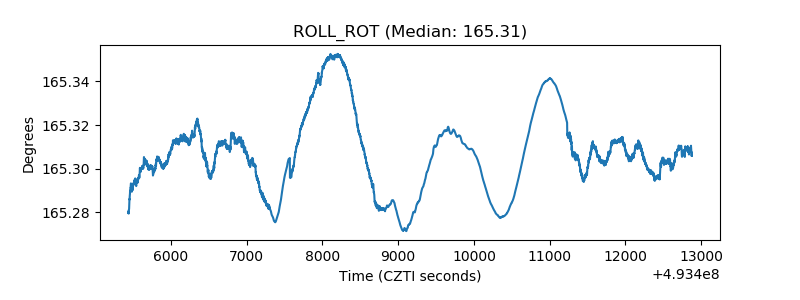 |
| _Roll_DEC | 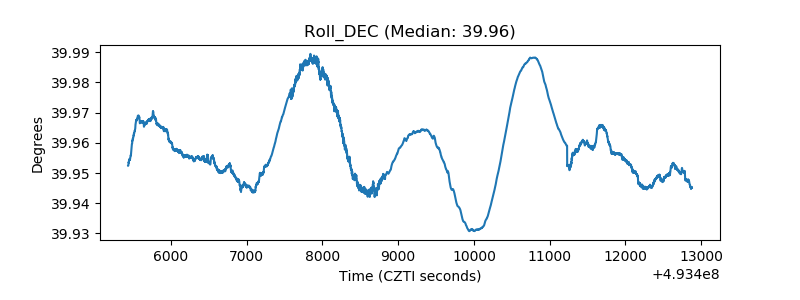 |
| _Roll_RA | 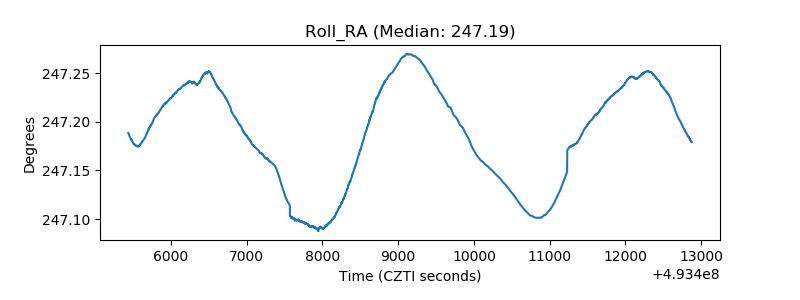 |
| Veto Counter | 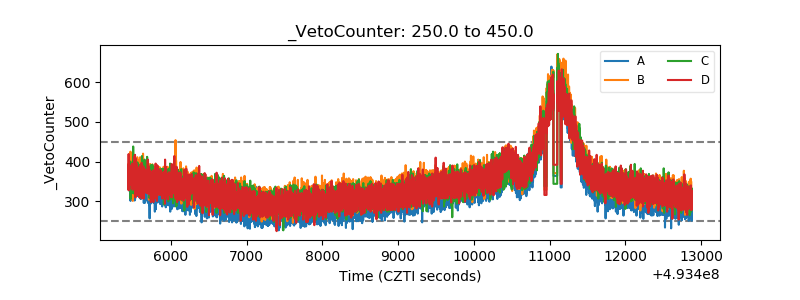 |