| Param | Original file | Final file |
|---|---|---|
| Filename | modeM0/AS1A14_004T05_9000006502_53533cztM0_level2.fits | modeM0/AS1A14_004T05_9000006502_53533cztM0_level2_quad_clean.evt |
| Size (bytes) | 715,800,960 | 112,769,280 |
| Size | 682.6 MB | 107.5 MB |
| Events in quadrant A | 5,230,016 | 781,393 |
| Events in quadrant B | 5,279,713 | 803,348 |
| Events in quadrant C | 8,786,103 | 608,718 |
| Events in quadrant D | 6,575,674 | 659,528 |
| Mode SS | |||
|---|---|---|---|
| Quadrant | BADHDUFLAG | Total packets | Discarded packets |
| A | 0 | 162 | 0 |
| B | 0 | 162 | 0 |
| C | 0 | 162 | 0 |
| D | 0 | 162 | 0 |
| Mode M0 | |||
|---|---|---|---|
| Quadrant | BADHDUFLAG | Total packets | Discarded packets |
| A | 0 | 21050 | 2 |
| B | 0 | 21431 | 2 |
| C | 0 | 31823 | 3 |
| D | 0 | 25194 | 2 |
| Quadrant | Total seconds | Saturated seconds | Saturation percentage |
|---|---|---|---|
| A | 8072 | 185 | 2.291873% |
| B | 8073 | 410 | 5.078657% |
| C | 8072 | 1639 | 20.304757% |
| D | 8072 | 705 | 8.733895% |
Noise dominated data is calculated using 1-second bins in cleaned event files. If a bin has >2000 counts, and if more than 50% of those come from <1% of pixels, then it is considered to be noise-dominated and hence unusable.
| Quadrant | # 1 sec bins | Bins with >0 counts | Bins with >2000 counts | High rate bins dominated by noise | Noise dominated (total time) | Noise dominated (detector-on time) | Marked lightcurve |
|---|---|---|---|---|---|---|---|
| A | 8087 | 8073 | 127 | 127 | 1.57% | 1.57% | 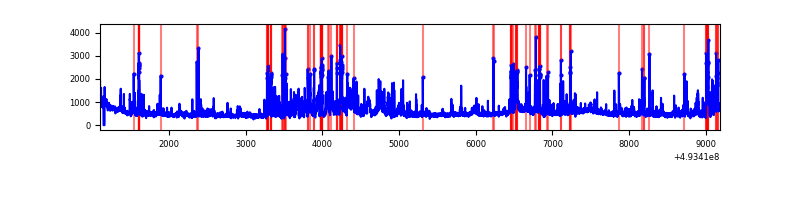 |
| B | 8088 | 8074 | 187 | 187 | 2.31% | 2.32% | 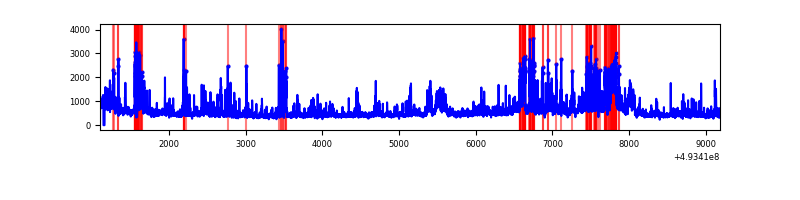 |
| C | 8087 | 8073 | 1341 | 1341 | 16.58% | 16.61% | 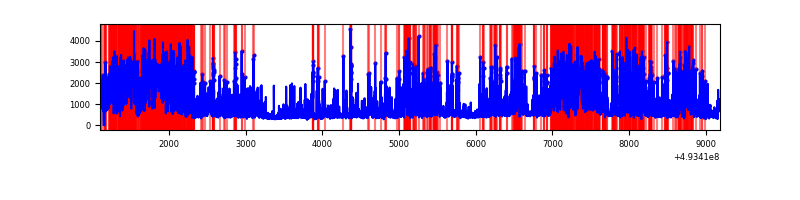 |
| D | 8087 | 8073 | 565 | 565 | 6.99% | 7.00% | 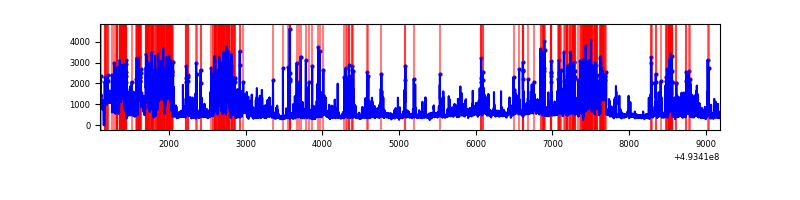 |
Top three noisy pixels from each quadrant. If the there are fewer than three noisy pixels in the level2.evt file, extra rows are filled as -1
| Pixel properties | Quadrant properties | ||||||
|---|---|---|---|---|---|---|---|
| Quadrant | DetID | PixID | Counts | Sigma | Mean | Median | Sigma |
| A | 12 | 80 | 539037 | 2451.31 | 884 | 862 | 219.5 |
| A | 3 | 63 | 401735 | 1825.92 | 884 | 862 | 219.5 |
| A | 3 | 62 | 329878 | 1498.62 | 884 | 862 | 219.5 |
| B | 10 | 28 | 565477 | 3034.35 | 865 | 835 | 186.1 |
| B | 4 | 81 | 442189 | 2371.81 | 865 | 835 | 186.1 |
| B | 8 | 128 | 158145 | 845.38 | 865 | 835 | 186.1 |
| C | 15 | 224 | 4877578 | 22527.4 | 779 | 772 | 216.5 |
| C | 12 | 249 | 191813 | 882.47 | 779 | 772 | 216.5 |
| C | 1 | 241 | 137390 | 631.08 | 779 | 772 | 216.5 |
| D | 7 | 70 | 1204063 | 4991.72 | 838 | 800 | 241.1 |
| D | 7 | 96 | 621269 | 2574.01 | 838 | 800 | 241.1 |
| D | 3 | 12 | 337354 | 1396.19 | 838 | 800 | 241.1 |
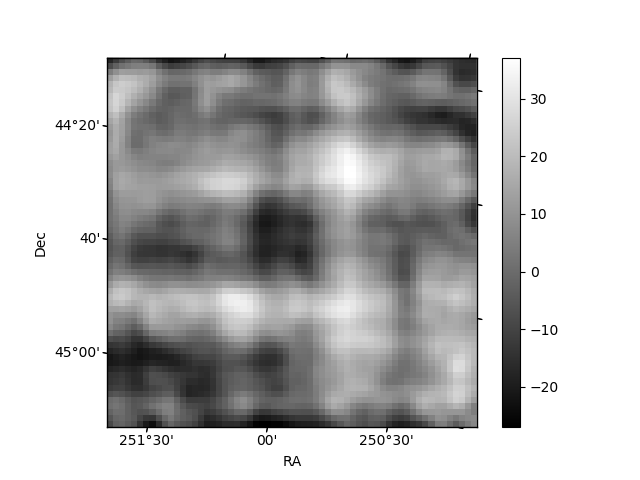
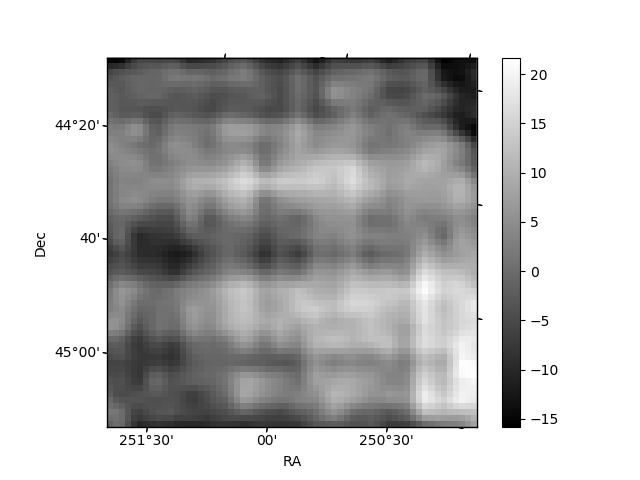
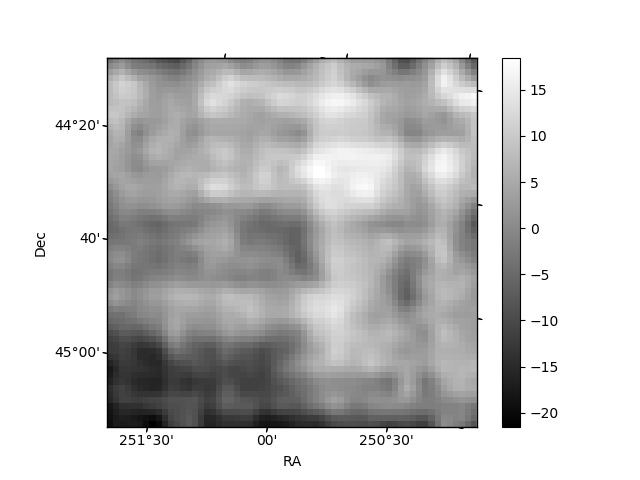
Histogram calculated using DETX and DETY for each event in the final _common_clean file
| Quadrant A | 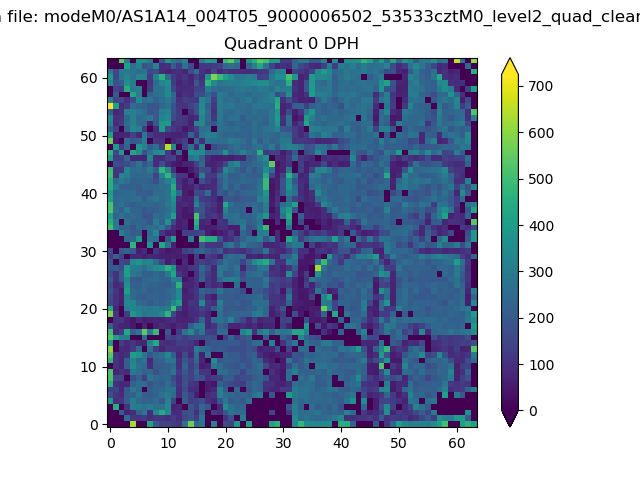 |
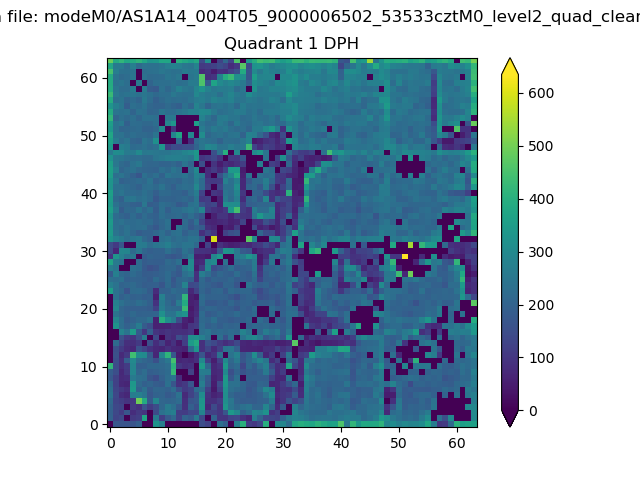 |
Quadrant B |
|---|---|---|---|
| Quadrant D | 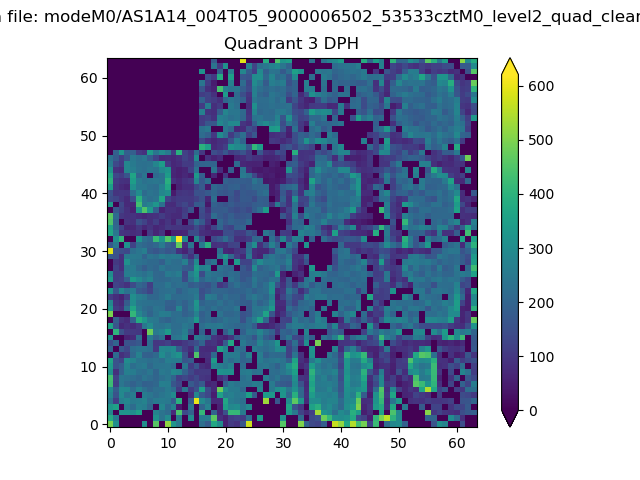 |
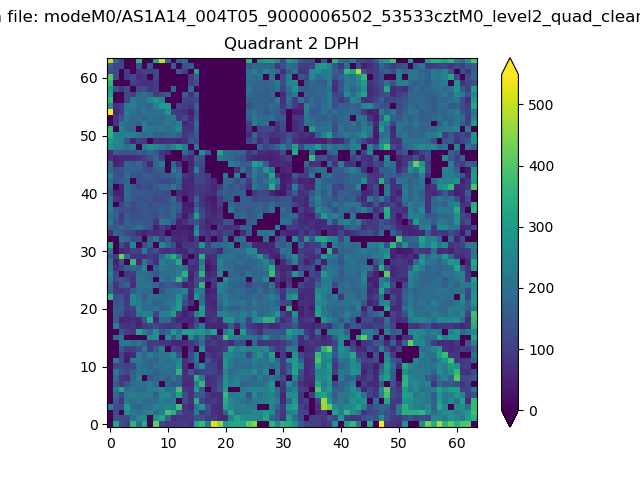 |
Quadrant C |
| Plot type | Count rate plots | Images |
|---|---|---|
| Comparison with Poisson distribution Blue bars denote a histogram of data divided into 1 sec bins. Red curve is a Poisson curve with rate = median count rate of data. |
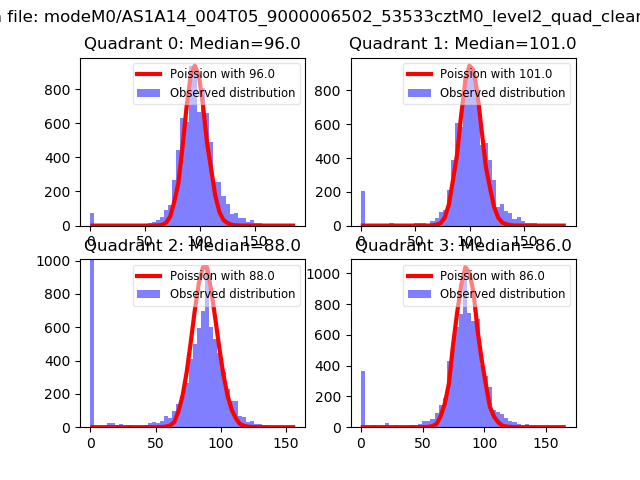 |
 |
| Quadrant-wise count rates Data is divided into 100 sec bins |
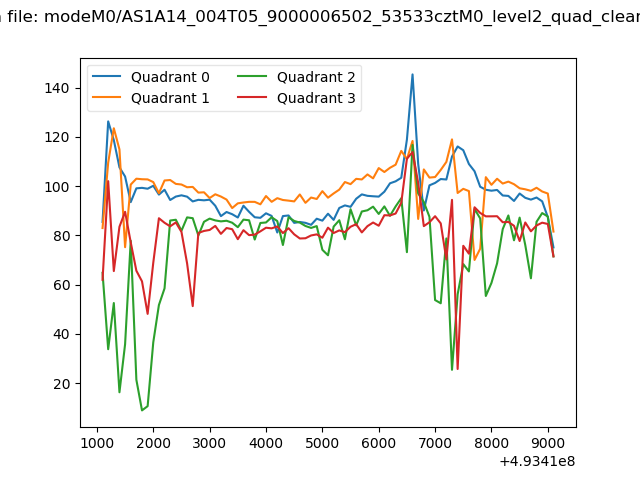 |
|
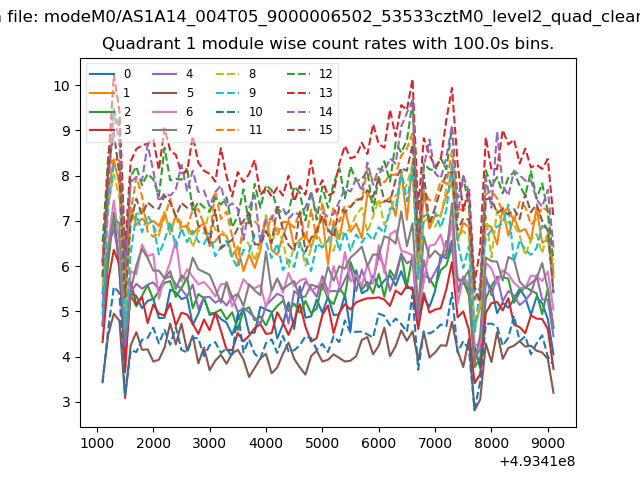
| Module-wise count rates for Quadrant A Data is divided into 100 sec bins |
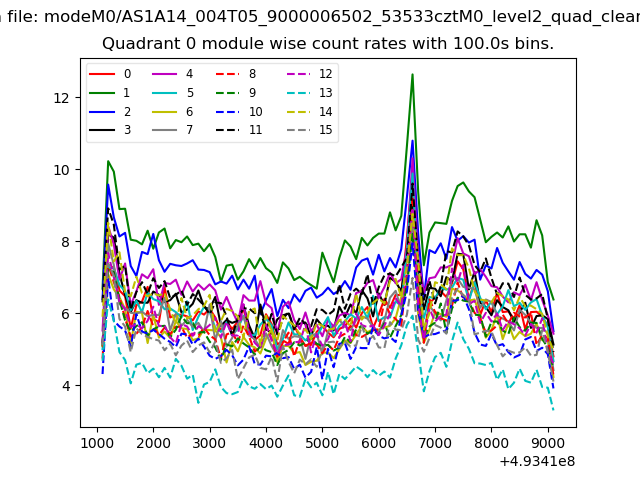 |
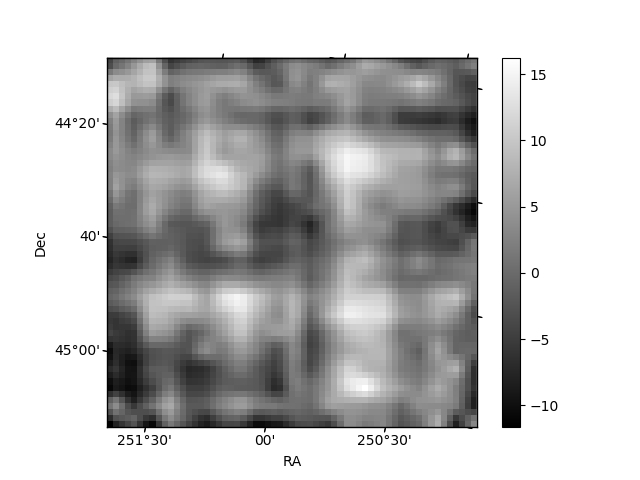 |
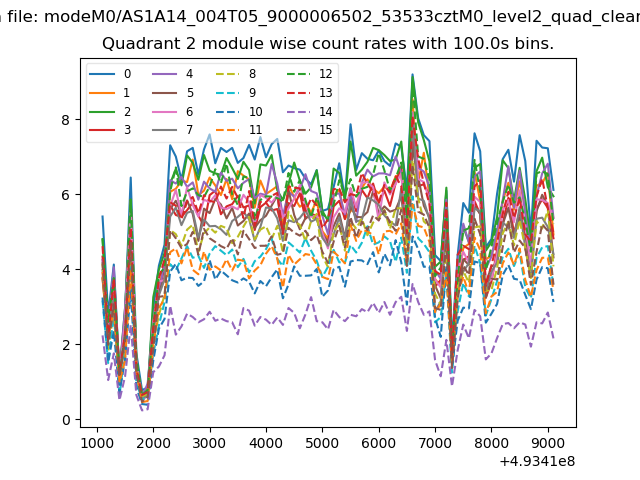
| Module-wise count rates for Quadrant B Data is divided into 100 sec bins |
 |
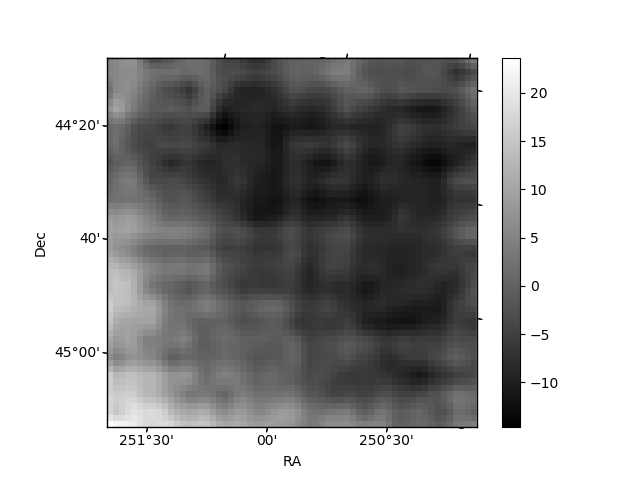 |
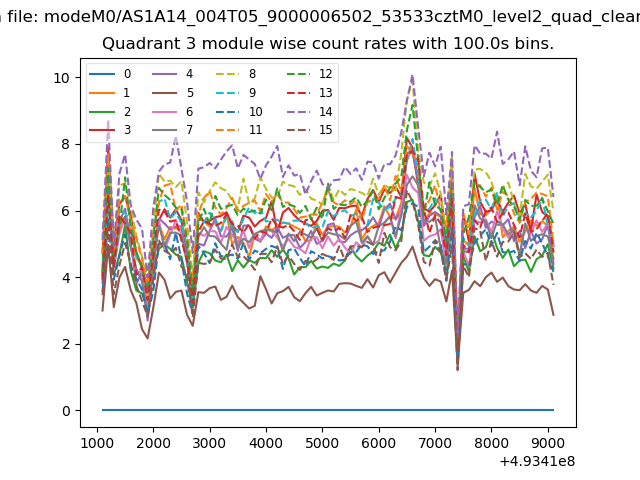
| Module-wise count rates for Quadrant C Data is divided into 100 sec bins |
 |
 |
| Module-wise count rates for Quadrant D Data is divided into 100 sec bins |
 |
 |
| Parameter | Plot |
|---|---|
| CZT HV Monitor | 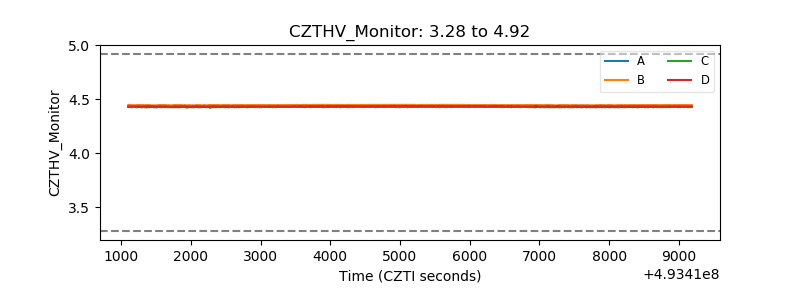 |
| D_VDD | 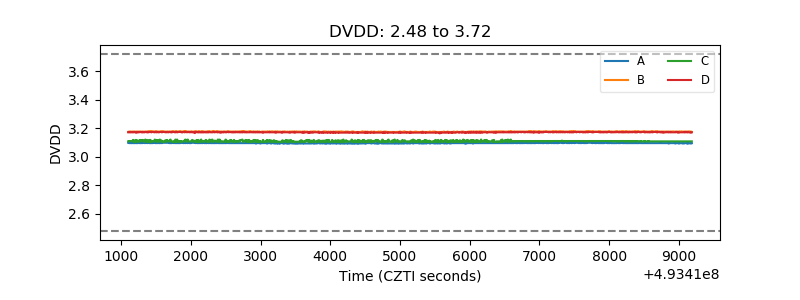 |
| Temperature 1 | 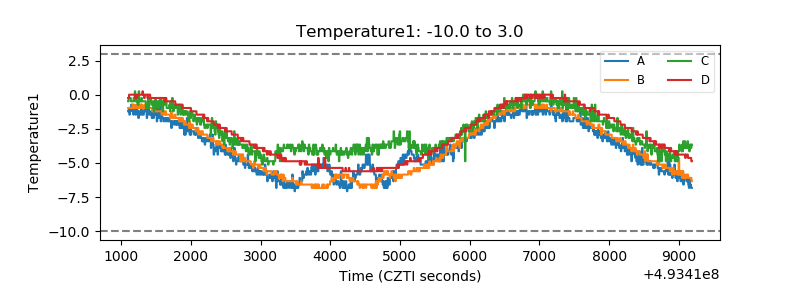 |
| Veto HV Monitor | 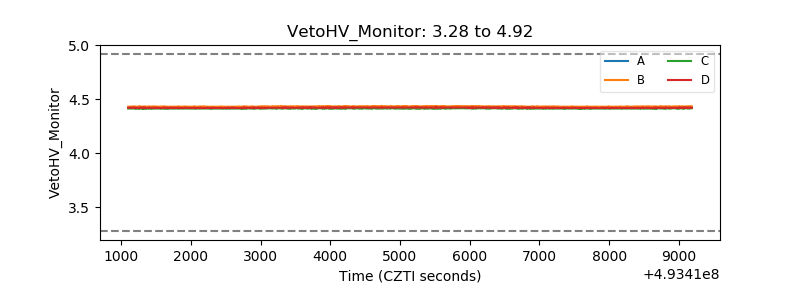 |
| Veto LLD | 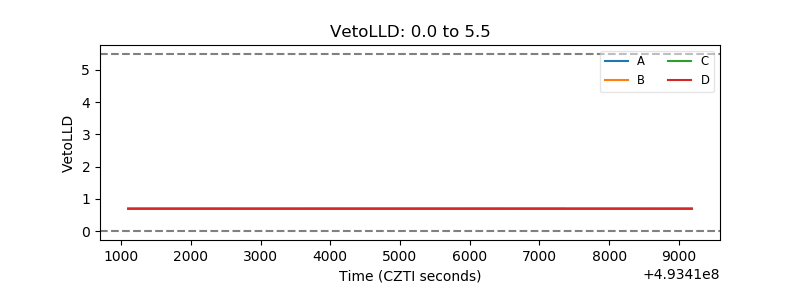 |
| Alpha Counter | 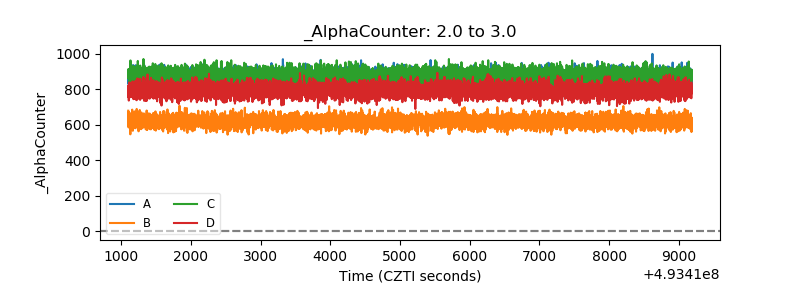 |
| _CPM_Rate | 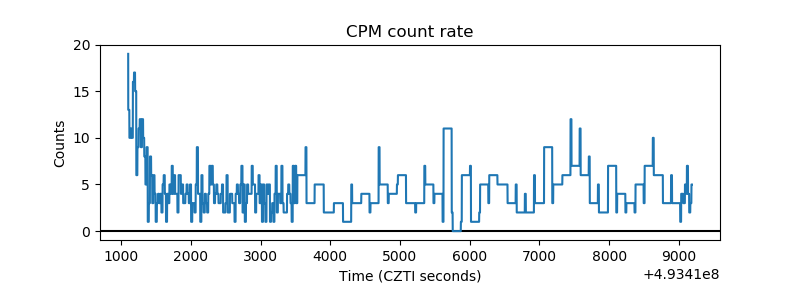 |
| CZT Counter | 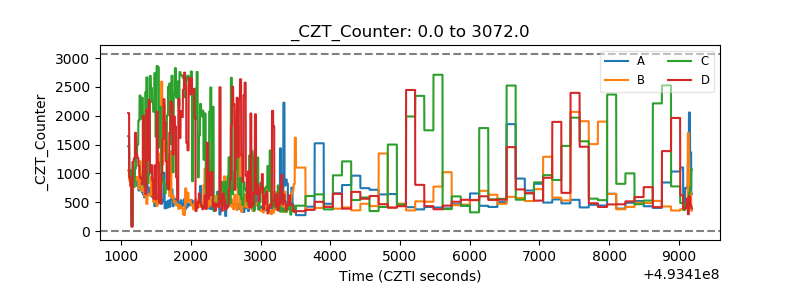 |
| +2.5 Volts monitor | 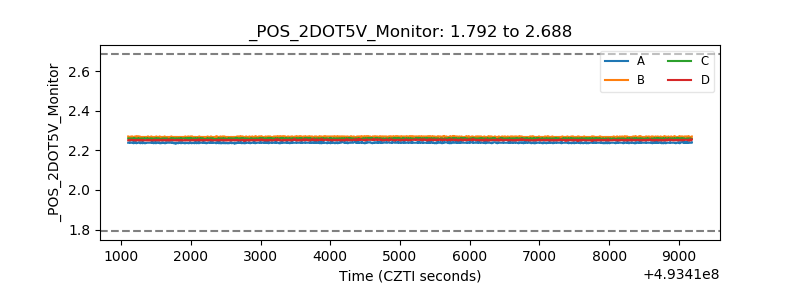 |
| +5 Volts monitor | 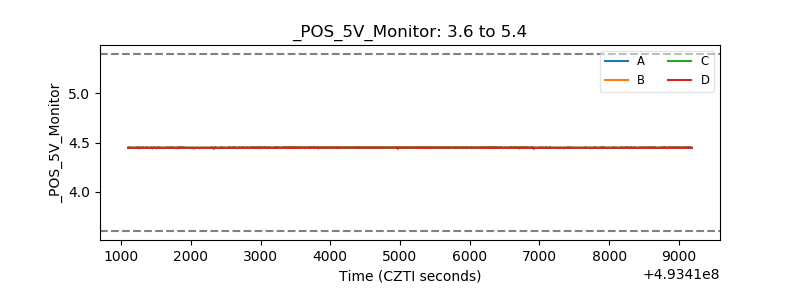 |
| _ROLL_ROT | 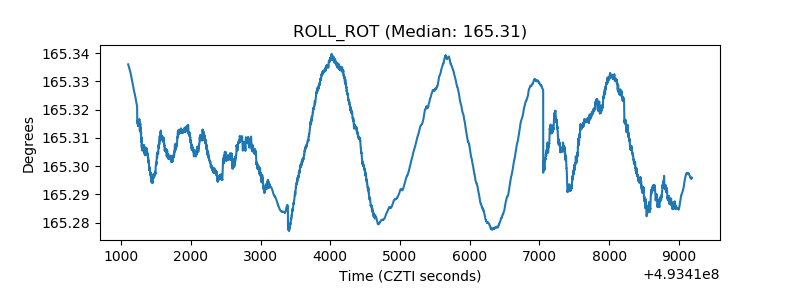 |
| _Roll_DEC | 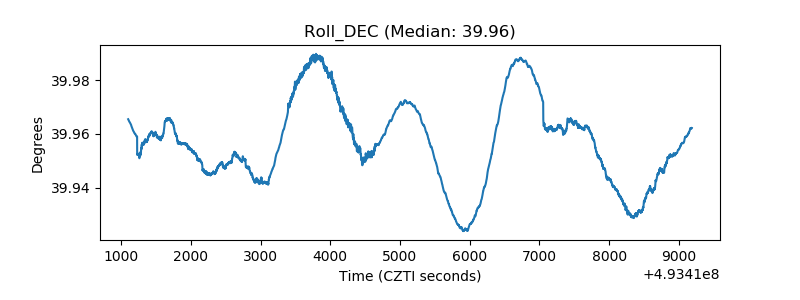 |
| _Roll_RA | 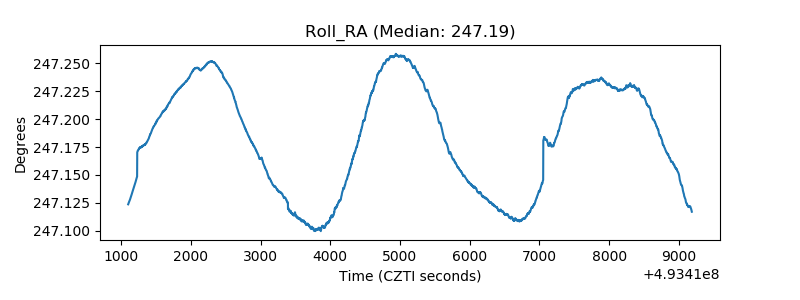 |
| Veto Counter | 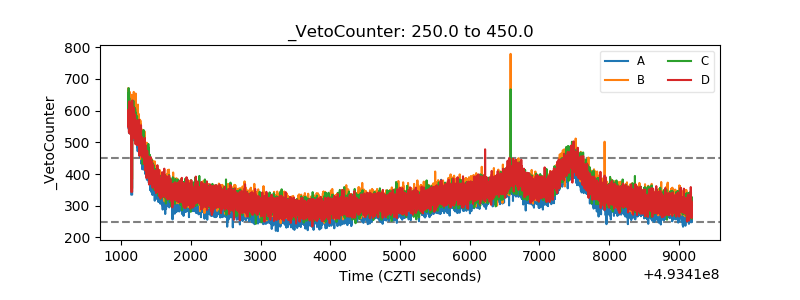 |