| Param | Original file | Final file |
|---|---|---|
| Filename | modeM0/AS1A14_004T05_9000006502_53534cztM0_level2.fits | modeM0/AS1A14_004T05_9000006502_53534cztM0_level2_quad_clean.evt |
| Size (bytes) | 744,456,960 | 111,067,200 |
| Size | 710.0 MB | 105.9 MB |
| Events in quadrant A | 5,866,128 | 746,429 |
| Events in quadrant B | 5,279,403 | 809,639 |
| Events in quadrant C | 10,594,561 | 550,211 |
| Events in quadrant D | 5,188,897 | 692,450 |
| Mode SS | |||
|---|---|---|---|
| Quadrant | BADHDUFLAG | Total packets | Discarded packets |
| A | 0 | 162 | 0 |
| B | 0 | 162 | 0 |
| C | 0 | 162 | 0 |
| D | 0 | 162 | 0 |
| Mode M0 | |||
|---|---|---|---|
| Quadrant | BADHDUFLAG | Total packets | Discarded packets |
| A | 0 | 23009 | 0 |
| B | 0 | 21462 | 0 |
| C | 0 | 37155 | 7 |
| D | 0 | 21042 | 0 |
| Quadrant | Total seconds | Saturated seconds | Saturation percentage |
|---|---|---|---|
| A | 8112 | 464 | 5.719921% |
| B | 8112 | 312 | 3.846154% |
| C | 8112 | 2374 | 29.265286% |
| D | 8112 | 275 | 3.390039% |
Noise dominated data is calculated using 1-second bins in cleaned event files. If a bin has >2000 counts, and if more than 50% of those come from <1% of pixels, then it is considered to be noise-dominated and hence unusable.
| Quadrant | # 1 sec bins | Bins with >0 counts | Bins with >2000 counts | High rate bins dominated by noise | Noise dominated (total time) | Noise dominated (detector-on time) | Marked lightcurve |
|---|---|---|---|---|---|---|---|
| A | 8112 | 8112 | 409 | 409 | 5.04% | 5.04% | 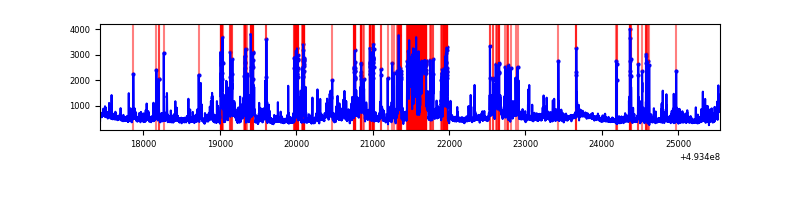 |
| B | 8112 | 8112 | 170 | 170 | 2.10% | 2.10% | 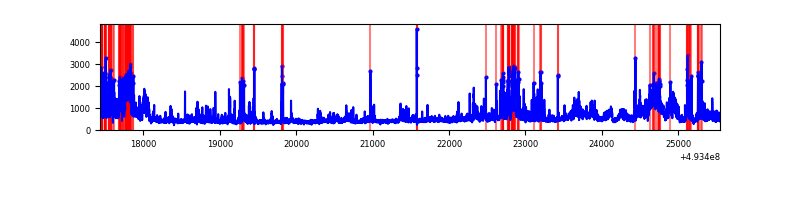 |
| C | 8111 | 8111 | 2043 | 2043 | 25.19% | 25.19% | 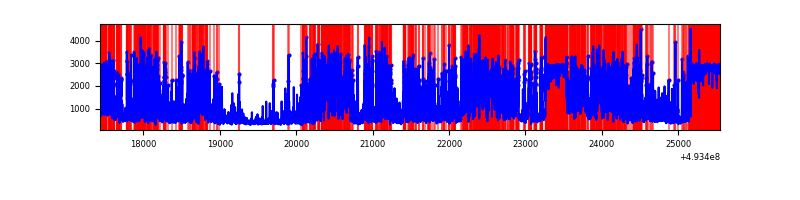 |
| D | 8112 | 8112 | 239 | 239 | 2.95% | 2.95% | 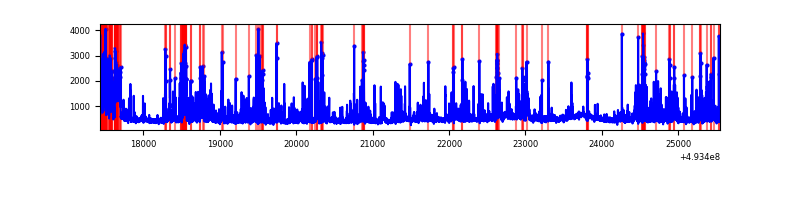 |
Top three noisy pixels from each quadrant. If the there are fewer than three noisy pixels in the level2.evt file, extra rows are filled as -1
| Pixel properties | Quadrant properties | ||||||
|---|---|---|---|---|---|---|---|
| Quadrant | DetID | PixID | Counts | Sigma | Mean | Median | Sigma |
| A | 15 | 174 | 1194881 | 5581.3 | 859 | 837 | 213.9 |
| A | 3 | 63 | 555004 | 2590.33 | 859 | 837 | 213.9 |
| A | 12 | 80 | 244088 | 1137.02 | 859 | 837 | 213.9 |
| B | 10 | 254 | 498408 | 2688.04 | 862 | 831 | 185.1 |
| B | 10 | 28 | 431547 | 2326.84 | 862 | 831 | 185.1 |
| B | 4 | 81 | 431418 | 2326.14 | 862 | 831 | 185.1 |
| C | 15 | 224 | 4411881 | 21641.33 | 734 | 727 | 203.8 |
| C | 1 | 241 | 2029120 | 9951.39 | 734 | 727 | 203.8 |
| C | 1 | 3 | 382587 | 1873.42 | 734 | 727 | 203.8 |
| D | 7 | 96 | 479589 | 2000.87 | 844 | 806 | 239.3 |
| D | 7 | 70 | 420741 | 1754.94 | 844 | 806 | 239.3 |
| D | 2 | 153 | 247023 | 1028.96 | 844 | 806 | 239.3 |
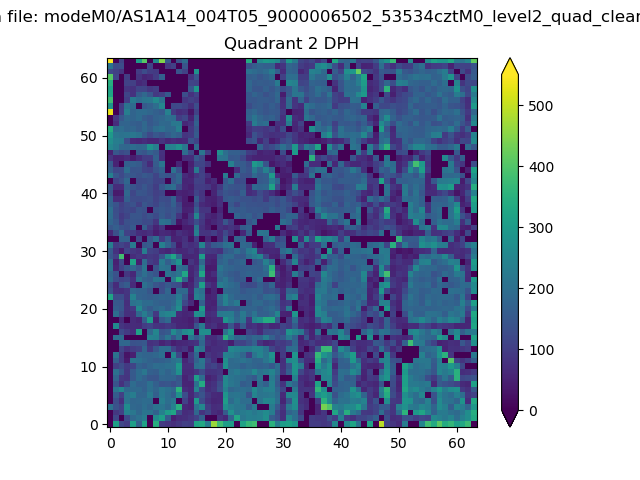
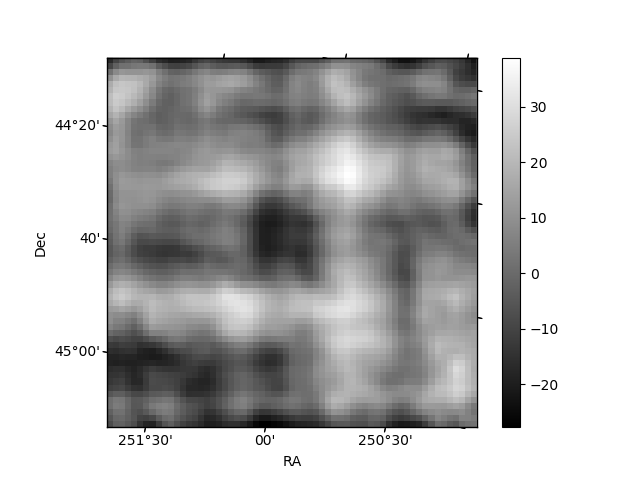
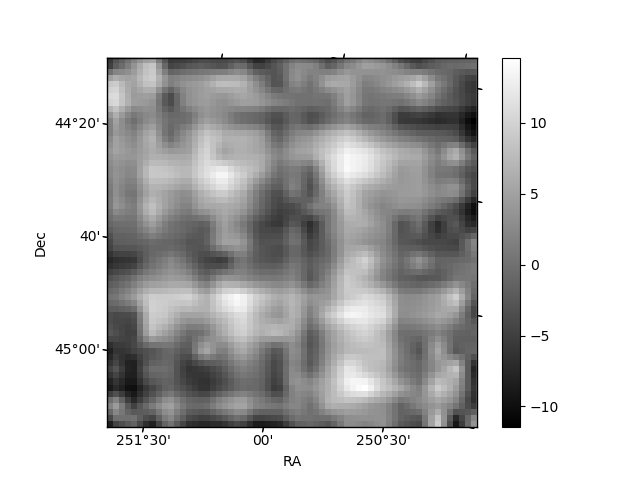
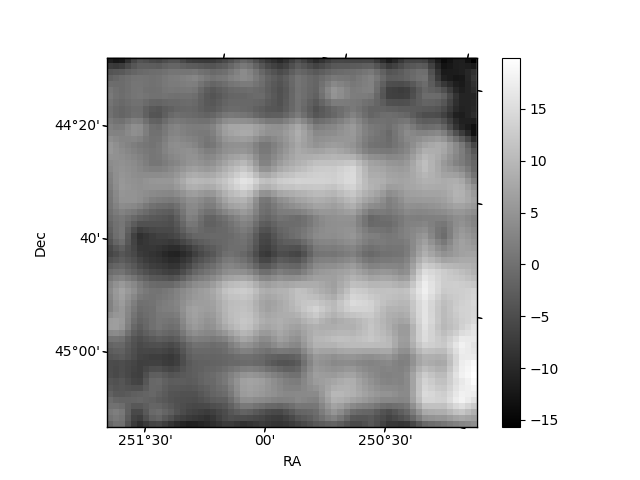
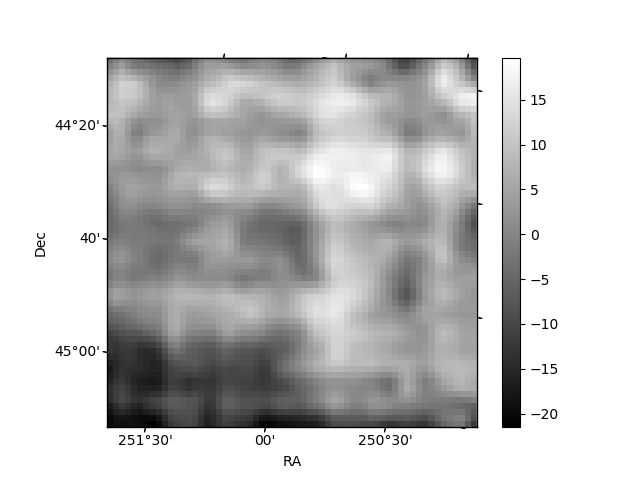
Histogram calculated using DETX and DETY for each event in the final _common_clean file
| Quadrant A | 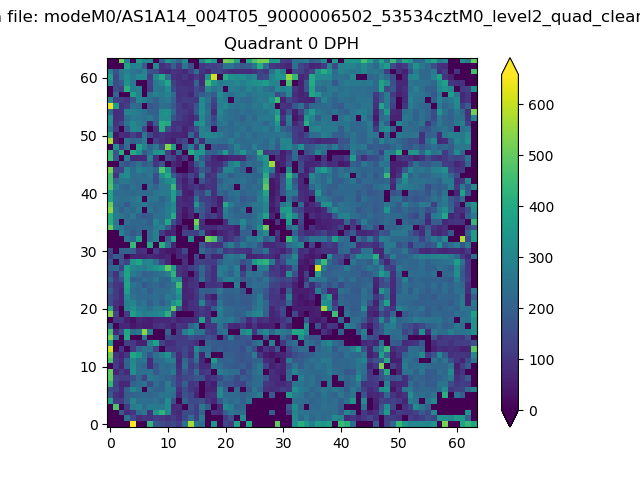 |
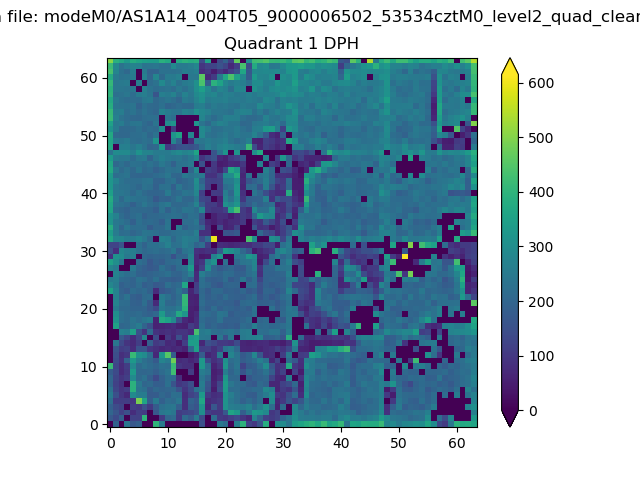 |
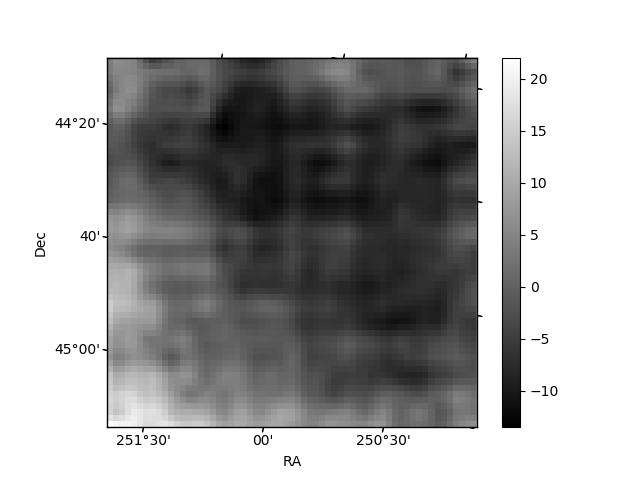
Quadrant B |
|---|---|---|---|
| Quadrant D | 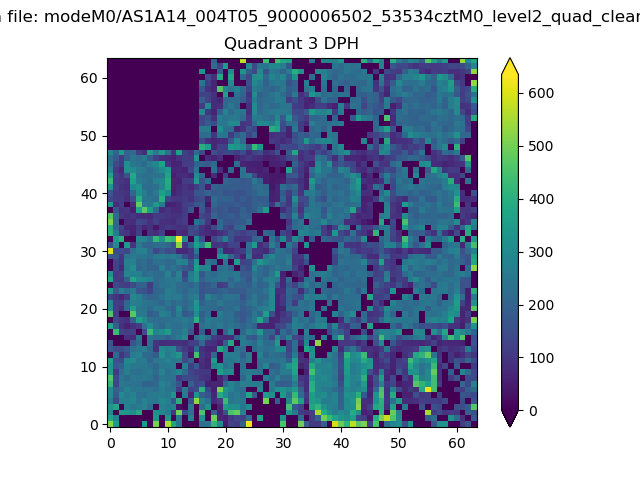 |
 |
Quadrant C |
| Plot type | Count rate plots | Images |
|---|---|---|
| Comparison with Poisson distribution Blue bars denote a histogram of data divided into 1 sec bins. Red curve is a Poisson curve with rate = median count rate of data. |
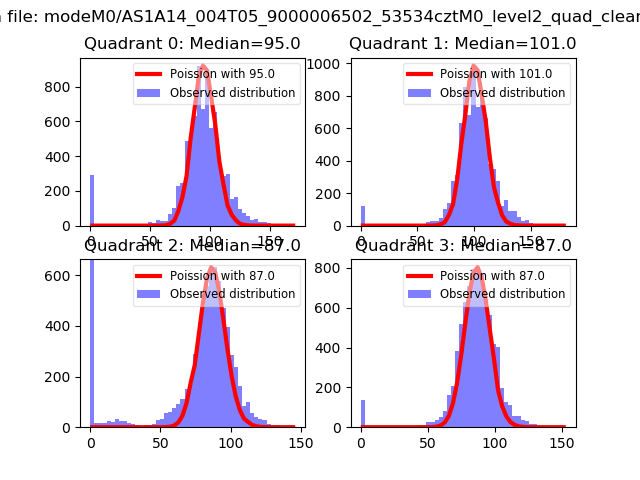 |
 |
| Quadrant-wise count rates Data is divided into 100 sec bins |
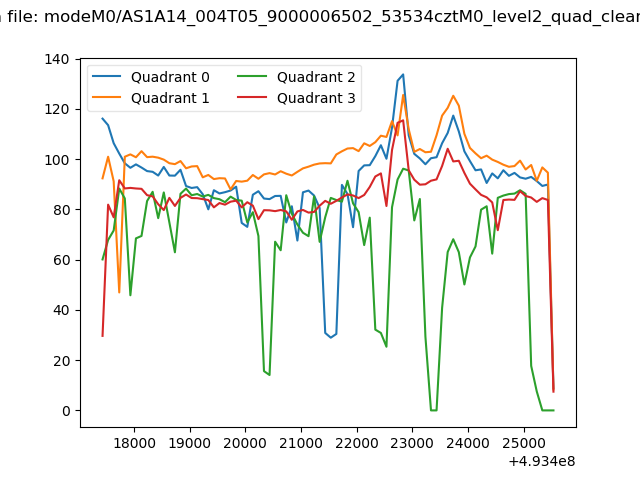 |
|
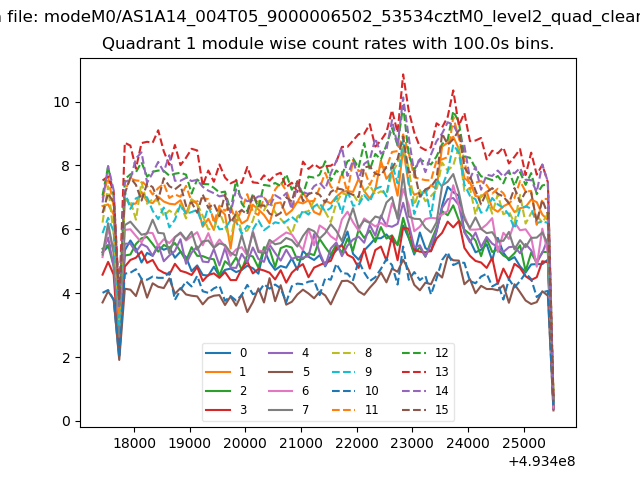
| Module-wise count rates for Quadrant A Data is divided into 100 sec bins |
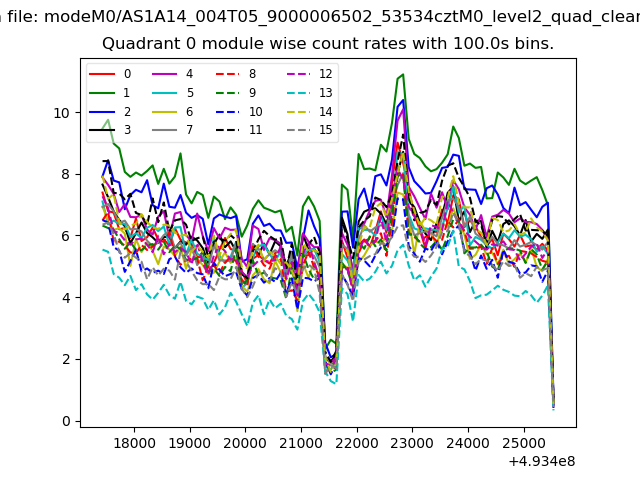 |
 |
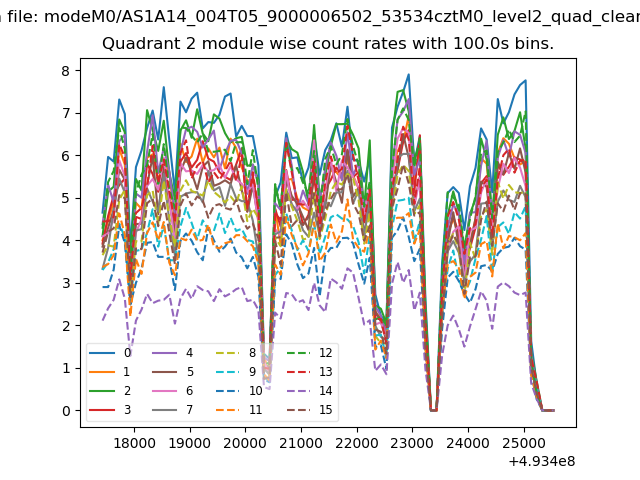
| Module-wise count rates for Quadrant B Data is divided into 100 sec bins |
 |
 |
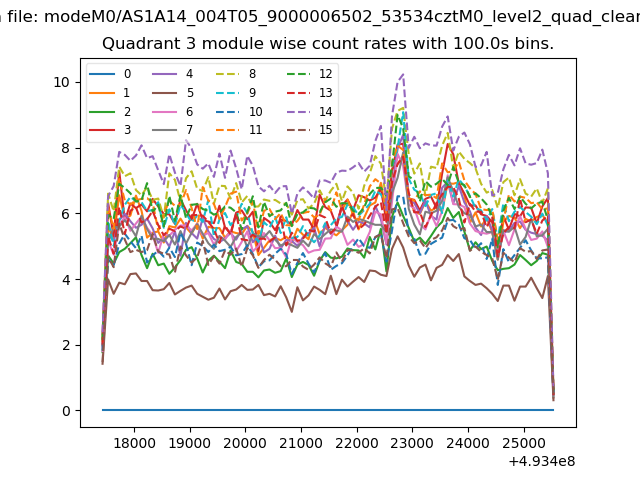
| Module-wise count rates for Quadrant C Data is divided into 100 sec bins |
 |
 |
| Module-wise count rates for Quadrant D Data is divided into 100 sec bins |
 |
 |
| Parameter | Plot |
|---|---|
| CZT HV Monitor |  |
| D_VDD | 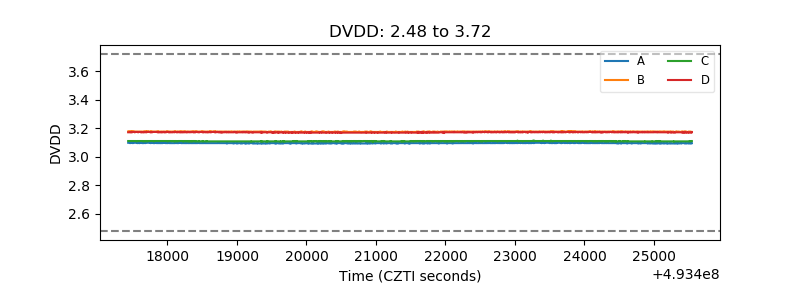 |
| Temperature 1 | 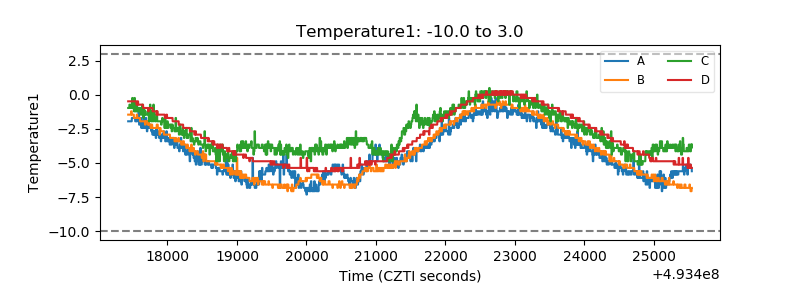 |
| Veto HV Monitor | 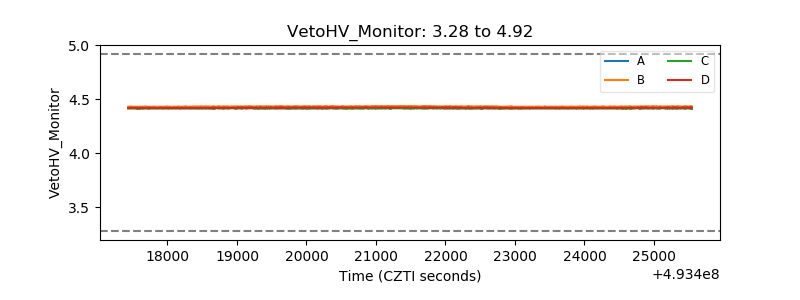 |
| Veto LLD | 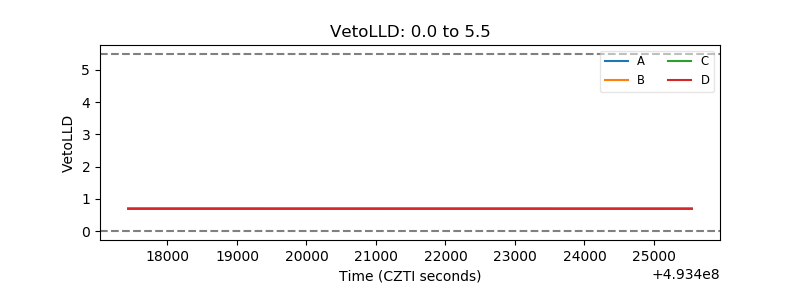 |
| Alpha Counter | 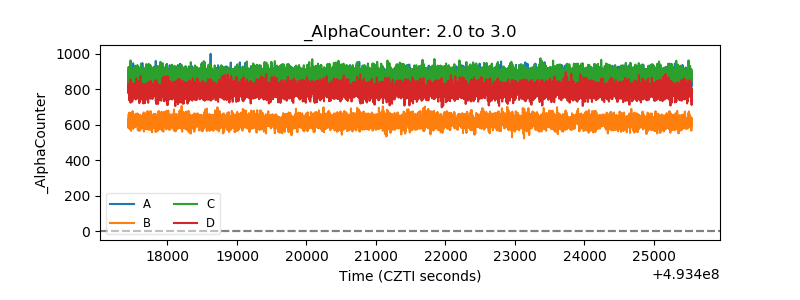 |
| _CPM_Rate | 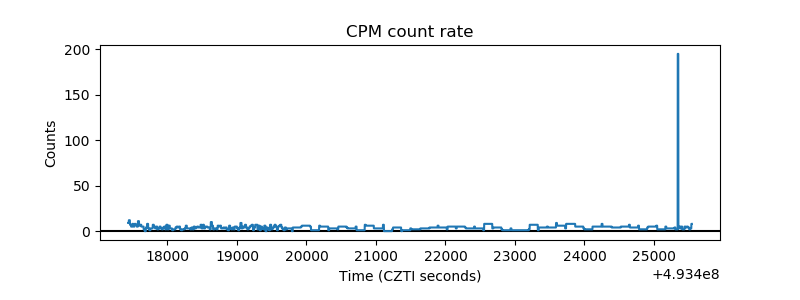 |
| CZT Counter | 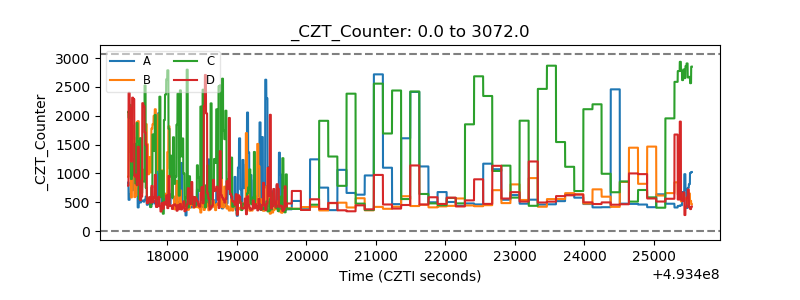 |
| +2.5 Volts monitor | 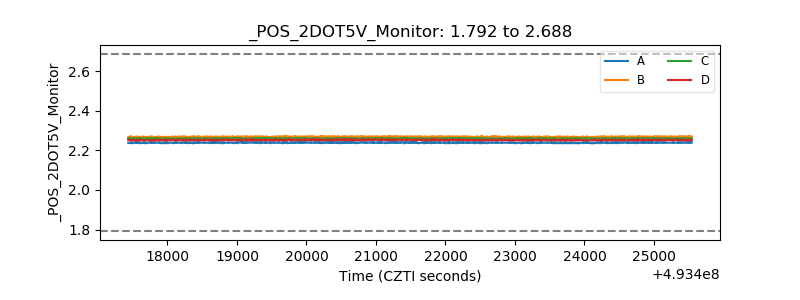 |
| +5 Volts monitor |  |
| _ROLL_ROT | 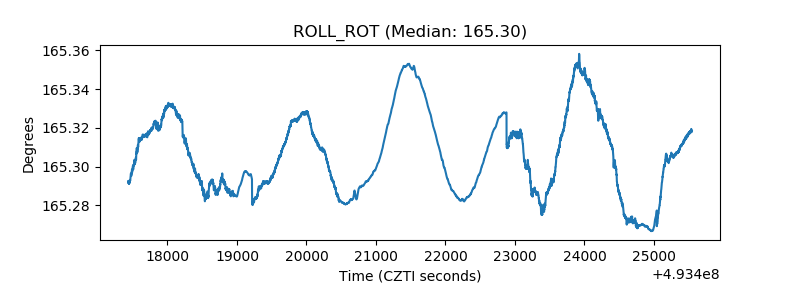 |
| _Roll_DEC | 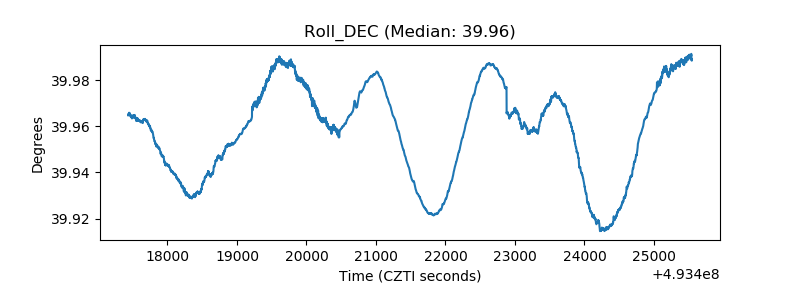 |
| _Roll_RA | 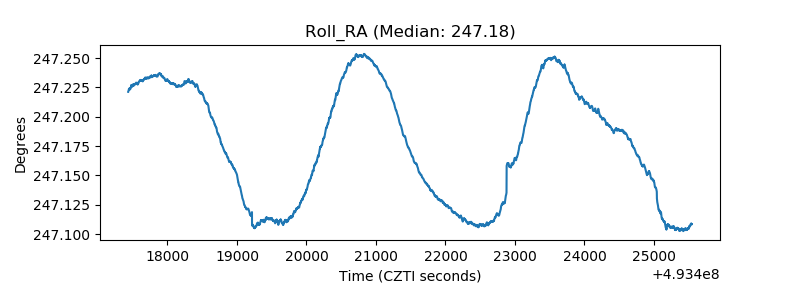 |
| Veto Counter | 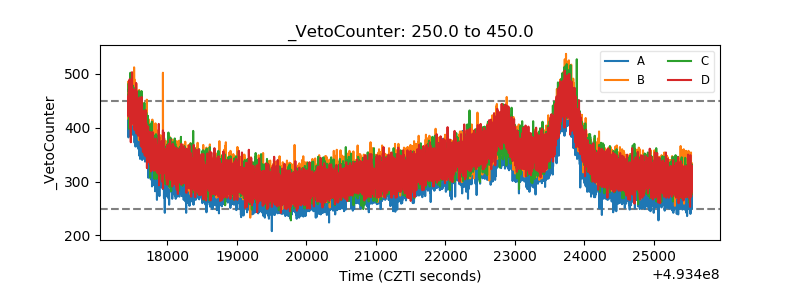 |