| Param | Original file | Final file |
|---|---|---|
| Filename | modeM0/AS1A14_004T05_9000006502_53538cztM0_level2.fits | modeM0/AS1A14_004T05_9000006502_53538cztM0_level2_quad_clean.evt |
| Size (bytes) | 782,686,080 | 86,388,480 |
| Size | 746.4 MB | 82.4 MB |
| Events in quadrant A | 10,925,793 | 418,698 |
| Events in quadrant B | 3,504,099 | 691,527 |
| Events in quadrant C | 9,859,254 | 445,805 |
| Events in quadrant D | 4,156,324 | 584,645 |
| Mode M9 | |||
|---|---|---|---|
| Quadrant | BADHDUFLAG | Total packets | Discarded packets |
| A | 0 | 15 | 0 |
| B | 0 | 15 | 0 |
| C | 0 | 15 | 0 |
| D | 0 | 15 | 0 |
| Mode SS | |||
|---|---|---|---|
| Quadrant | BADHDUFLAG | Total packets | Discarded packets |
| A | 0 | 142 | 0 |
| B | 0 | 142 | 0 |
| C | 0 | 142 | 0 |
| D | 0 | 142 | 0 |
| Mode M0 | |||
|---|---|---|---|
| Quadrant | BADHDUFLAG | Total packets | Discarded packets |
| A | 0 | 37212 | 2 |
| B | 0 | 15138 | 2 |
| C | 0 | 33984 | 4 |
| D | 0 | 17230 | 2 |
| Quadrant | Total seconds | Saturated seconds | Saturation percentage |
|---|---|---|---|
| A | 6804 | 2891 | 42.489712% |
| B | 6805 | 182 | 2.674504% |
| C | 6804 | 2231 | 32.789536% |
| D | 6804 | 247 | 3.630218% |
Noise dominated data is calculated using 1-second bins in cleaned event files. If a bin has >2000 counts, and if more than 50% of those come from <1% of pixels, then it is considered to be noise-dominated and hence unusable.
| Quadrant | # 1 sec bins | Bins with >0 counts | Bins with >2000 counts | High rate bins dominated by noise | Noise dominated (total time) | Noise dominated (detector-on time) | Marked lightcurve |
|---|---|---|---|---|---|---|---|
| A | 8379 | 6804 | 2333 | 2333 | 27.84% | 34.29% | 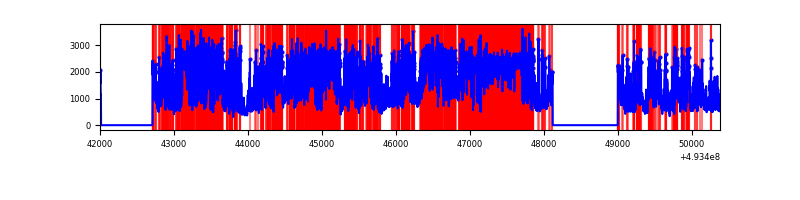 |
| B | 8380 | 6805 | 69 | 69 | 0.82% | 1.01% | 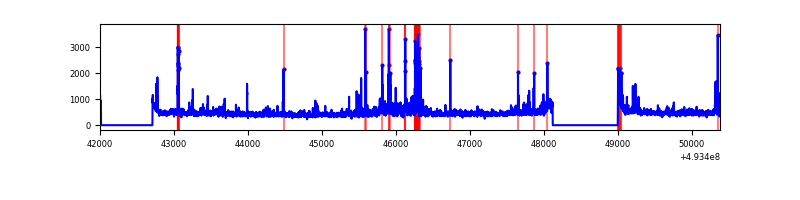 |
| C | 8379 | 6804 | 2127 | 2127 | 25.38% | 31.26% | 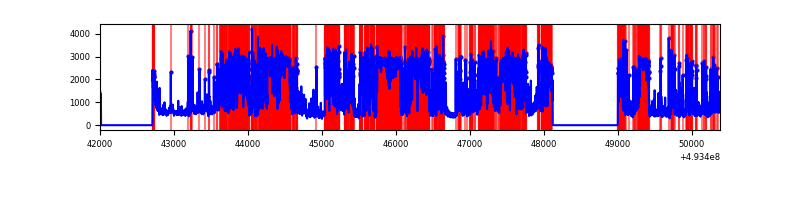 |
| D | 8379 | 6806 | 173 | 173 | 2.06% | 2.54% | 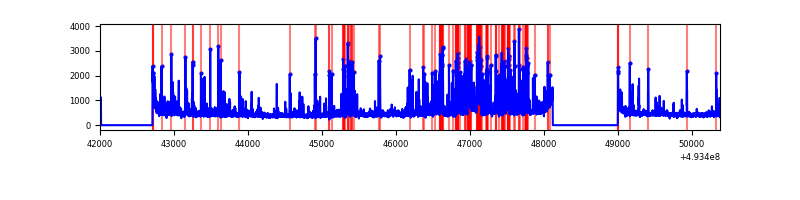 |
Top three noisy pixels from each quadrant. If the there are fewer than three noisy pixels in the level2.evt file, extra rows are filled as -1
| Pixel properties | Quadrant properties | ||||||
|---|---|---|---|---|---|---|---|
| Quadrant | DetID | PixID | Counts | Sigma | Mean | Median | Sigma |
| A | 3 | 63 | 7775877 | 51573.11 | 603 | 588 | 150.8 |
| A | 15 | 174 | 416689 | 2759.98 | 603 | 588 | 150.8 |
| A | 3 | 62 | 203994 | 1349.18 | 603 | 588 | 150.8 |
| B | 5 | 185 | 185513 | 1165.12 | 738 | 711 | 158.6 |
| B | 0 | 213 | 141668 | 888.69 | 738 | 711 | 158.6 |
| B | 1 | 255 | 86190 | 538.92 | 738 | 711 | 158.6 |
| C | 1 | 241 | 5301935 | 31346.62 | 607 | 603 | 169.1 |
| C | 15 | 224 | 1552703 | 9177.52 | 607 | 603 | 169.1 |
| C | 3 | 242 | 264041 | 1557.7 | 607 | 603 | 169.1 |
| D | 7 | 96 | 292854 | 1427.98 | 721 | 689 | 204.6 |
| D | 2 | 249 | 225825 | 1100.37 | 721 | 689 | 204.6 |
| D | 7 | 70 | 170080 | 827.91 | 721 | 689 | 204.6 |
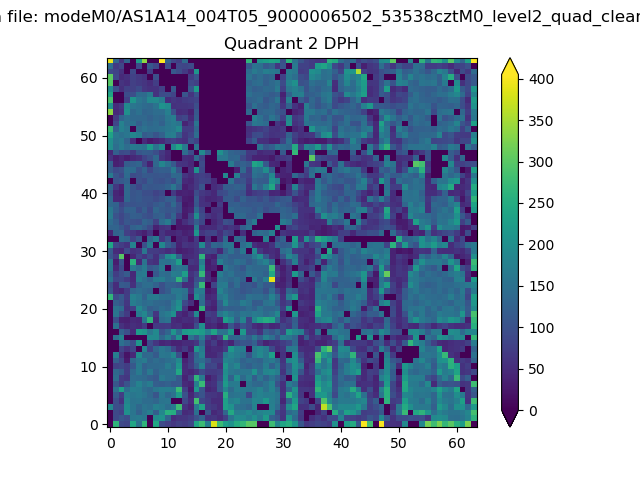
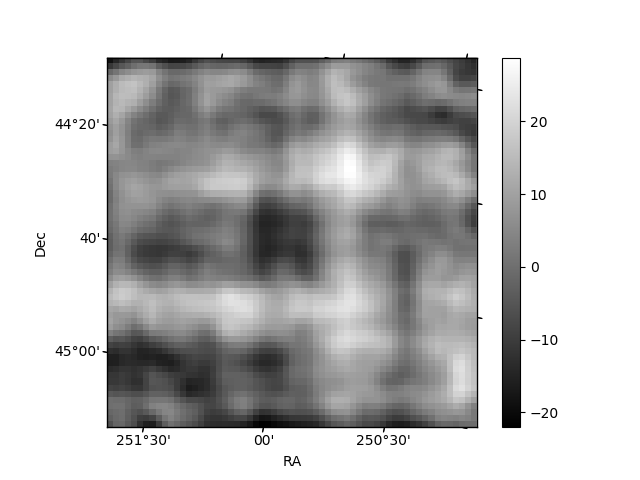
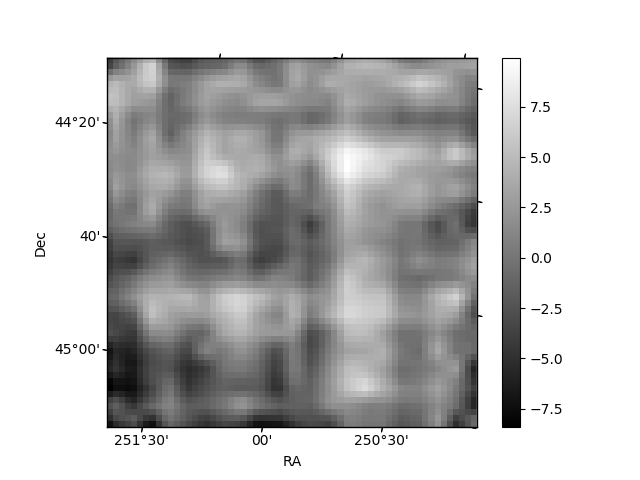
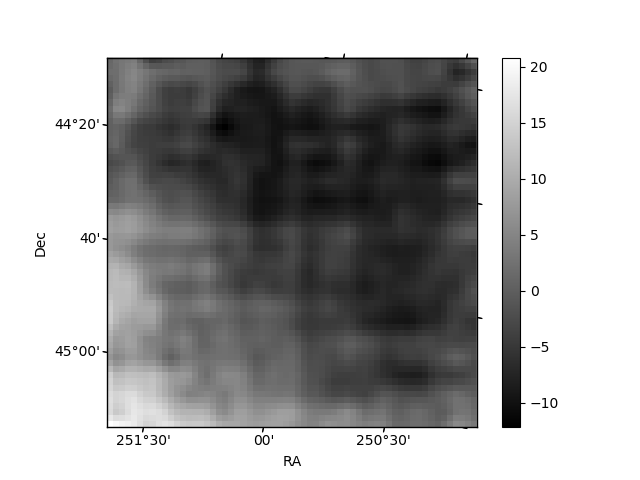
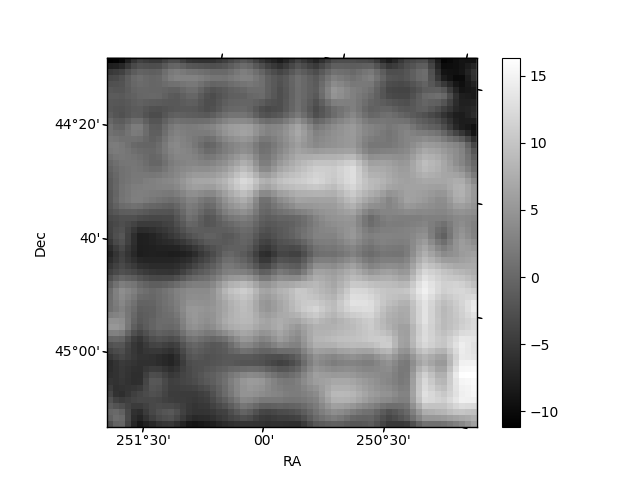
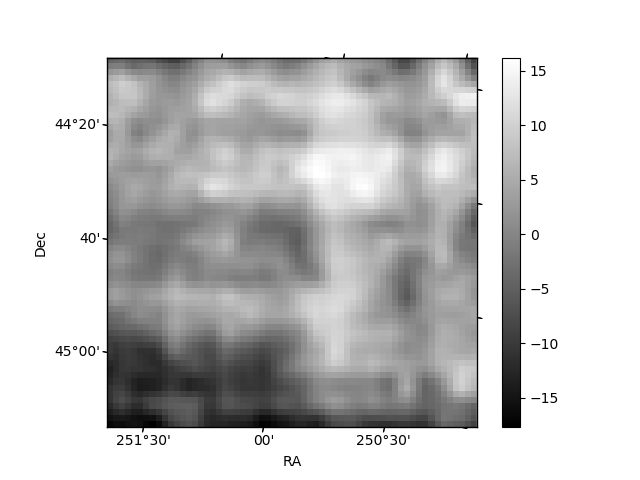
Histogram calculated using DETX and DETY for each event in the final _common_clean file
| Quadrant A | 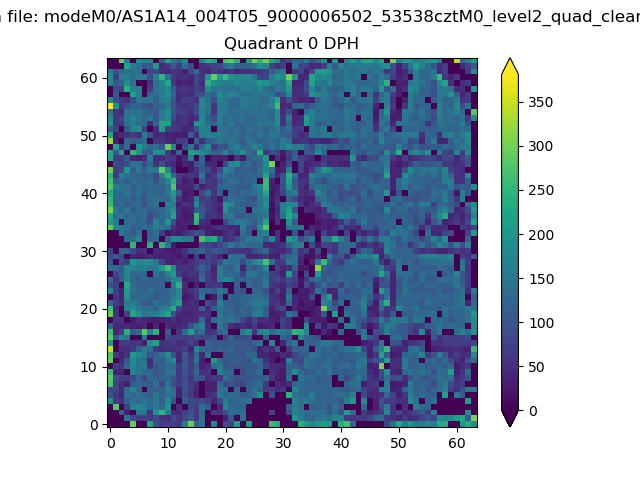 |
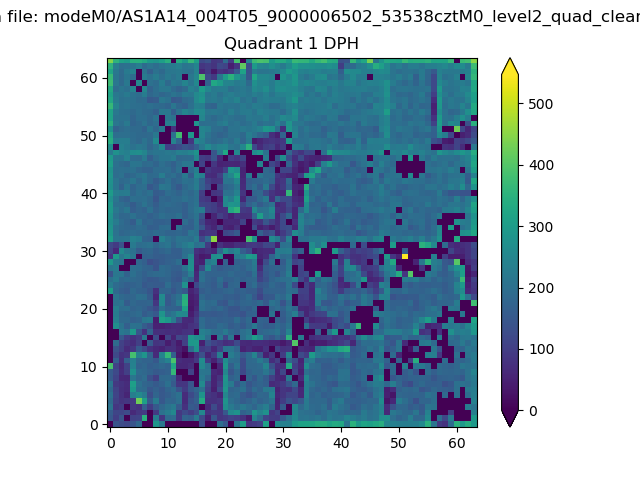 |
Quadrant B |
|---|---|---|---|
| Quadrant D | 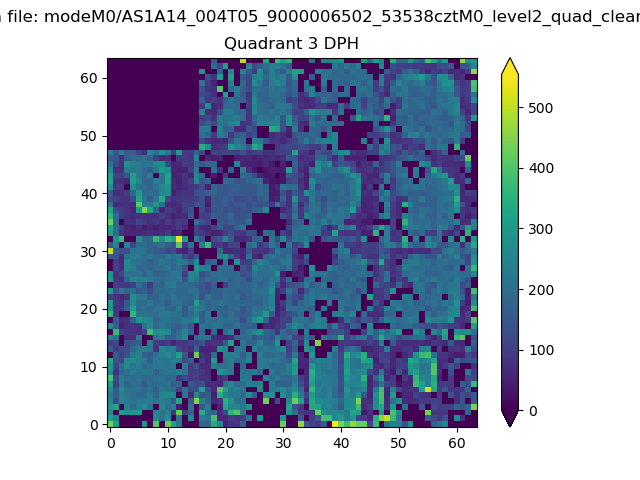 |
 |
Quadrant C |
| Plot type | Count rate plots | Images |
|---|---|---|
| Comparison with Poisson distribution Blue bars denote a histogram of data divided into 1 sec bins. Red curve is a Poisson curve with rate = median count rate of data. |
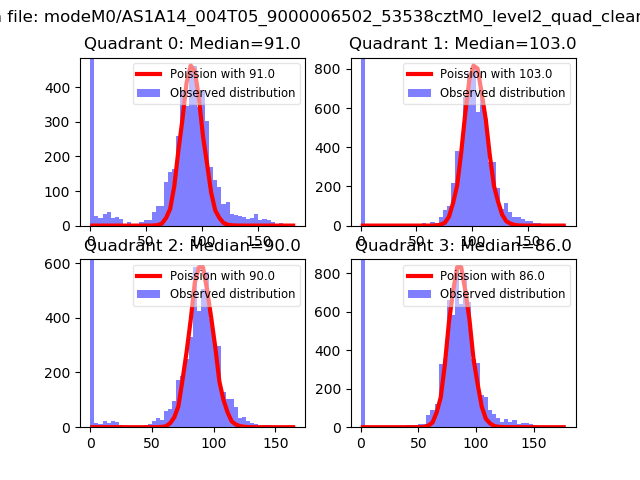 |
 |
| Quadrant-wise count rates Data is divided into 100 sec bins |
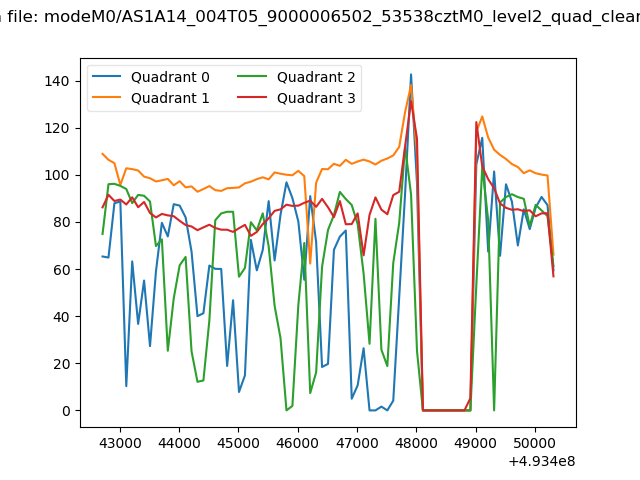 |
|
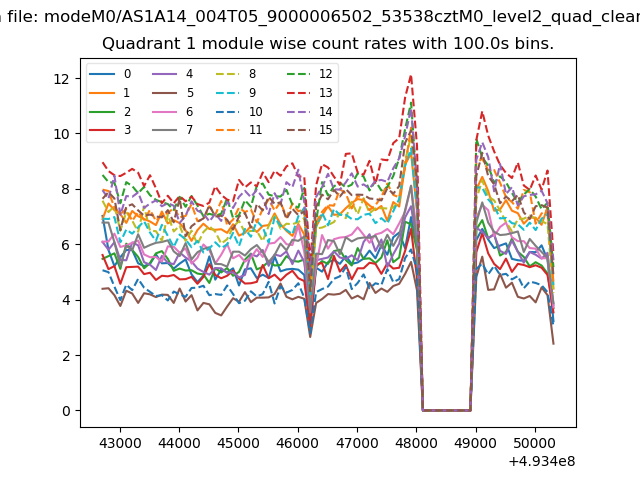
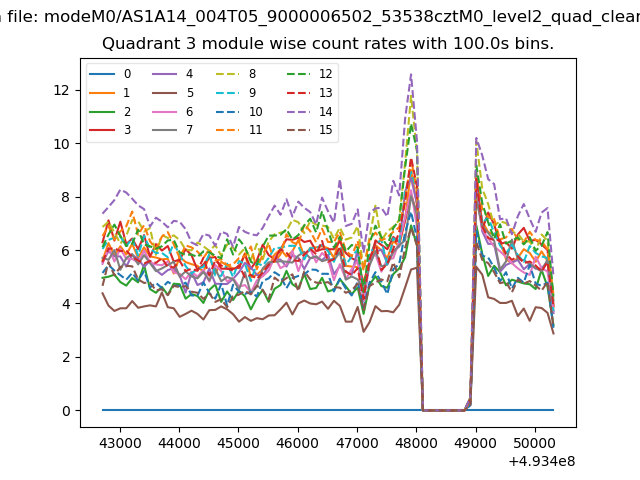
| Module-wise count rates for Quadrant A Data is divided into 100 sec bins |
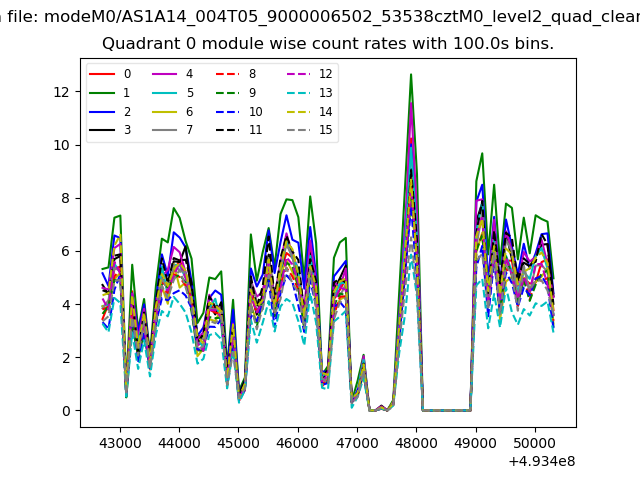 |
 |
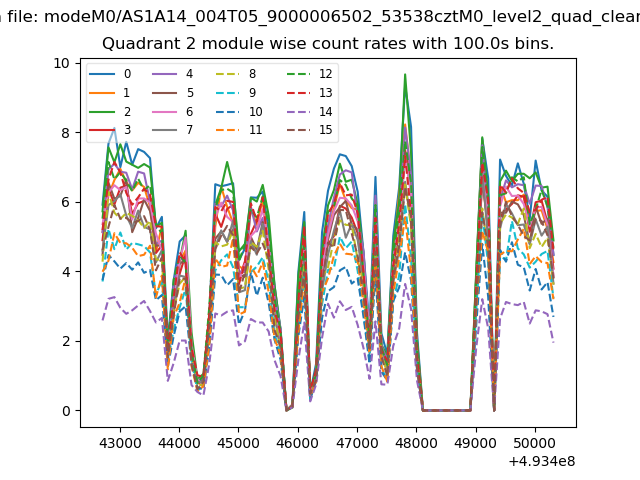
| Module-wise count rates for Quadrant B Data is divided into 100 sec bins |
 |
 |
| Module-wise count rates for Quadrant C Data is divided into 100 sec bins |
 |
 |
| Module-wise count rates for Quadrant D Data is divided into 100 sec bins |
 |
 |
| Parameter | Plot |
|---|---|
| CZT HV Monitor | 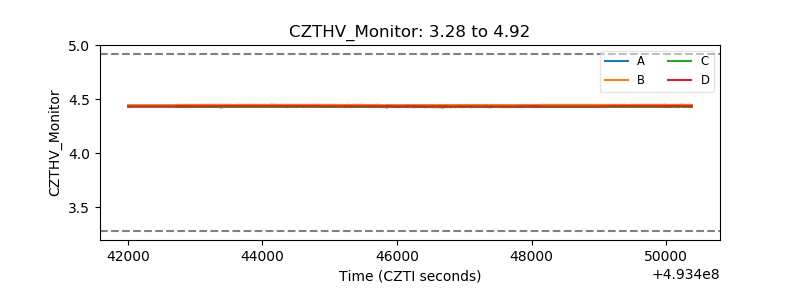 |
| D_VDD | 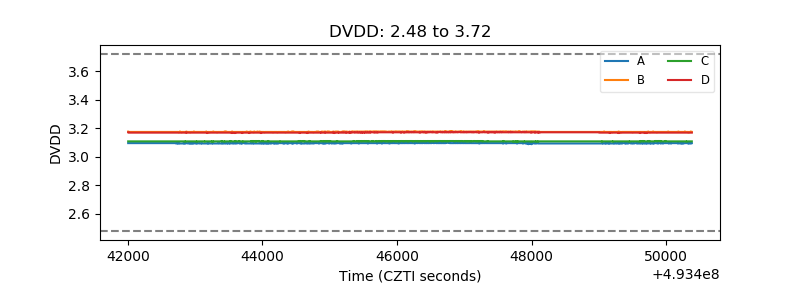 |
| Temperature 1 | 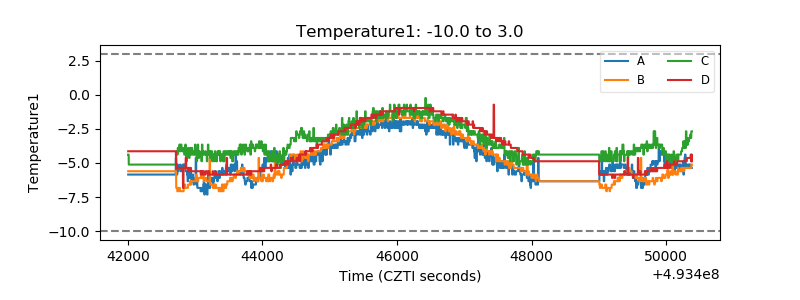 |
| Veto HV Monitor | 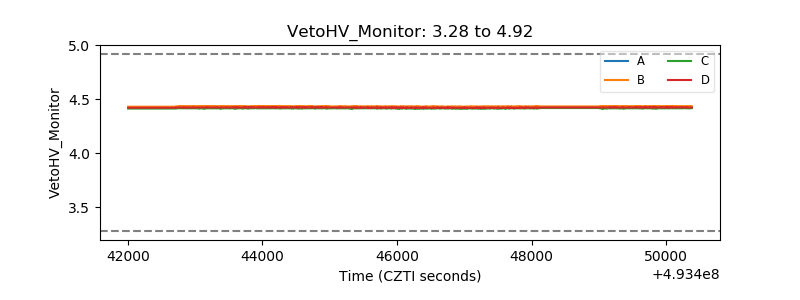 |
| Veto LLD | 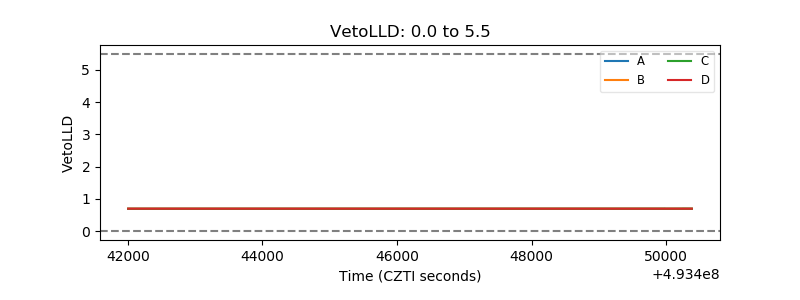 |
| Alpha Counter | 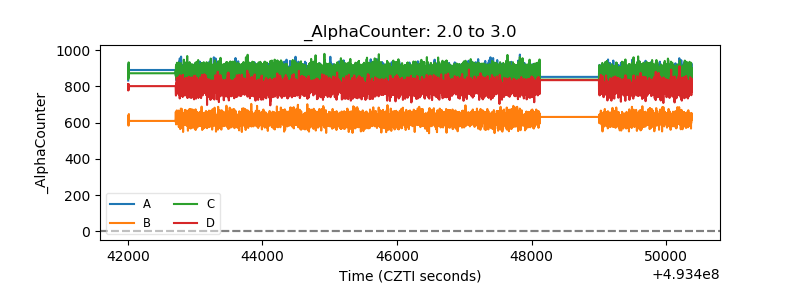 |
| _CPM_Rate | 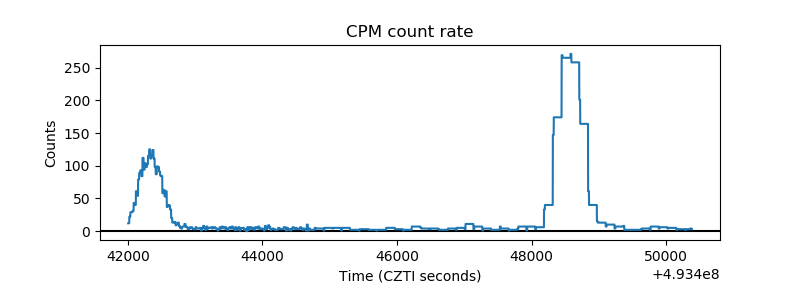 |
| CZT Counter | 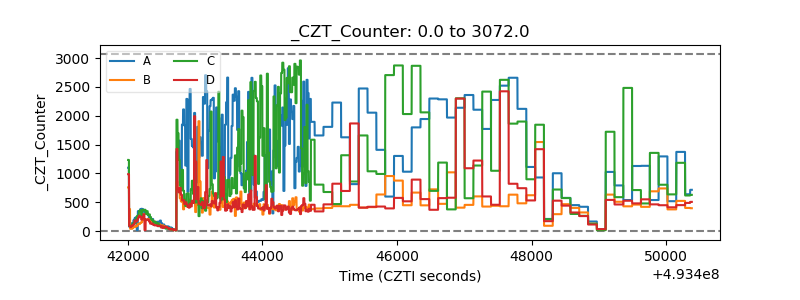 |
| +2.5 Volts monitor | 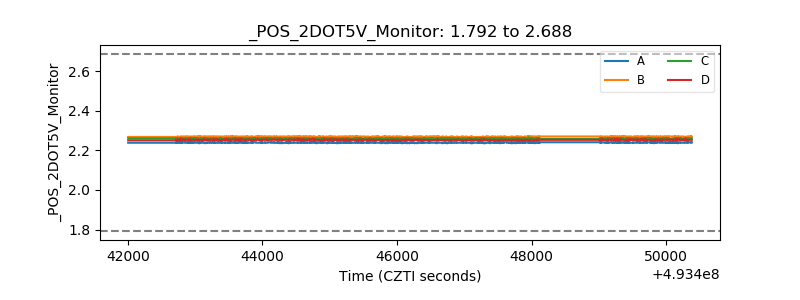 |
| +5 Volts monitor |  |
| _ROLL_ROT | 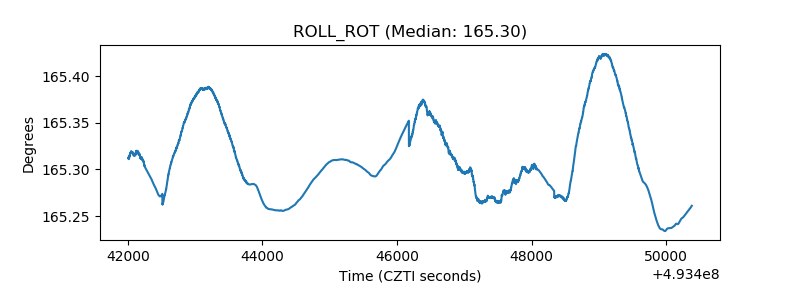 |
| _Roll_DEC | 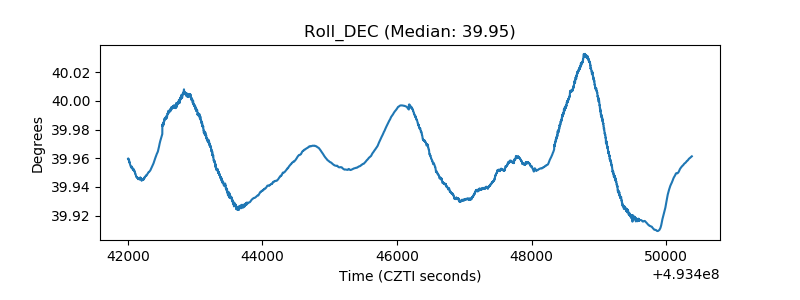 |
| _Roll_RA | 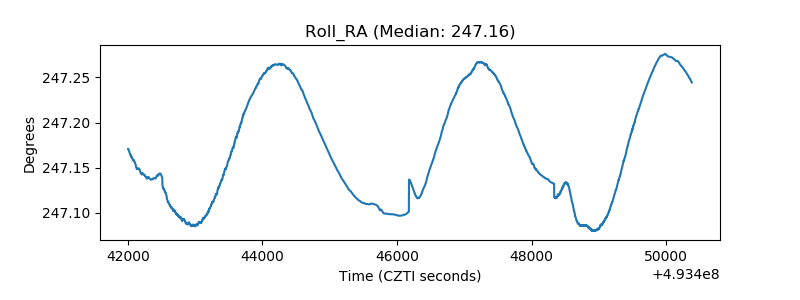 |
| Veto Counter | 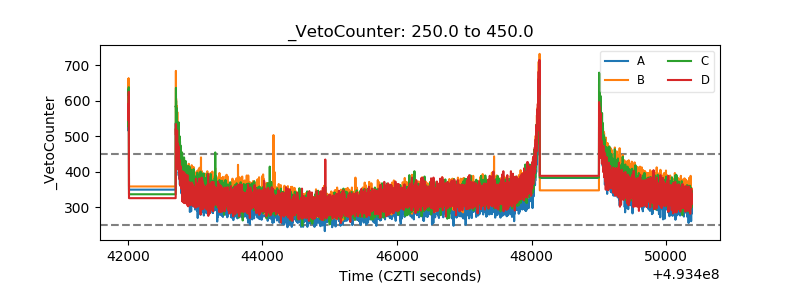 |