| Param | Original file | Final file |
|---|---|---|
| Filename | modeM0/AS1A14_004T05_9000006502_53540cztM0_level2.fits | modeM0/AS1A14_004T05_9000006502_53540cztM0_level2_quad_clean.evt |
| Size (bytes) | 686,399,040 | 91,111,680 |
| Size | 654.6 MB | 86.9 MB |
| Events in quadrant A | 9,148,995 | 502,102 |
| Events in quadrant B | 3,918,222 | 697,575 |
| Events in quadrant C | 7,619,441 | 503,564 |
| Events in quadrant D | 4,201,425 | 586,977 |
| Mode M9 | |||
|---|---|---|---|
| Quadrant | BADHDUFLAG | Total packets | Discarded packets |
| A | 0 | 13 | 0 |
| B | 0 | 13 | 0 |
| C | 0 | 14 | 0 |
| D | 0 | 14 | 0 |
| Mode SS | |||
|---|---|---|---|
| Quadrant | BADHDUFLAG | Total packets | Discarded packets |
| A | 0 | 138 | 0 |
| B | 0 | 138 | 0 |
| C | 0 | 138 | 0 |
| D | 0 | 138 | 0 |
| Mode M0 | |||
|---|---|---|---|
| Quadrant | BADHDUFLAG | Total packets | Discarded packets |
| A | 0 | 31855 | 2 |
| B | 0 | 16170 | 2 |
| C | 0 | 27190 | 2 |
| D | 0 | 17085 | 2 |
| Quadrant | Total seconds | Saturated seconds | Saturation percentage |
|---|---|---|---|
| A | 6712 | 1938 | 28.873659% |
| B | 6712 | 181 | 2.696663% |
| C | 6712 | 1512 | 22.526818% |
| D | 6712 | 250 | 3.724672% |
Noise dominated data is calculated using 1-second bins in cleaned event files. If a bin has >2000 counts, and if more than 50% of those come from <1% of pixels, then it is considered to be noise-dominated and hence unusable.
| Quadrant | # 1 sec bins | Bins with >0 counts | Bins with >2000 counts | High rate bins dominated by noise | Noise dominated (total time) | Noise dominated (detector-on time) | Marked lightcurve |
|---|---|---|---|---|---|---|---|
| A | 7706 | 6711 | 1575 | 1575 | 20.44% | 23.47% | 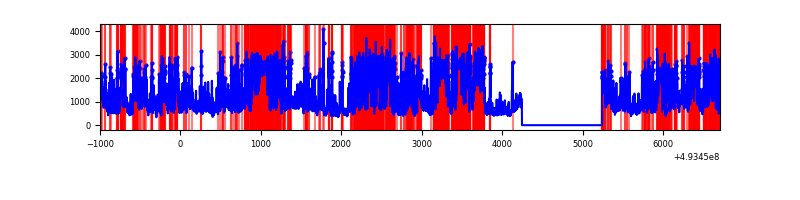 |
| B | 7707 | 6712 | 51 | 51 | 0.66% | 0.76% | 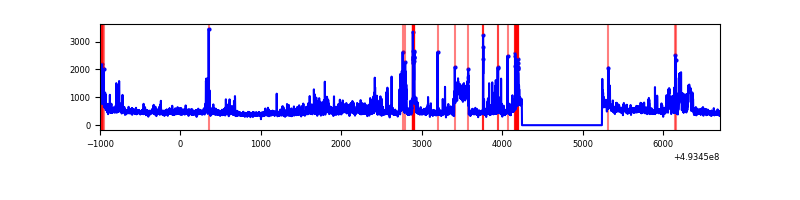 |
| C | 7707 | 6712 | 1404 | 1404 | 18.22% | 20.92% | 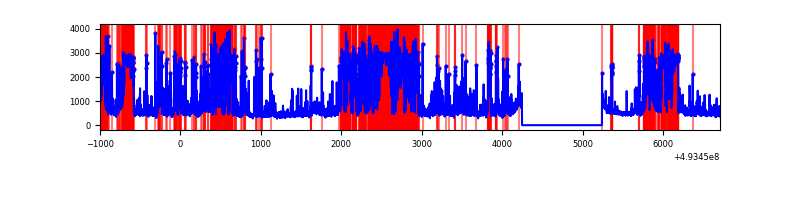 |
| D | 7707 | 6712 | 185 | 185 | 2.40% | 2.76% | 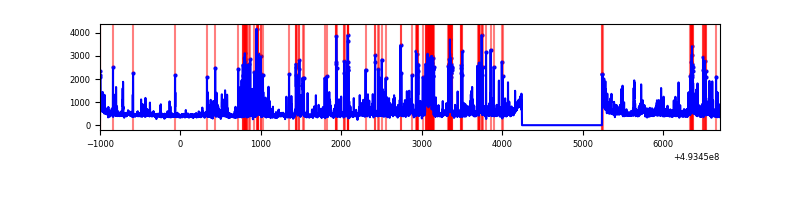 |
Top three noisy pixels from each quadrant. If the there are fewer than three noisy pixels in the level2.evt file, extra rows are filled as -1
| Pixel properties | Quadrant properties | ||||||
|---|---|---|---|---|---|---|---|
| Quadrant | DetID | PixID | Counts | Sigma | Mean | Median | Sigma |
| A | 3 | 63 | 5347253 | 32243.43 | 669 | 653 | 165.8 |
| A | 15 | 174 | 874043 | 5267.1 | 669 | 653 | 165.8 |
| A | 3 | 62 | 189503 | 1138.89 | 669 | 653 | 165.8 |
| B | 10 | 28 | 191301 | 1212.99 | 736 | 710 | 157.1 |
| B | 5 | 172 | 145380 | 920.73 | 736 | 710 | 157.1 |
| B | 0 | 213 | 143273 | 907.32 | 736 | 710 | 157.1 |
| C | 1 | 241 | 3828163 | 21895.88 | 641 | 636 | 174.8 |
| C | 15 | 224 | 1000849 | 5721.85 | 641 | 636 | 174.8 |
| C | 7 | 64 | 48187 | 272.02 | 641 | 636 | 174.8 |
| D | 2 | 120 | 298878 | 1459.71 | 719 | 686 | 204.3 |
| D | 2 | 153 | 206007 | 1005.09 | 719 | 686 | 204.3 |
| D | 2 | 249 | 199892 | 975.15 | 719 | 686 | 204.3 |
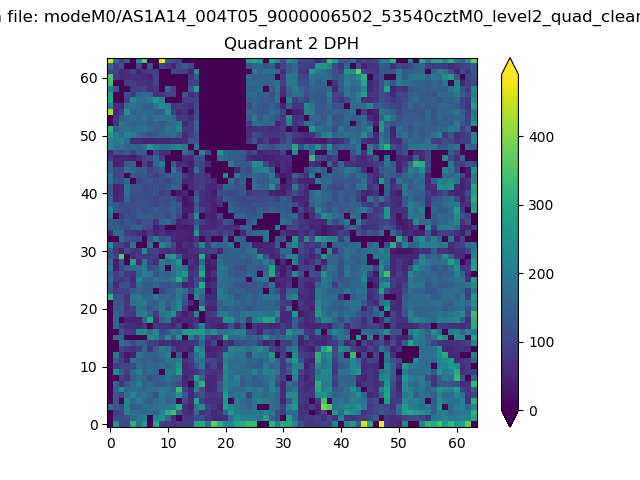
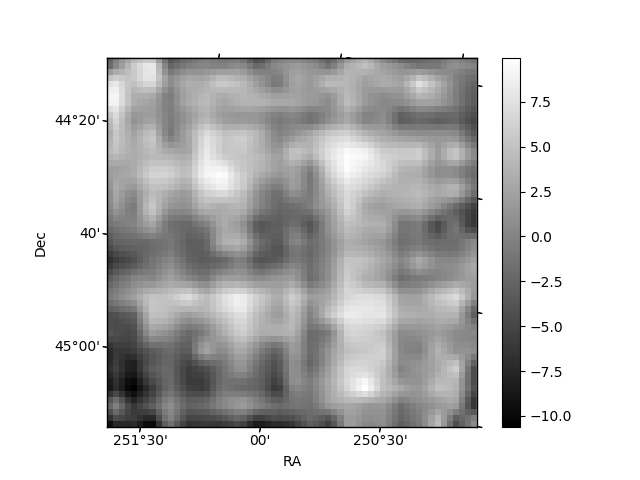
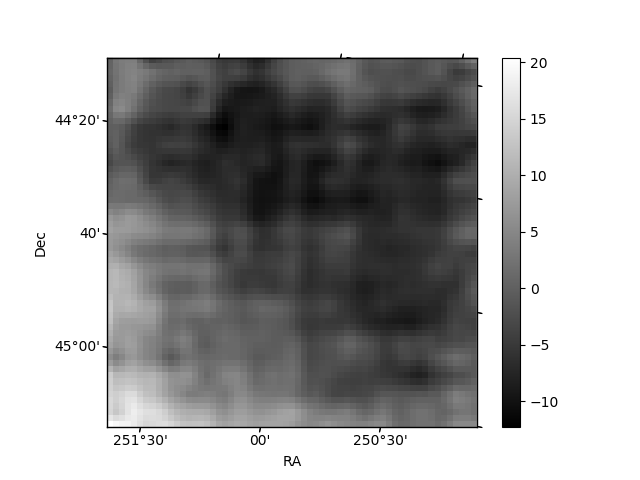
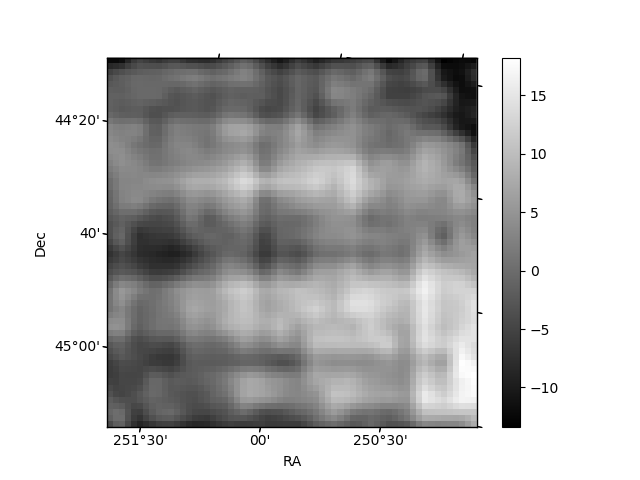
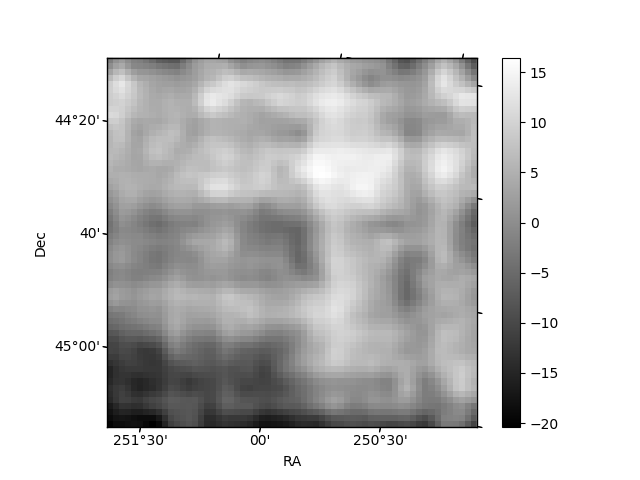
Histogram calculated using DETX and DETY for each event in the final _common_clean file
| Quadrant A | 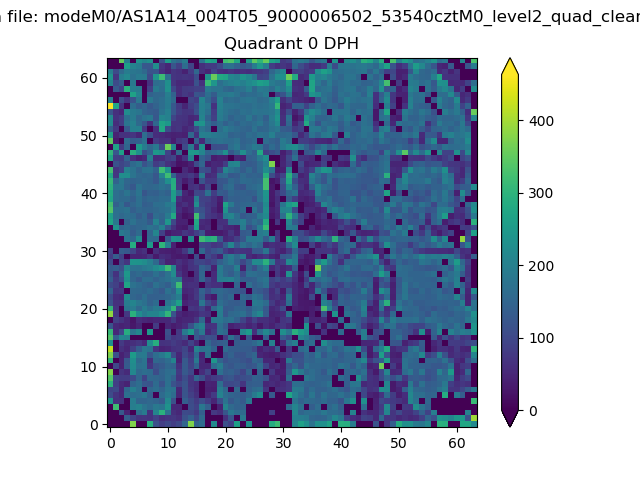 |
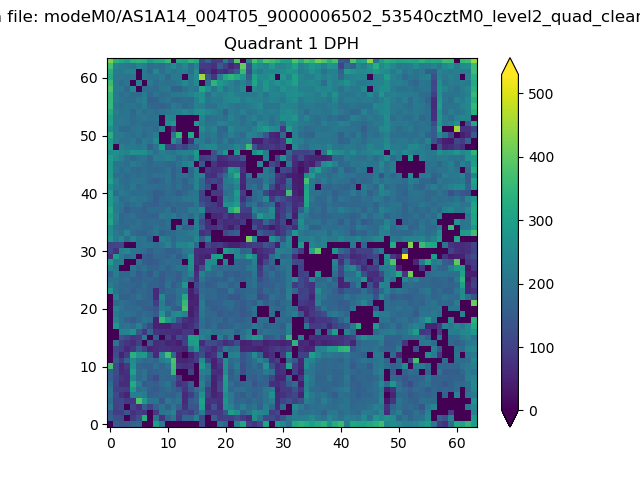 |
Quadrant B |
|---|---|---|---|
| Quadrant D | 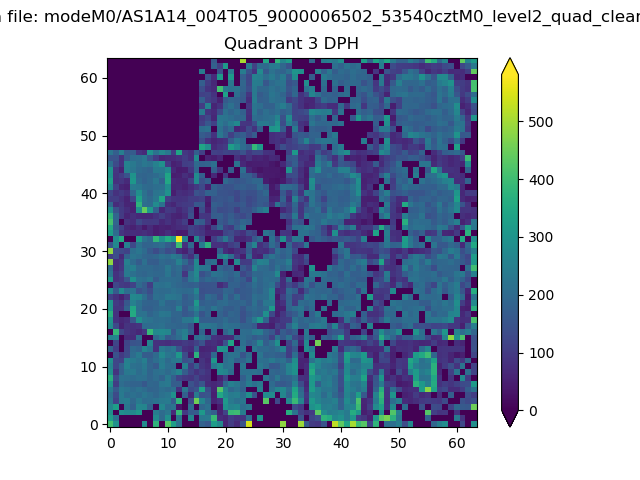 |
 |
Quadrant C |
| Plot type | Count rate plots | Images |
|---|---|---|
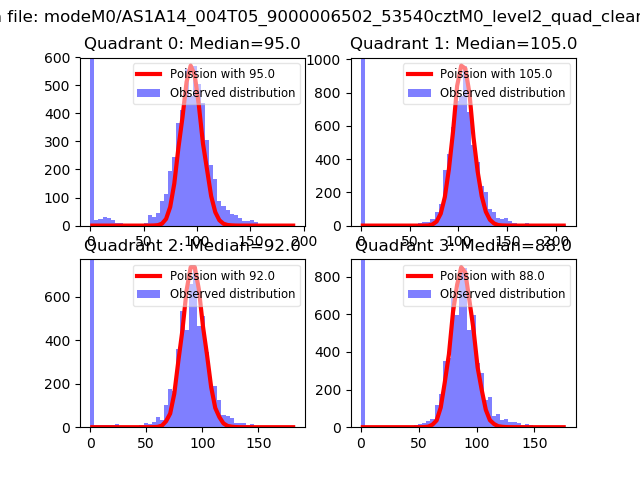
| Comparison with Poisson distribution Blue bars denote a histogram of data divided into 1 sec bins. Red curve is a Poisson curve with rate = median count rate of data. |
 |
 |
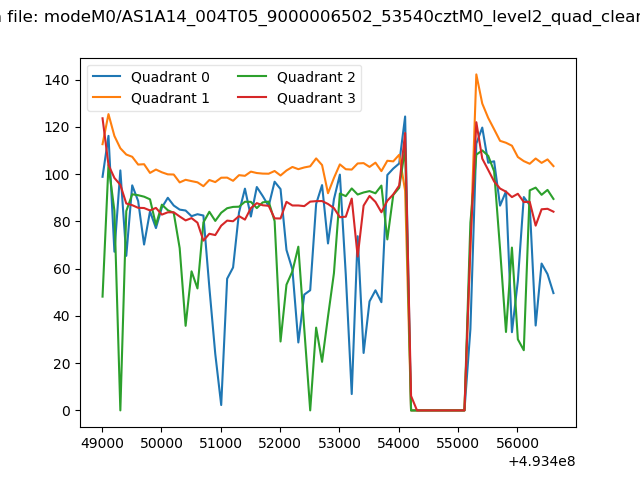
| Quadrant-wise count rates Data is divided into 100 sec bins |
 |
|
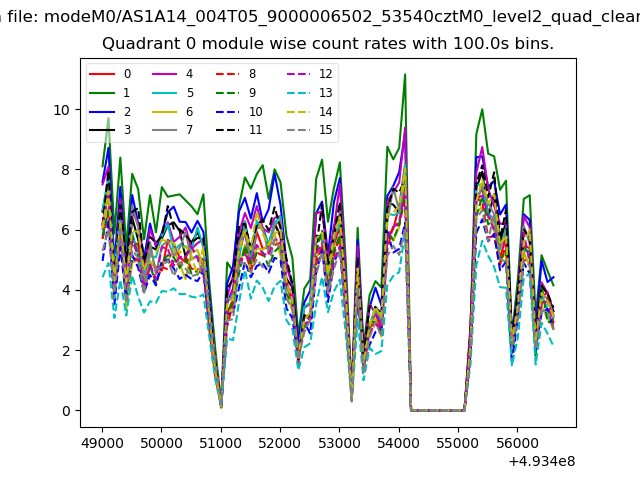
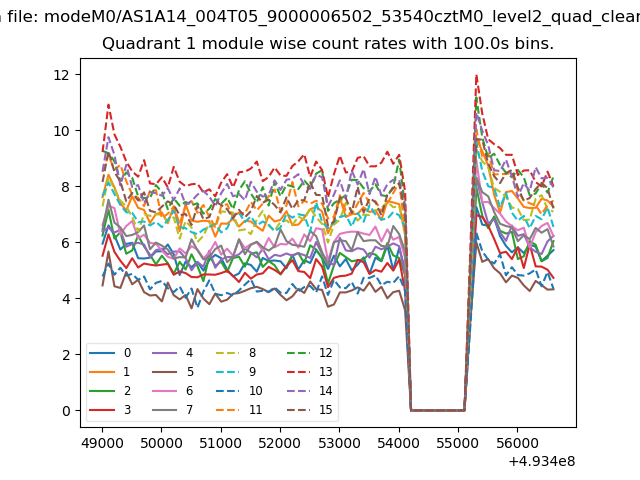
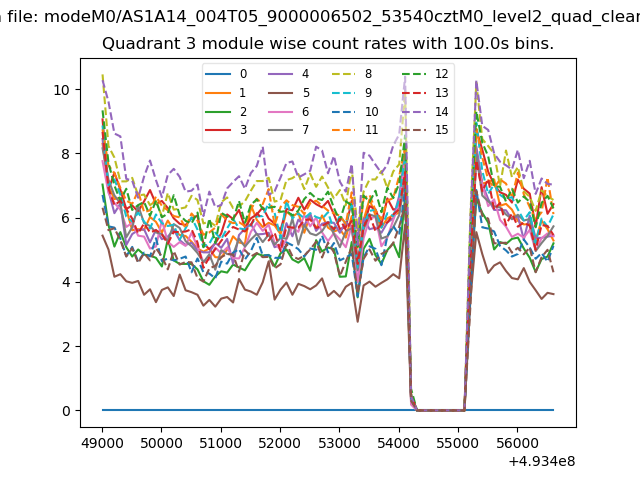
| Module-wise count rates for Quadrant A Data is divided into 100 sec bins |
 |
 |
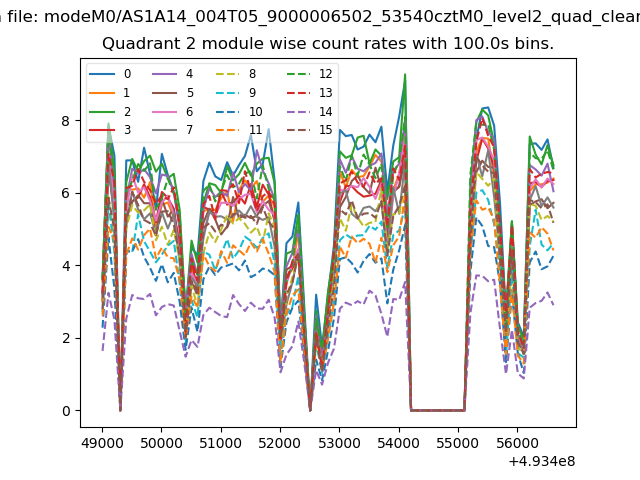
| Module-wise count rates for Quadrant B Data is divided into 100 sec bins |
 |
 |
| Module-wise count rates for Quadrant C Data is divided into 100 sec bins |
 |
 |
| Module-wise count rates for Quadrant D Data is divided into 100 sec bins |
 |
 |
| Parameter | Plot |
|---|---|
| CZT HV Monitor | 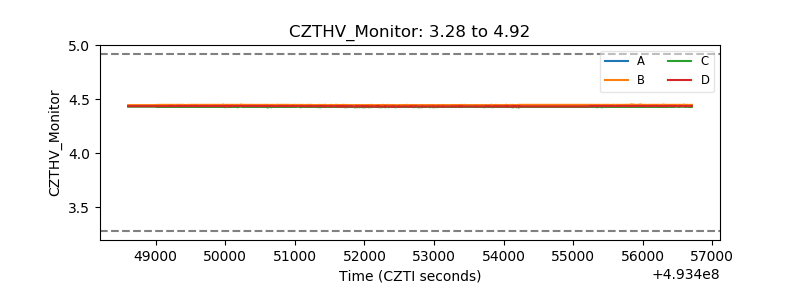 |
| D_VDD | 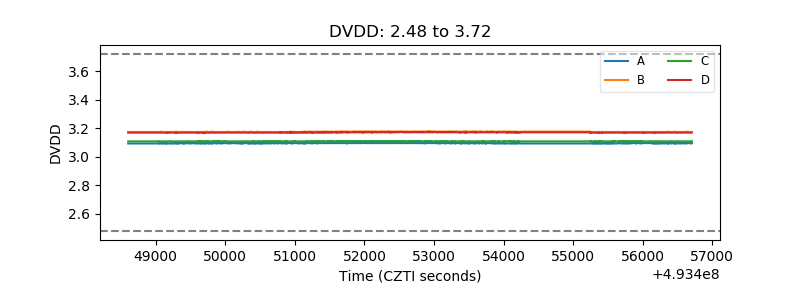 |
| Temperature 1 | 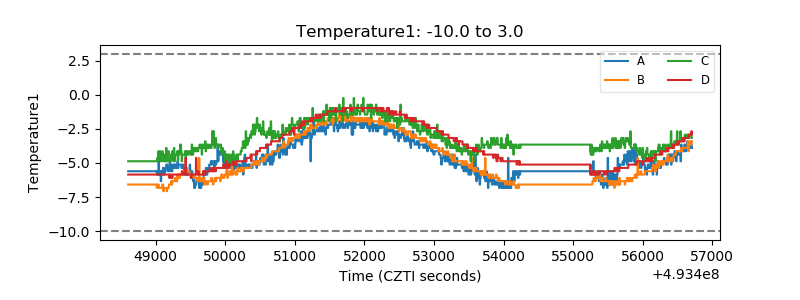 |
| Veto HV Monitor | 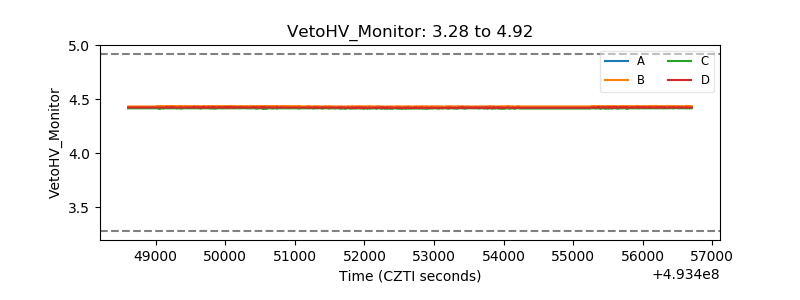 |
| Veto LLD | 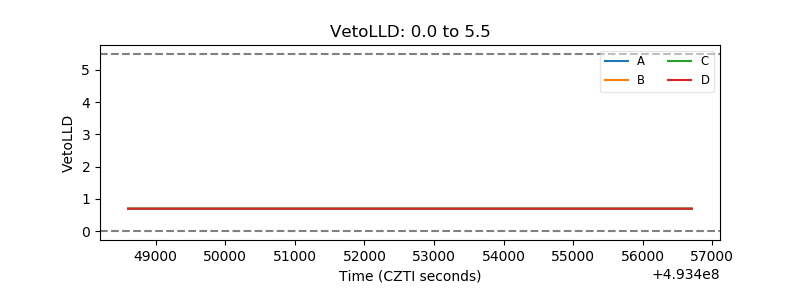 |
| Alpha Counter |  |
| _CPM_Rate | 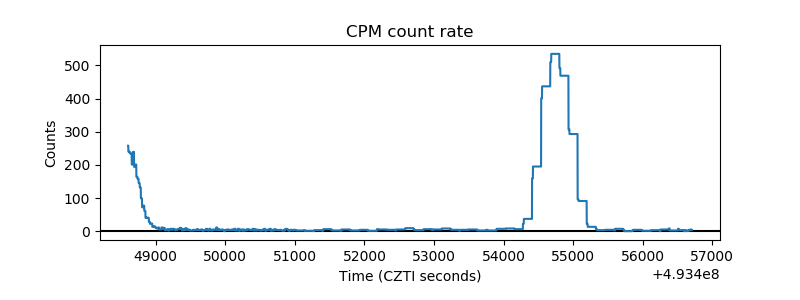 |
| CZT Counter | 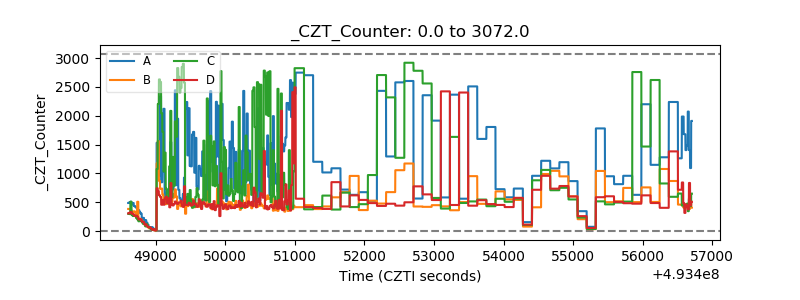 |
| +2.5 Volts monitor |  |
| +5 Volts monitor |  |
| _ROLL_ROT | 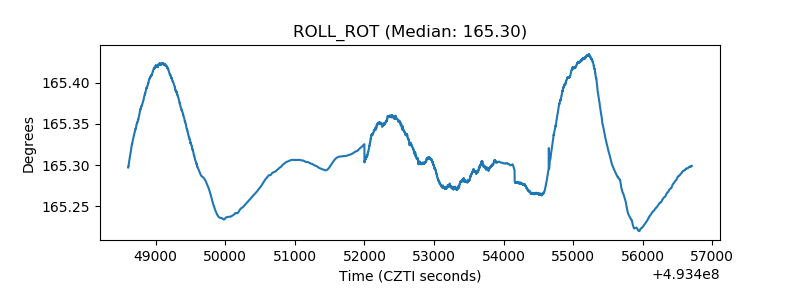 |
| _Roll_DEC | 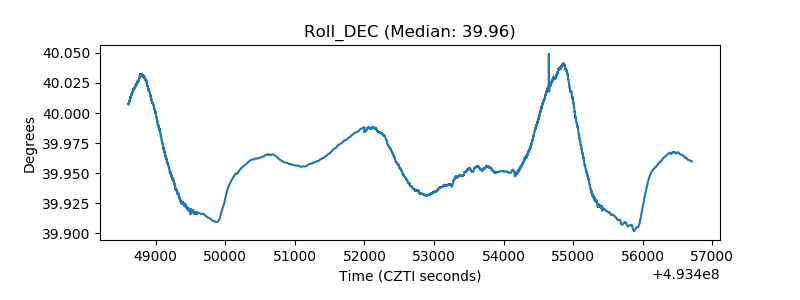 |
| _Roll_RA | 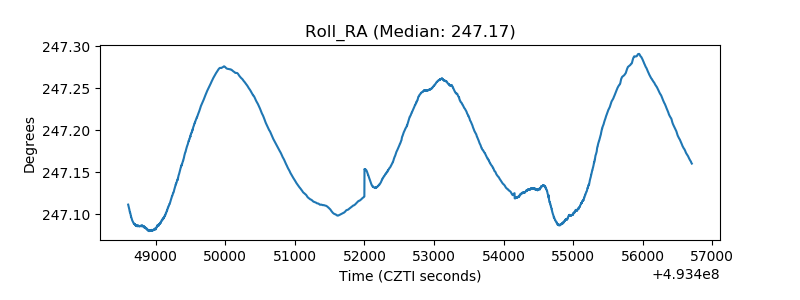 |
| Veto Counter | 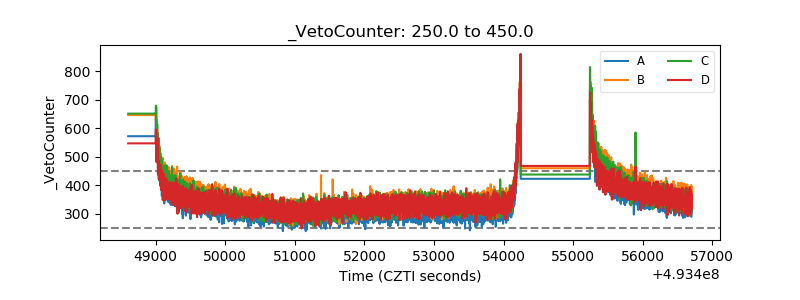 |