| Param | Original file | Final file |
|---|---|---|
| Filename | modeM0/AS1A14_004T05_9000006502_53542cztM0_level2.fits | modeM0/AS1A14_004T05_9000006502_53542cztM0_level2_quad_clean.evt |
| Size (bytes) | 634,455,360 | 77,849,280 |
| Size | 605.1 MB | 74.2 MB |
| Events in quadrant A | 7,527,251 | 414,350 |
| Events in quadrant B | 3,125,006 | 635,784 |
| Events in quadrant C | 8,239,119 | 382,873 |
| Events in quadrant D | 4,145,072 | 519,894 |
| Mode M9 | |||
|---|---|---|---|
| Quadrant | BADHDUFLAG | Total packets | Discarded packets |
| A | 0 | 12 | 0 |
| B | 0 | 12 | 0 |
| C | 0 | 12 | 0 |
| D | 0 | 12 | 0 |
| Mode SS | |||
|---|---|---|---|
| Quadrant | BADHDUFLAG | Total packets | Discarded packets |
| A | 0 | 116 | 0 |
| B | 0 | 116 | 0 |
| C | 0 | 116 | 0 |
| D | 0 | 116 | 0 |
| Mode M0 | |||
|---|---|---|---|
| Quadrant | BADHDUFLAG | Total packets | Discarded packets |
| A | 0 | 26317 | 6 |
| B | 0 | 13014 | 1 |
| C | 0 | 28399 | 1 |
| D | 0 | 16164 | 1 |
| Quadrant | Total seconds | Saturated seconds | Saturation percentage |
|---|---|---|---|
| A | 5788 | 1967 | 33.984105% |
| B | 5788 | 145 | 2.505183% |
| C | 5789 | 2004 | 34.617378% |
| D | 5789 | 323 | 5.579547% |
Noise dominated data is calculated using 1-second bins in cleaned event files. If a bin has >2000 counts, and if more than 50% of those come from <1% of pixels, then it is considered to be noise-dominated and hence unusable.
| Quadrant | # 1 sec bins | Bins with >0 counts | Bins with >2000 counts | High rate bins dominated by noise | Noise dominated (total time) | Noise dominated (detector-on time) | Marked lightcurve |
|---|---|---|---|---|---|---|---|
| A | 6947 | 5787 | 1616 | 1616 | 23.26% | 27.92% | 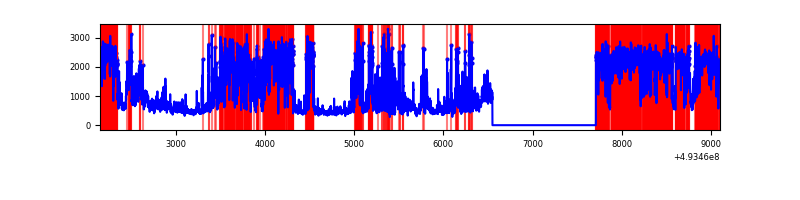 |
| B | 6948 | 5788 | 35 | 35 | 0.50% | 0.60% | 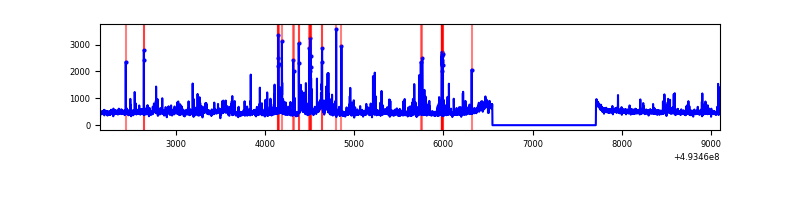 |
| C | 6948 | 5788 | 1922 | 1922 | 27.66% | 33.21% | 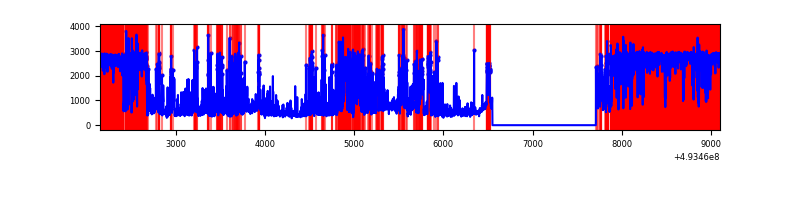 |
| D | 6949 | 5789 | 249 | 249 | 3.58% | 4.30% | 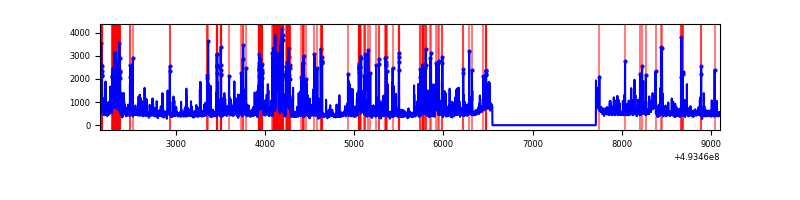 |
Top three noisy pixels from each quadrant. If the there are fewer than three noisy pixels in the level2.evt file, extra rows are filled as -1
| Pixel properties | Quadrant properties | ||||||
|---|---|---|---|---|---|---|---|
| Quadrant | DetID | PixID | Counts | Sigma | Mean | Median | Sigma |
| A | 3 | 63 | 3782911 | 27138.18 | 560 | 545 | 139.4 |
| A | 15 | 174 | 754440 | 5409.14 | 560 | 545 | 139.4 |
| A | 12 | 115 | 522208 | 3742.89 | 560 | 545 | 139.4 |
| B | 8 | 128 | 180857 | 1302.17 | 648 | 627 | 138.4 |
| B | 10 | 28 | 53860 | 384.61 | 648 | 627 | 138.4 |
| B | 0 | 213 | 52731 | 376.45 | 648 | 627 | 138.4 |
| C | 1 | 241 | 4188096 | 30071.6 | 506 | 501 | 139.3 |
| C | 15 | 224 | 1604386 | 11517.68 | 506 | 501 | 139.3 |
| C | 5 | 10 | 253288 | 1815.29 | 506 | 501 | 139.3 |
| D | 2 | 153 | 368858 | 2016.75 | 634 | 605 | 182.6 |
| D | 2 | 120 | 243511 | 1330.28 | 634 | 605 | 182.6 |
| D | 7 | 70 | 146602 | 799.56 | 634 | 605 | 182.6 |
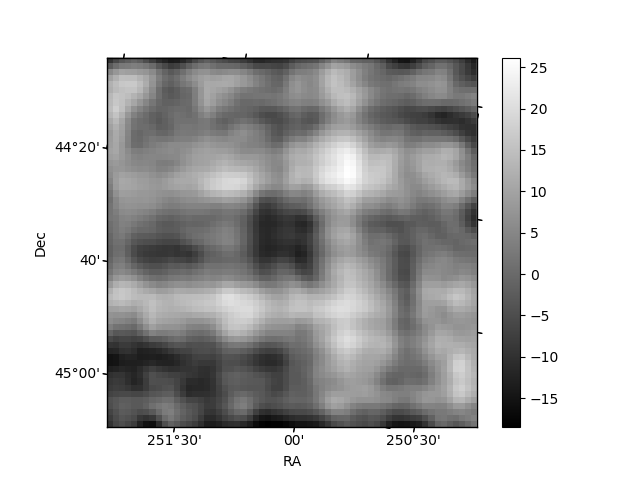
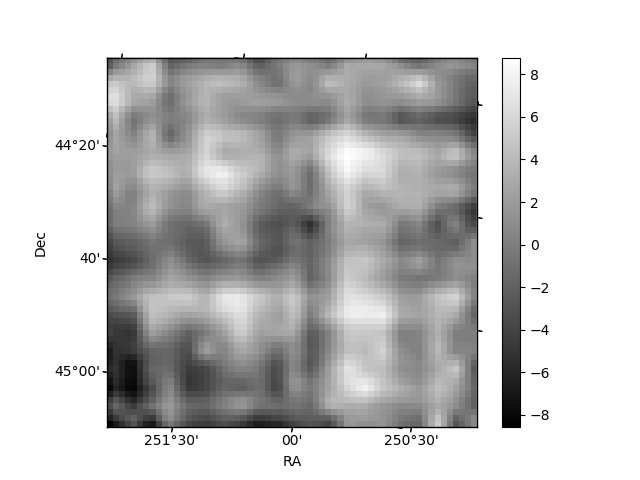
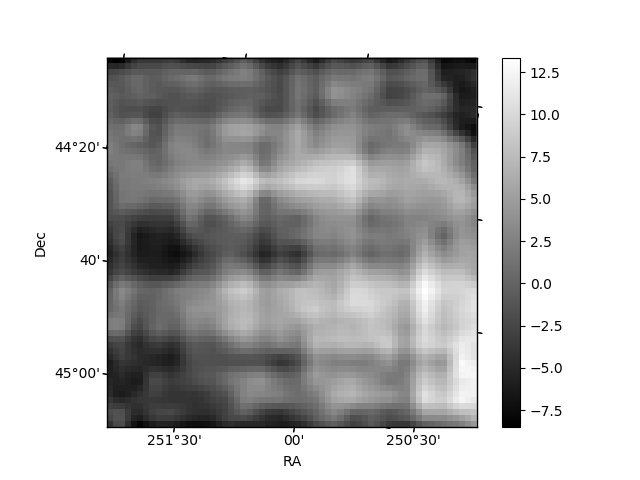
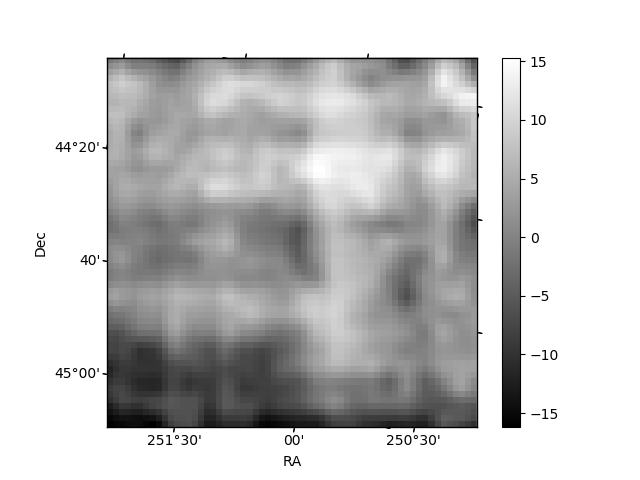
Histogram calculated using DETX and DETY for each event in the final _common_clean file
| Quadrant A | 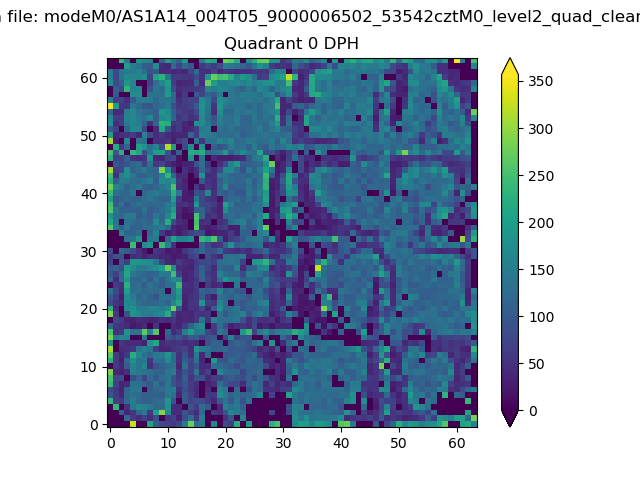 |
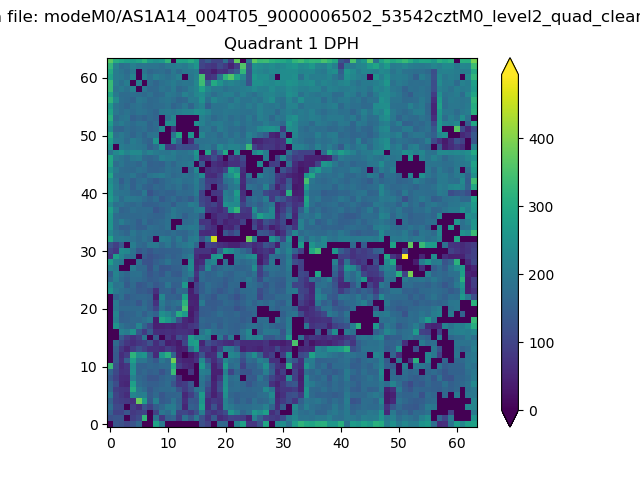 |
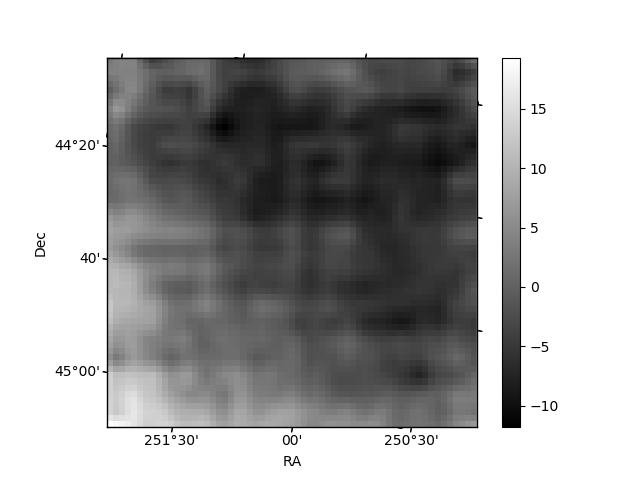
Quadrant B |
|---|---|---|---|
| Quadrant D | 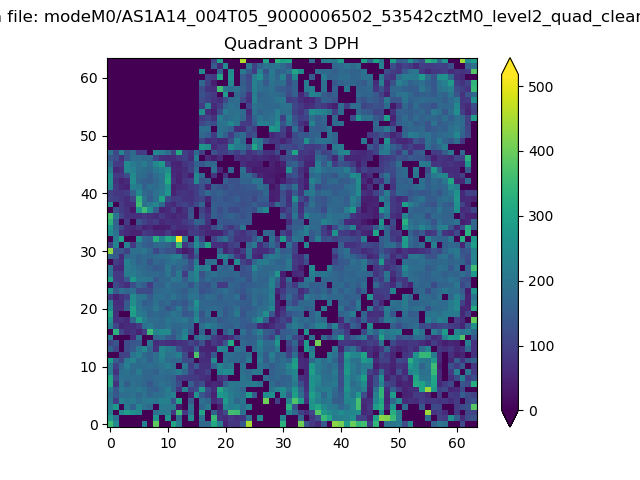 |
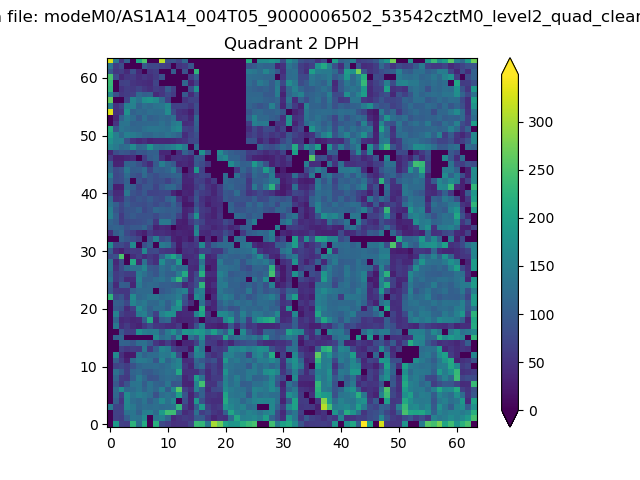 |
Quadrant C |
| Plot type | Count rate plots | Images |
|---|---|---|
| Comparison with Poisson distribution Blue bars denote a histogram of data divided into 1 sec bins. Red curve is a Poisson curve with rate = median count rate of data. |
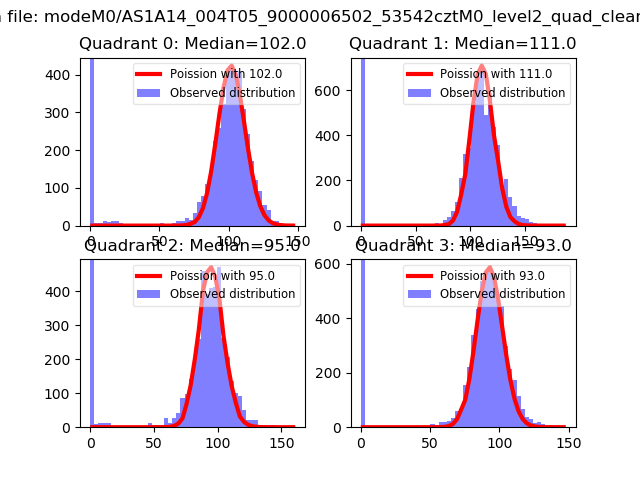 |
 |
| Quadrant-wise count rates Data is divided into 100 sec bins |
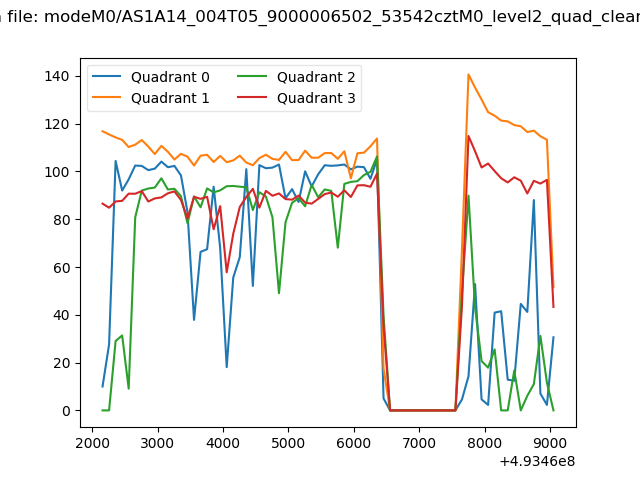 |
|
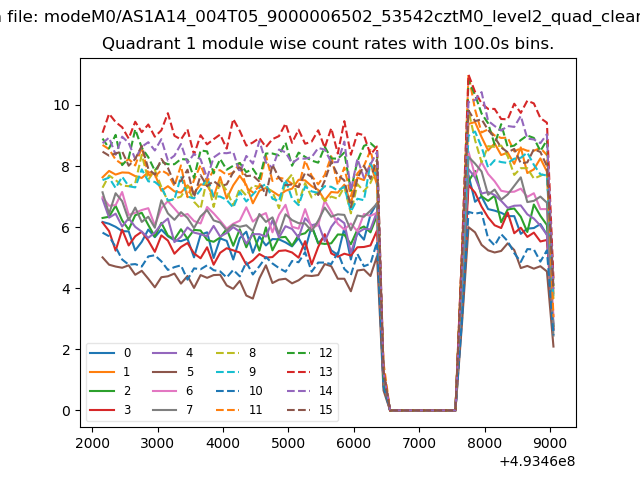
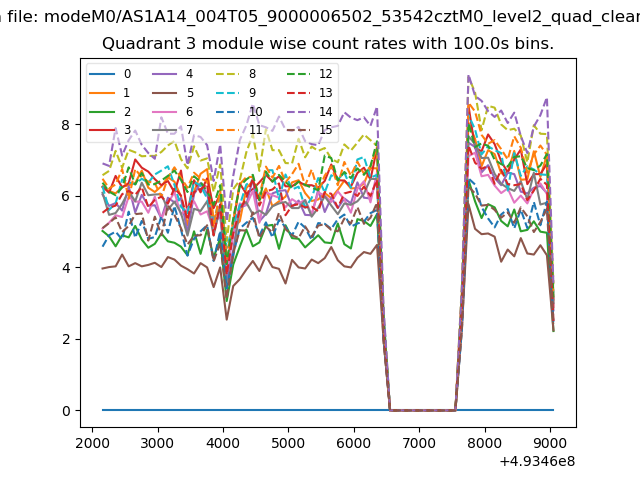
| Module-wise count rates for Quadrant A Data is divided into 100 sec bins |
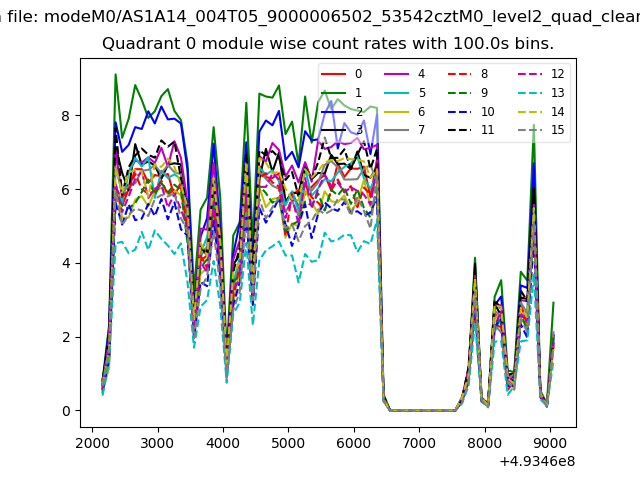 |
 |
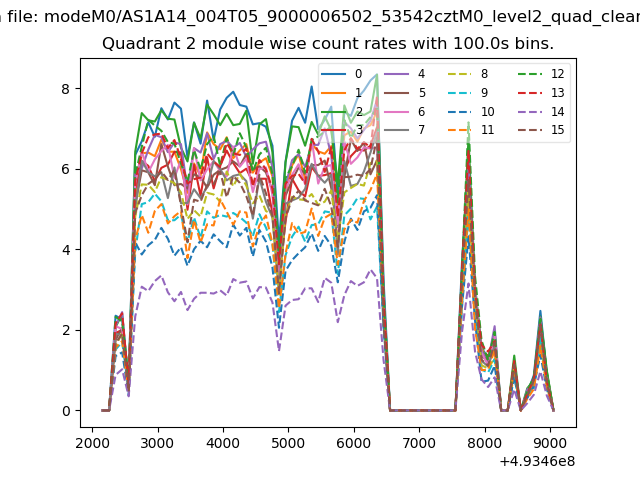
| Module-wise count rates for Quadrant B Data is divided into 100 sec bins |
 |
 |
| Module-wise count rates for Quadrant C Data is divided into 100 sec bins |
 |
 |
| Module-wise count rates for Quadrant D Data is divided into 100 sec bins |
 |
 |
| Parameter | Plot |
|---|---|
| CZT HV Monitor | 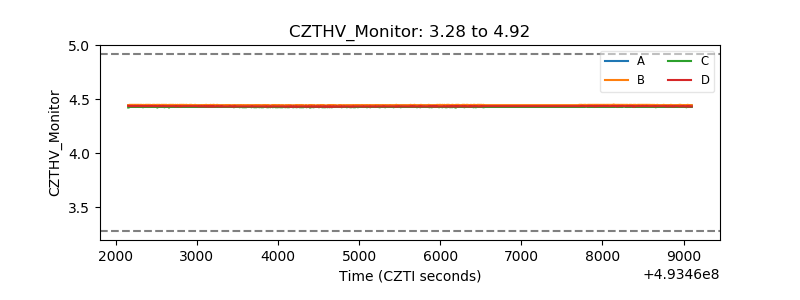 |
| D_VDD | 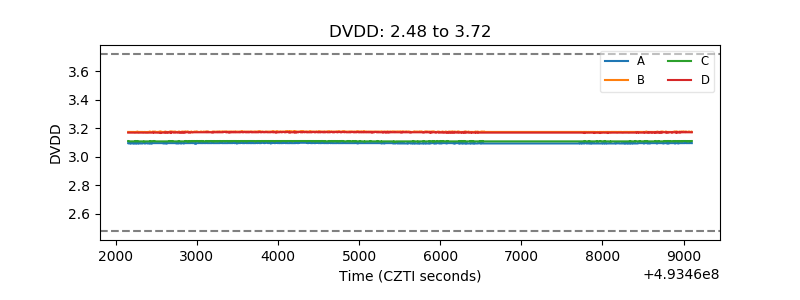 |
| Temperature 1 | 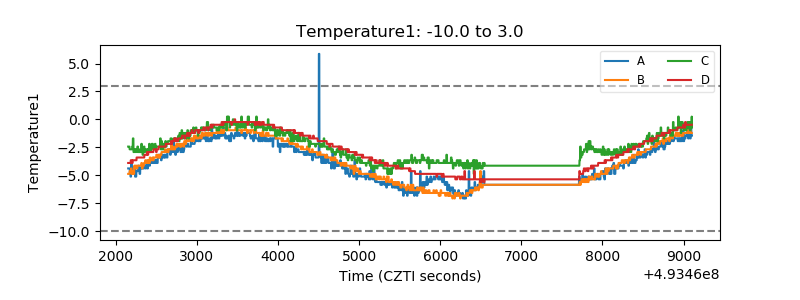 |
| Veto HV Monitor | 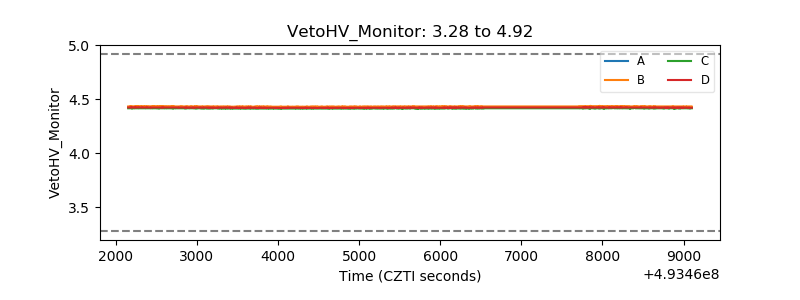 |
| Veto LLD | 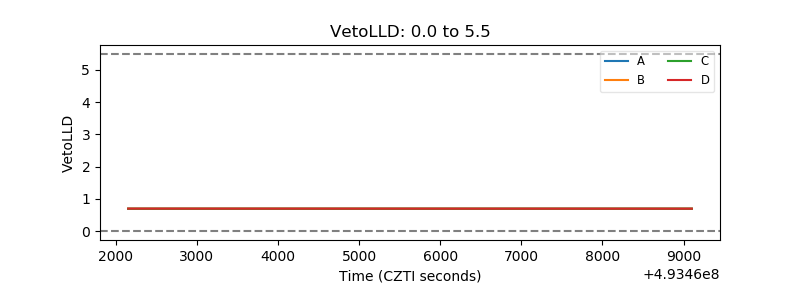 |
| Alpha Counter | 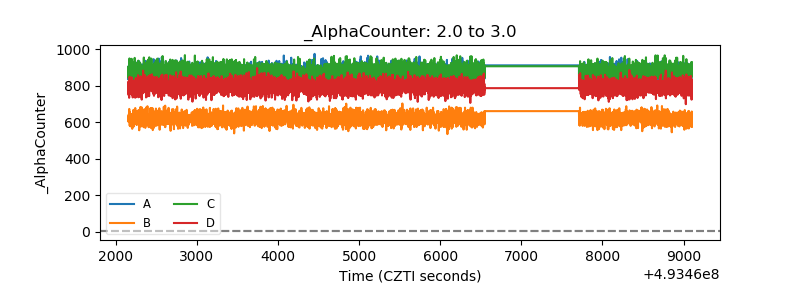 |
| _CPM_Rate | 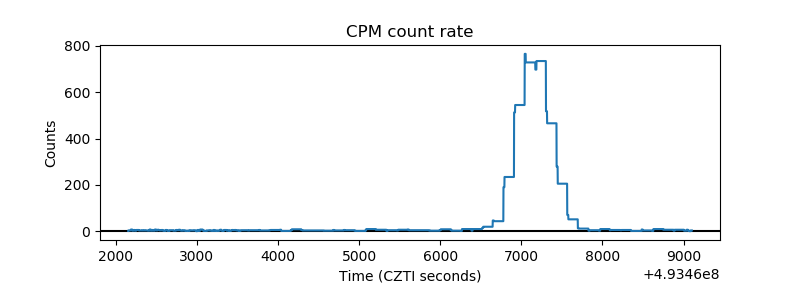 |
| CZT Counter | 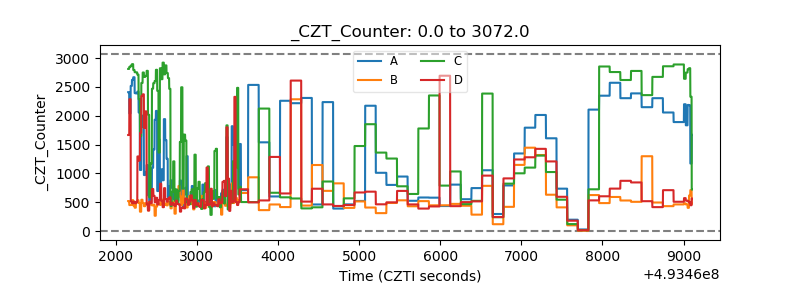 |
| +2.5 Volts monitor |  |
| +5 Volts monitor |  |
| _ROLL_ROT | 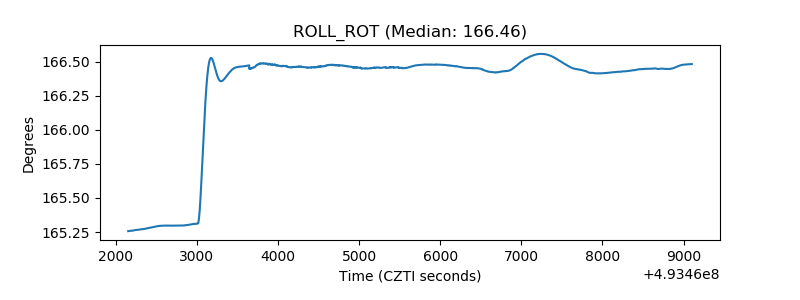 |
| _Roll_DEC | 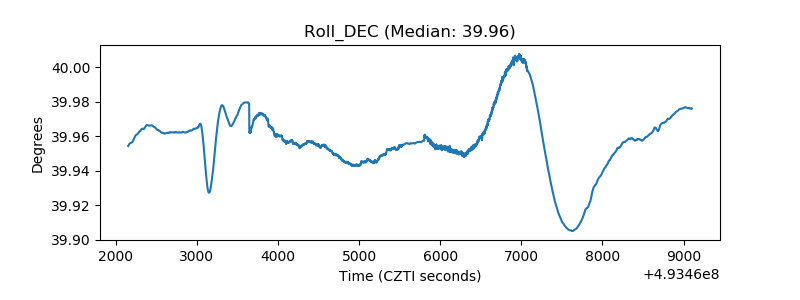 |
| _Roll_RA | 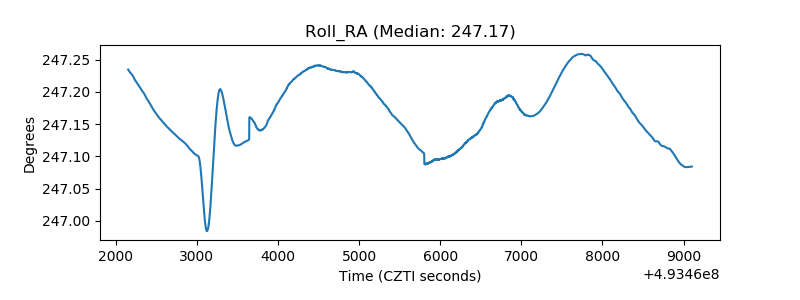 |
| Veto Counter | 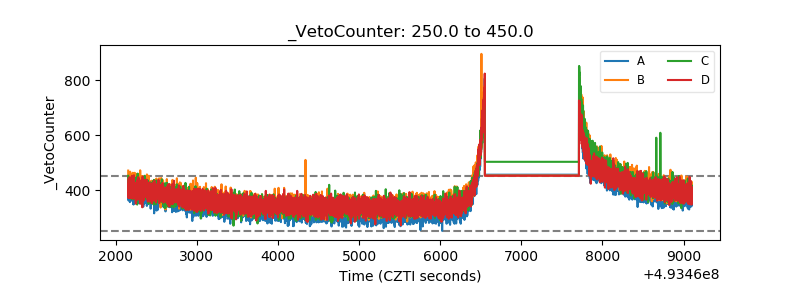 |