| Param | Original file | Final file |
|---|---|---|
| Filename | modeM0/AS1A14_004T05_9000006502_53543cztM0_level2.fits | modeM0/AS1A14_004T05_9000006502_53543cztM0_level2_quad_clean.evt |
| Size (bytes) | 2,354,993,280 | 279,547,200 |
| Size | 2.2 GB | 266.6 MB |
| Events in quadrant A | 30,516,354 | 1,363,806 |
| Events in quadrant B | 12,356,008 | 2,273,339 |
| Events in quadrant C | 26,952,984 | 1,459,409 |
| Events in quadrant D | 15,694,479 | 1,889,857 |
| Mode M9 | |||
|---|---|---|---|
| Quadrant | BADHDUFLAG | Total packets | Discarded packets |
| A | 0 | 43 | 0 |
| B | 0 | 43 | 0 |
| C | 0 | 43 | 0 |
| D | 0 | 43 | 0 |
| Mode SS | |||
|---|---|---|---|
| Quadrant | BADHDUFLAG | Total packets | Discarded packets |
| A | 0 | 438 | 0 |
| B | 0 | 438 | 0 |
| C | 0 | 438 | 0 |
| D | 0 | 438 | 0 |
| Mode M0 | |||
|---|---|---|---|
| Quadrant | BADHDUFLAG | Total packets | Discarded packets |
| A | 0 | 105385 | 4 |
| B | 0 | 50951 | 5 |
| C | 0 | 94691 | 4 |
| D | 0 | 61105 | 4 |
| Quadrant | Total seconds | Saturated seconds | Saturation percentage |
|---|---|---|---|
| A | 21453 | 8280 | 38.596001% |
| B | 21452 | 834 | 3.887749% |
| C | 21453 | 6036 | 28.135925% |
| D | 21453 | 1290 | 6.013145% |
Noise dominated data is calculated using 1-second bins in cleaned event files. If a bin has >2000 counts, and if more than 50% of those come from <1% of pixels, then it is considered to be noise-dominated and hence unusable.
| Quadrant | # 1 sec bins | Bins with >0 counts | Bins with >2000 counts | High rate bins dominated by noise | Noise dominated (total time) | Noise dominated (detector-on time) | Marked lightcurve |
|---|---|---|---|---|---|---|---|
| A | 25793 | 21453 | 6867 | 6867 | 26.62% | 32.01% | 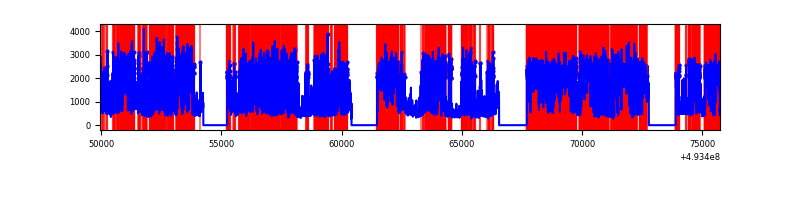 |
| B | 25792 | 21452 | 245 | 245 | 0.95% | 1.14% | 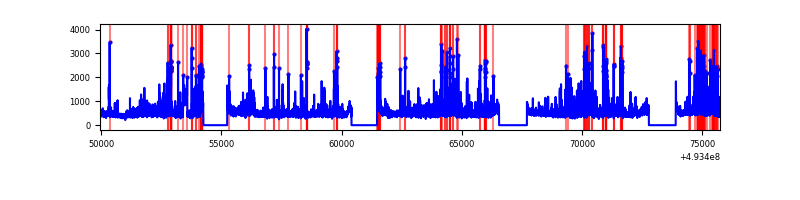 |
| C | 25793 | 21453 | 5573 | 5573 | 21.61% | 25.98% | 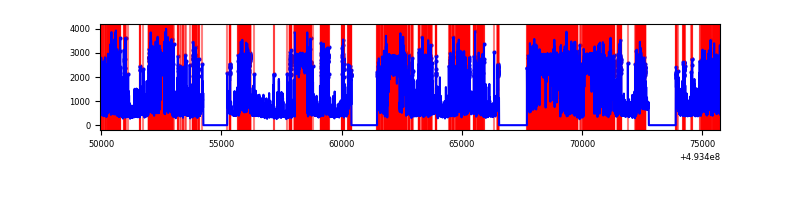 |
| D | 25793 | 21453 | 963 | 963 | 3.73% | 4.49% | 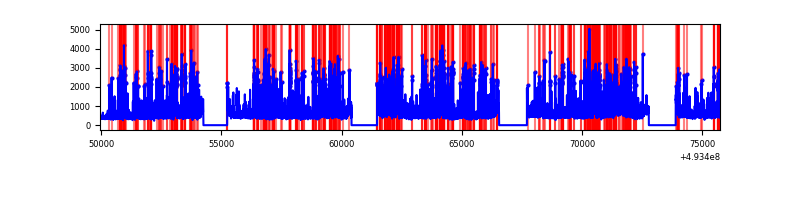 |
Top three noisy pixels from each quadrant. If the there are fewer than three noisy pixels in the level2.evt file, extra rows are filled as -1
| Pixel properties | Quadrant properties | ||||||
|---|---|---|---|---|---|---|---|
| Quadrant | DetID | PixID | Counts | Sigma | Mean | Median | Sigma |
| A | 3 | 63 | 18461256 | 37583.5 | 1983 | 1934 | 491.2 |
| A | 15 | 174 | 2372092 | 4825.68 | 1983 | 1934 | 491.2 |
| A | 12 | 115 | 863195 | 1753.54 | 1983 | 1934 | 491.2 |
| B | 5 | 185 | 557531 | 1112.94 | 2363 | 2276 | 498.9 |
| B | 8 | 128 | 375166 | 747.41 | 2363 | 2276 | 498.9 |
| B | 10 | 28 | 272689 | 542.01 | 2363 | 2276 | 498.9 |
| C | 1 | 241 | 11922456 | 21877.24 | 1991 | 1970 | 544.9 |
| C | 15 | 224 | 5020026 | 9209.46 | 1991 | 1970 | 544.9 |
| C | 4 | 5 | 969846 | 1776.31 | 1991 | 1970 | 544.9 |
| D | 12 | 18 | 929888 | 1383.64 | 2331 | 2218 | 670.5 |
| D | 2 | 153 | 868089 | 1291.46 | 2331 | 2218 | 670.5 |
| D | 2 | 120 | 854559 | 1271.28 | 2331 | 2218 | 670.5 |
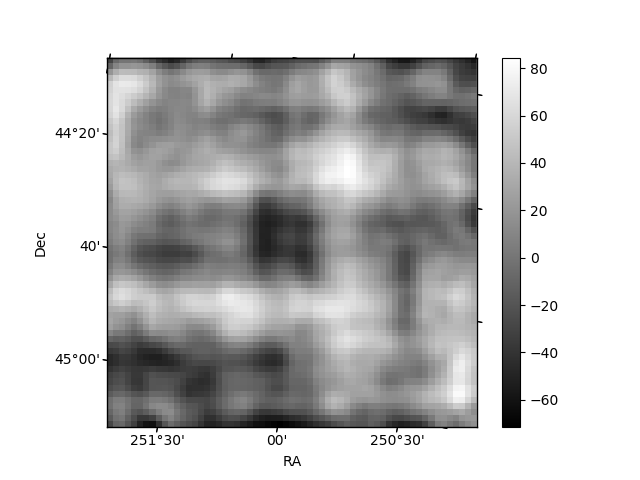
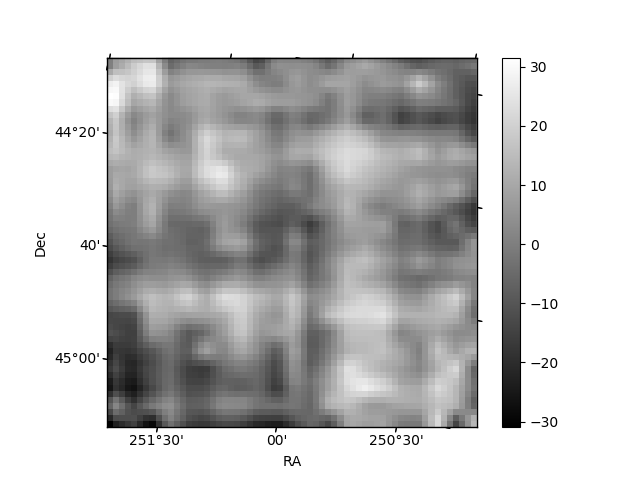
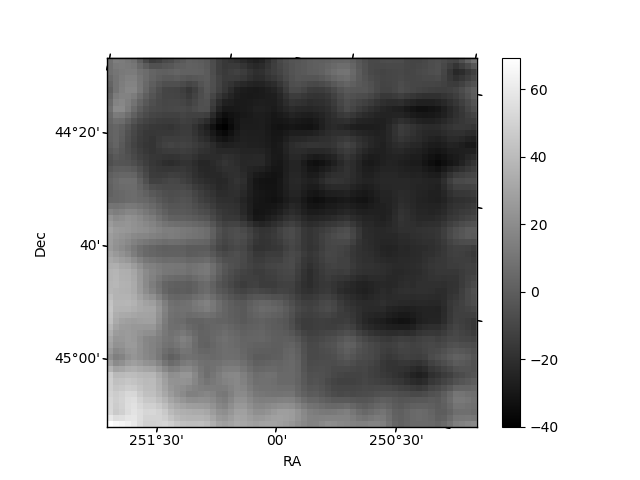
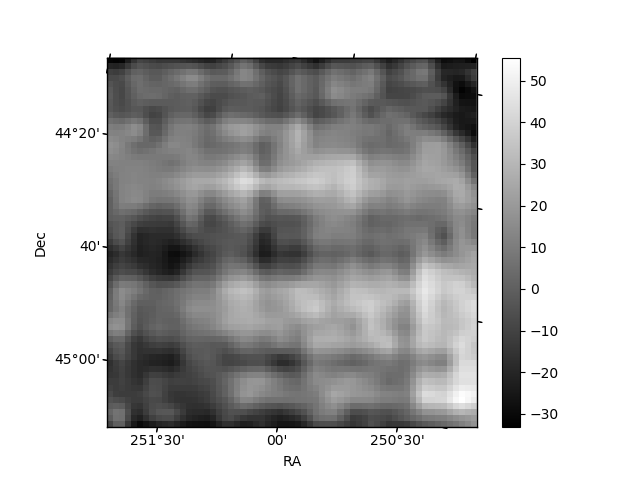
Histogram calculated using DETX and DETY for each event in the final _common_clean file
| Quadrant A | 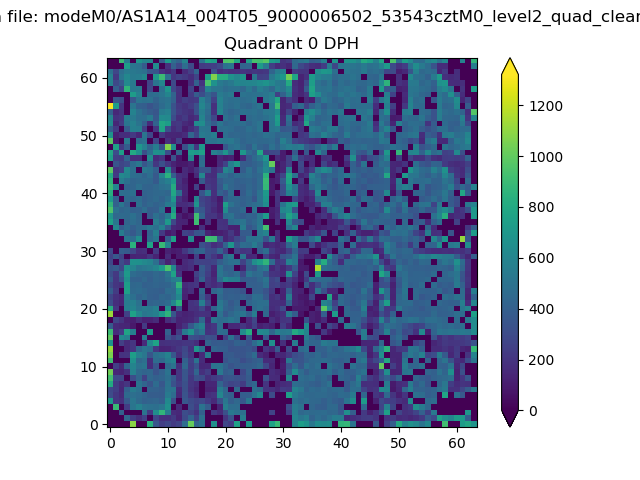 |
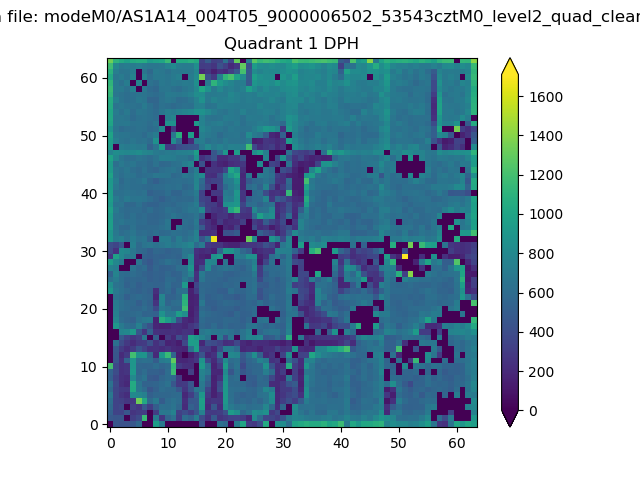 |
Quadrant B |
|---|---|---|---|
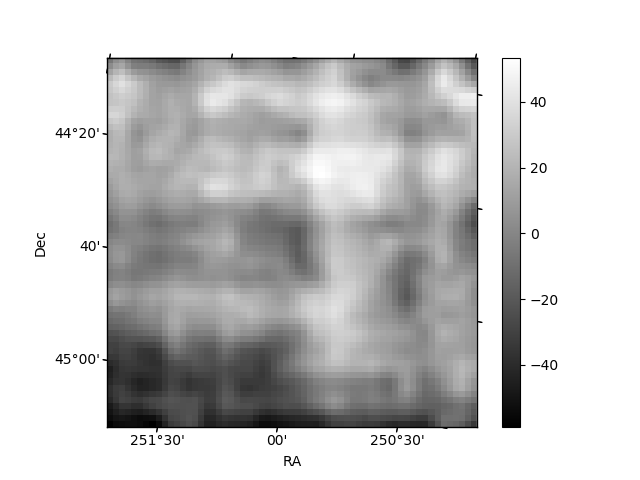
| Quadrant D | 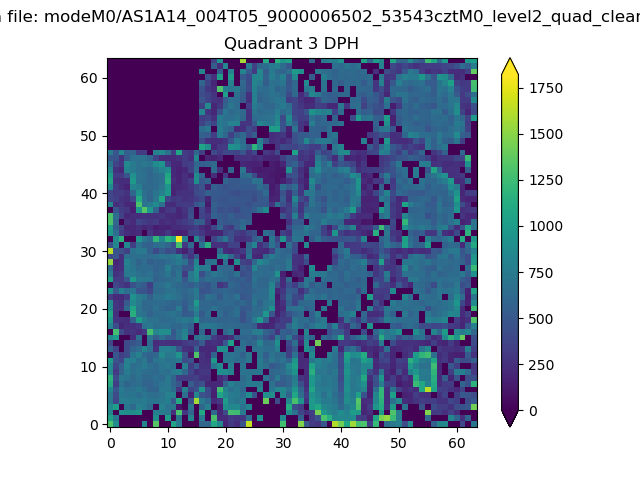 |
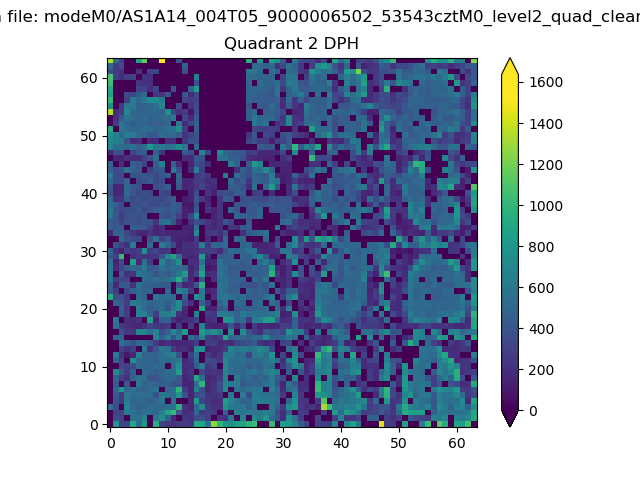 |
Quadrant C |
| Plot type | Count rate plots | Images |
|---|---|---|
| Comparison with Poisson distribution Blue bars denote a histogram of data divided into 1 sec bins. Red curve is a Poisson curve with rate = median count rate of data. |
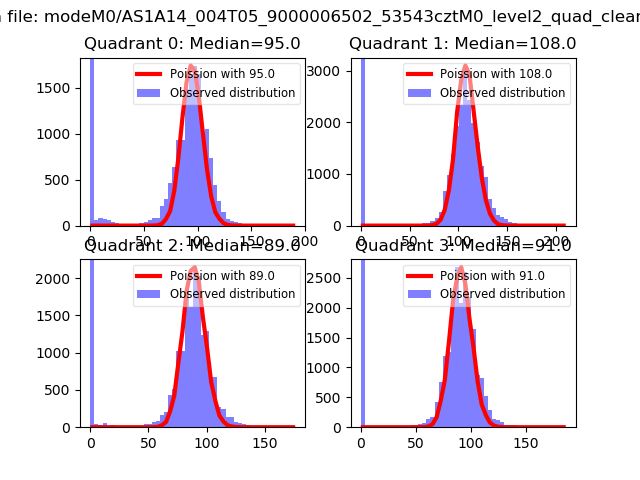 |
 |
| Quadrant-wise count rates Data is divided into 100 sec bins |
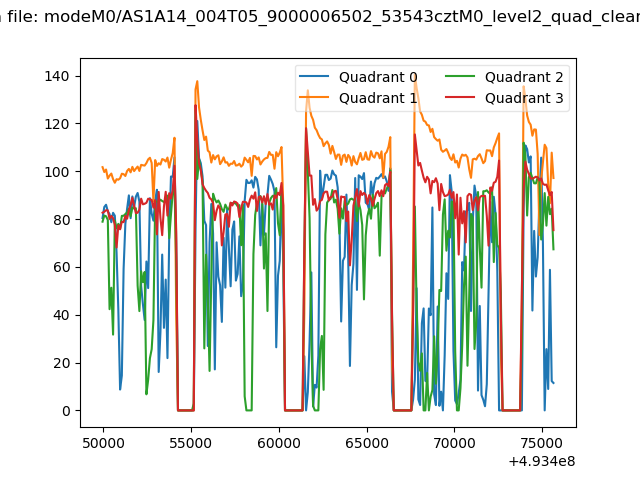 |
|
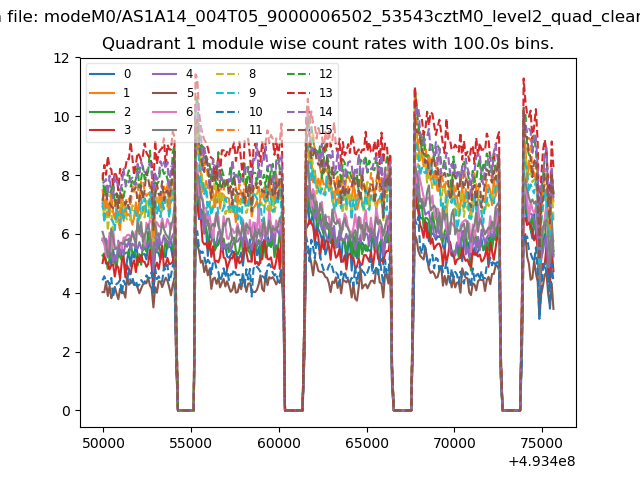
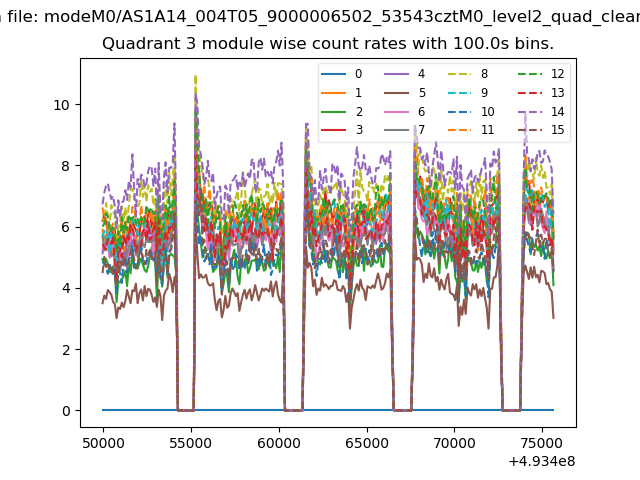
| Module-wise count rates for Quadrant A Data is divided into 100 sec bins |
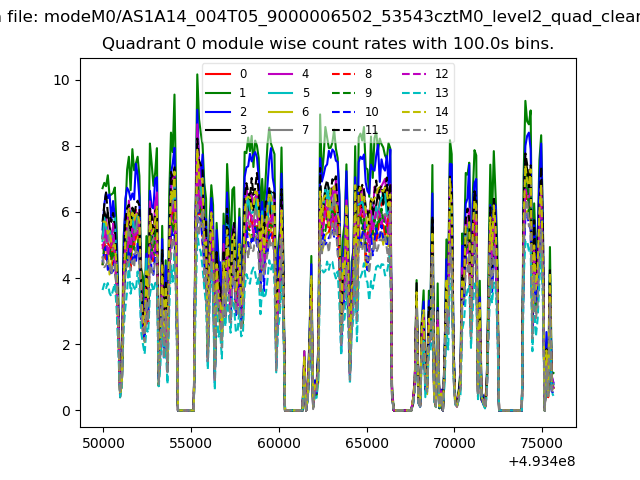 |
 |
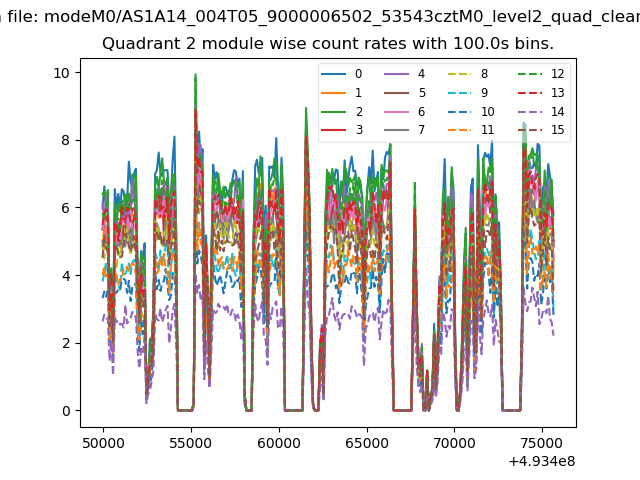
| Module-wise count rates for Quadrant B Data is divided into 100 sec bins |
 |
 |
| Module-wise count rates for Quadrant C Data is divided into 100 sec bins |
 |
 |
| Module-wise count rates for Quadrant D Data is divided into 100 sec bins |
 |
 |
| Parameter | Plot |
|---|---|
| CZT HV Monitor | 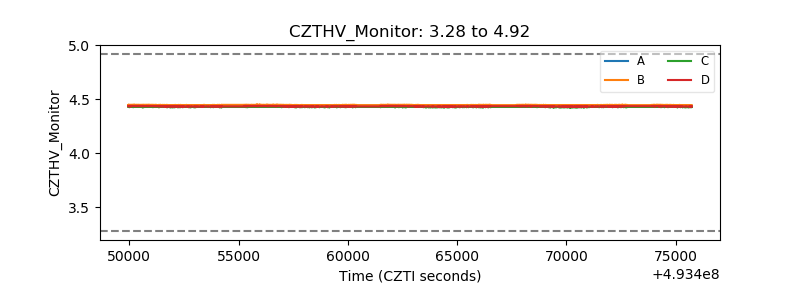 |
| D_VDD | 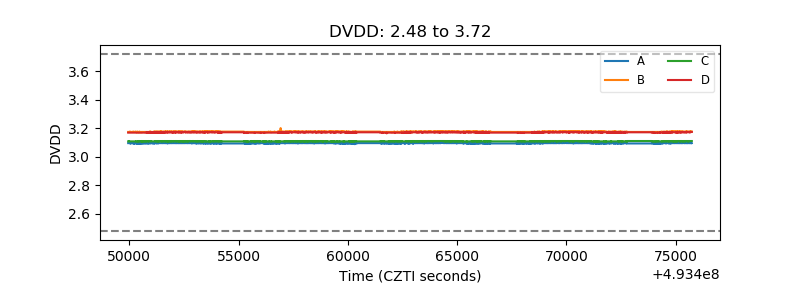 |
| Temperature 1 | 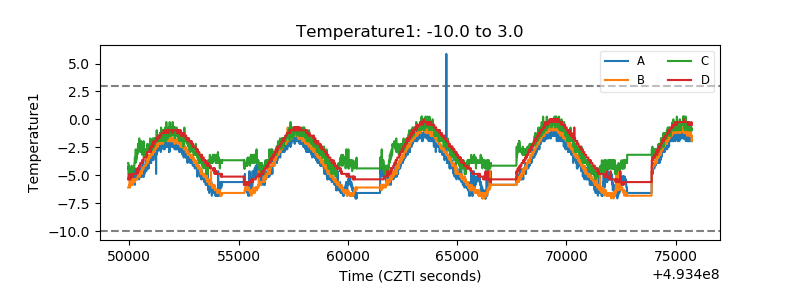 |
| Veto HV Monitor |  |
| Veto LLD | 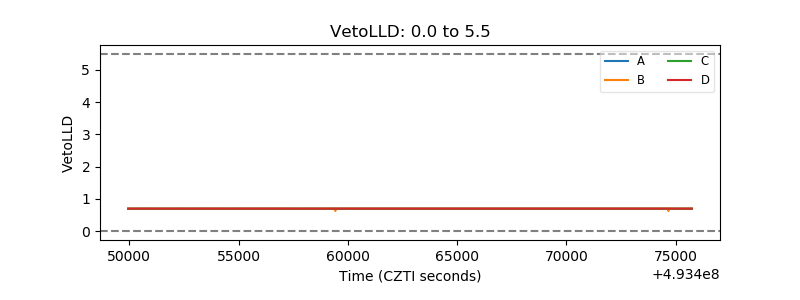 |
| Alpha Counter | 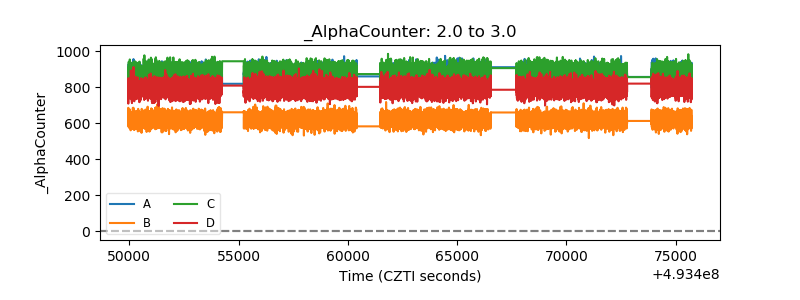 |
| _CPM_Rate | 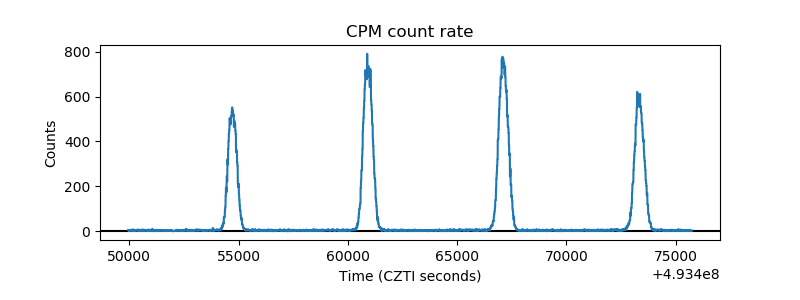 |
| CZT Counter | 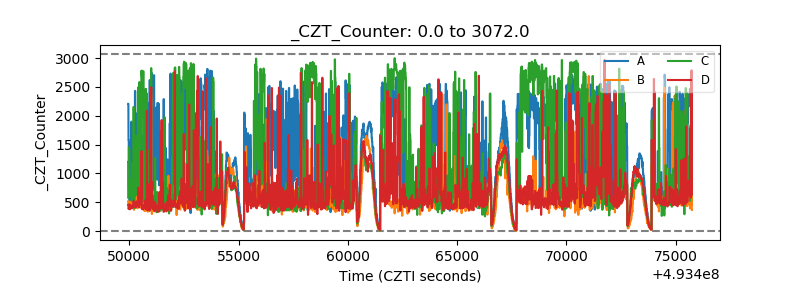 |
| +2.5 Volts monitor |  |
| +5 Volts monitor |  |
| _ROLL_ROT | 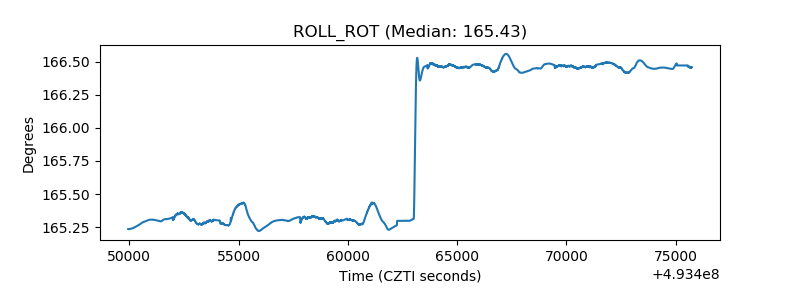 |
| _Roll_DEC | 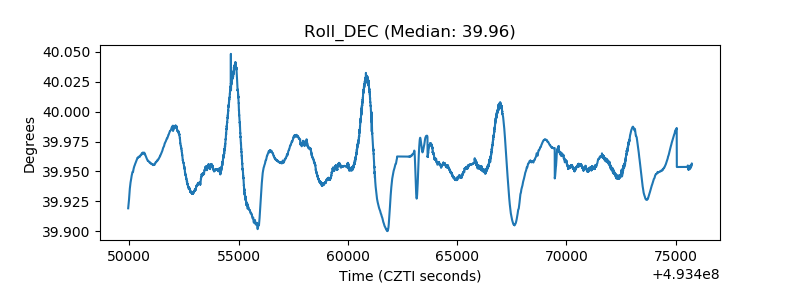 |
| _Roll_RA | 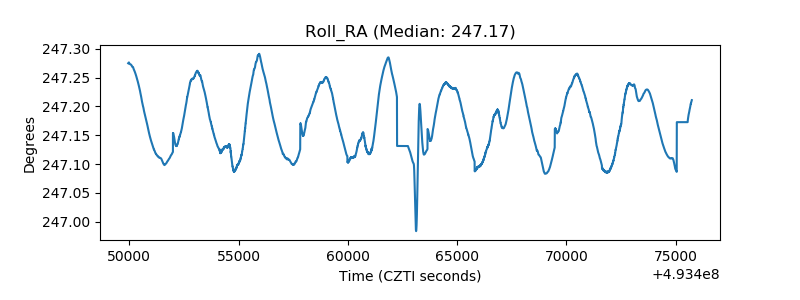 |
| Veto Counter | 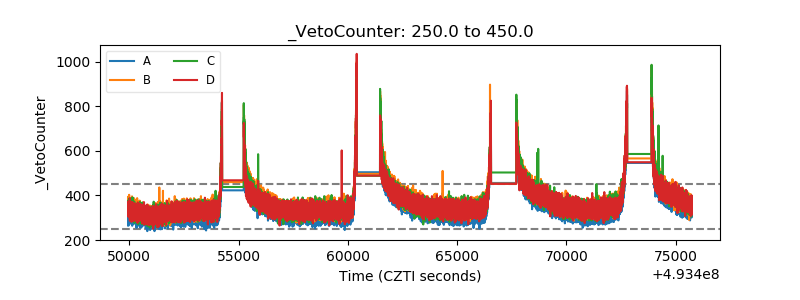 |