| Param | Original file | Final file |
|---|---|---|
| Filename | modeM0/AS1A14_004T05_9000006502_53544cztM0_level2.fits | modeM0/AS1A14_004T05_9000006502_53544cztM0_level2_quad_clean.evt |
| Size (bytes) | 750,133,440 | 81,486,720 |
| Size | 715.4 MB | 77.7 MB |
| Events in quadrant A | 11,110,481 | 270,428 |
| Events in quadrant B | 3,997,080 | 663,615 |
| Events in quadrant C | 7,638,395 | 516,577 |
| Events in quadrant D | 4,527,743 | 572,143 |
| Mode M9 | |||
|---|---|---|---|
| Quadrant | BADHDUFLAG | Total packets | Discarded packets |
| A | 0 | 11 | 0 |
| B | 0 | 11 | 0 |
| C | 0 | 11 | 0 |
| D | 0 | 11 | 0 |
| Mode SS | |||
|---|---|---|---|
| Quadrant | BADHDUFLAG | Total packets | Discarded packets |
| A | 0 | 130 | 0 |
| B | 0 | 130 | 0 |
| C | 0 | 130 | 0 |
| D | 0 | 130 | 0 |
| Mode M0 | |||
|---|---|---|---|
| Quadrant | BADHDUFLAG | Total packets | Discarded packets |
| A | 0 | 37361 | 1 |
| B | 0 | 16262 | 1 |
| C | 0 | 27011 | 3 |
| D | 0 | 17596 | 1 |
| Quadrant | Total seconds | Saturated seconds | Saturation percentage |
|---|---|---|---|
| A | 6366 | 4033 | 63.352183% |
| B | 6367 | 388 | 6.093922% |
| C | 6366 | 1332 | 20.923657% |
| D | 6366 | 282 | 4.429783% |
Noise dominated data is calculated using 1-second bins in cleaned event files. If a bin has >2000 counts, and if more than 50% of those come from <1% of pixels, then it is considered to be noise-dominated and hence unusable.
| Quadrant | # 1 sec bins | Bins with >0 counts | Bins with >2000 counts | High rate bins dominated by noise | Noise dominated (total time) | Noise dominated (detector-on time) | Marked lightcurve |
|---|---|---|---|---|---|---|---|
| A | 7486 | 6366 | 3351 | 3351 | 44.76% | 52.64% | 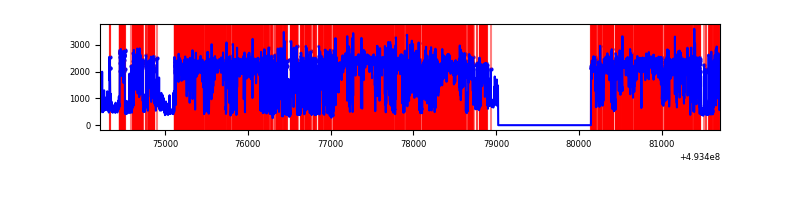 |
| B | 7487 | 6367 | 149 | 149 | 1.99% | 2.34% | 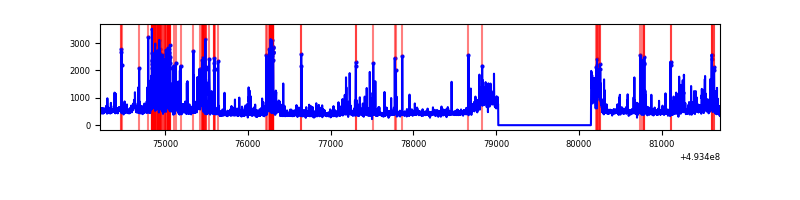 |
| C | 7486 | 6366 | 1271 | 1271 | 16.98% | 19.97% | 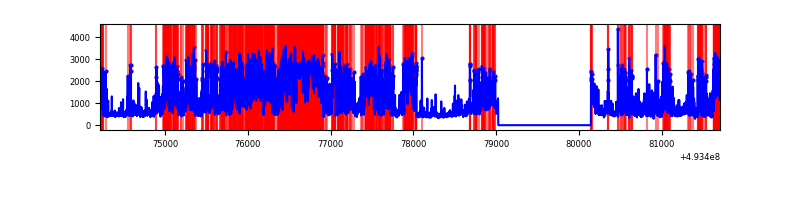 |
| D | 7486 | 6366 | 216 | 216 | 2.89% | 3.39% | 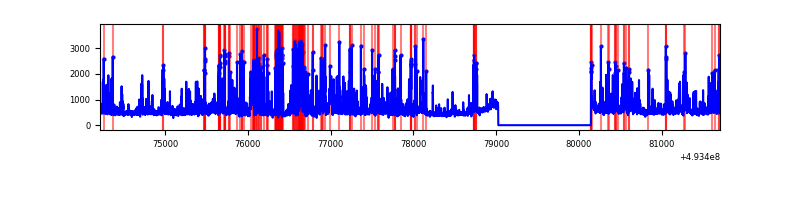 |
Top three noisy pixels from each quadrant. If the there are fewer than three noisy pixels in the level2.evt file, extra rows are filled as -1
| Pixel properties | Quadrant properties | ||||||
|---|---|---|---|---|---|---|---|
| Quadrant | DetID | PixID | Counts | Sigma | Mean | Median | Sigma |
| A | 3 | 63 | 8787866 | 75389.42 | 466 | 454 | 116.6 |
| A | 15 | 174 | 306674 | 2627.14 | 466 | 454 | 116.6 |
| A | 3 | 62 | 128854 | 1101.58 | 466 | 454 | 116.6 |
| B | 5 | 185 | 418030 | 2853.05 | 693 | 670 | 146.3 |
| B | 8 | 128 | 239086 | 1629.8 | 693 | 670 | 146.3 |
| B | 8 | 234 | 125263 | 851.71 | 693 | 670 | 146.3 |
| C | 4 | 5 | 2252573 | 12665.59 | 646 | 643 | 177.8 |
| C | 15 | 224 | 1847236 | 10385.85 | 646 | 643 | 177.8 |
| C | 1 | 241 | 302704 | 1698.89 | 646 | 643 | 177.8 |
| D | 13 | 153 | 578658 | 2916.62 | 692 | 661 | 198.2 |
| D | 2 | 120 | 247994 | 1248.06 | 692 | 661 | 198.2 |
| D | 2 | 153 | 204616 | 1029.17 | 692 | 661 | 198.2 |
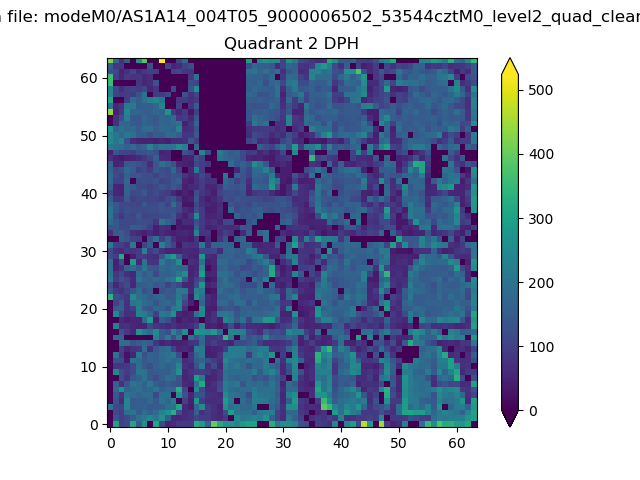
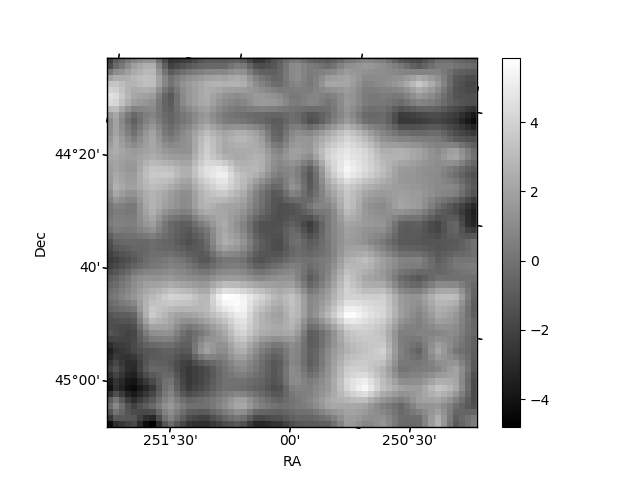
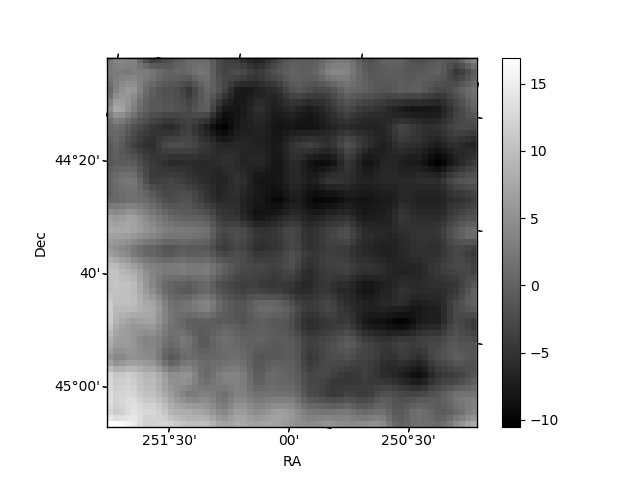
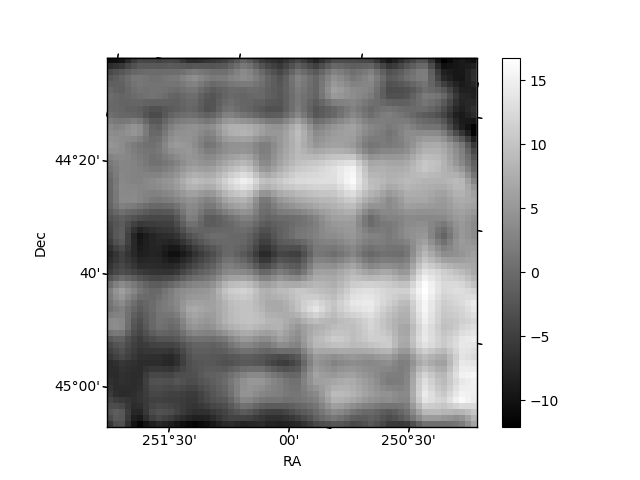
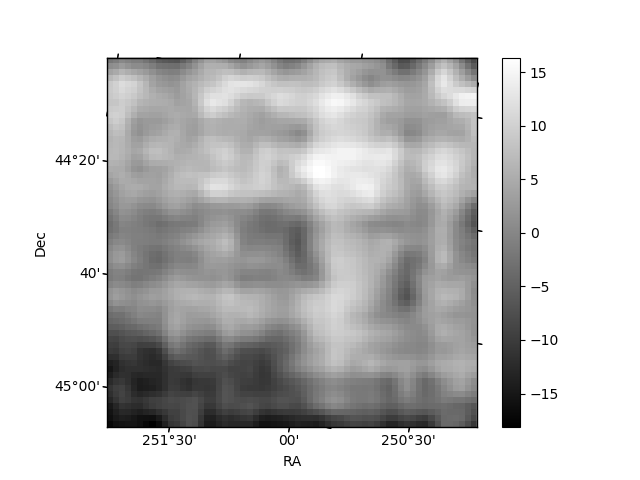
Histogram calculated using DETX and DETY for each event in the final _common_clean file
| Quadrant A | 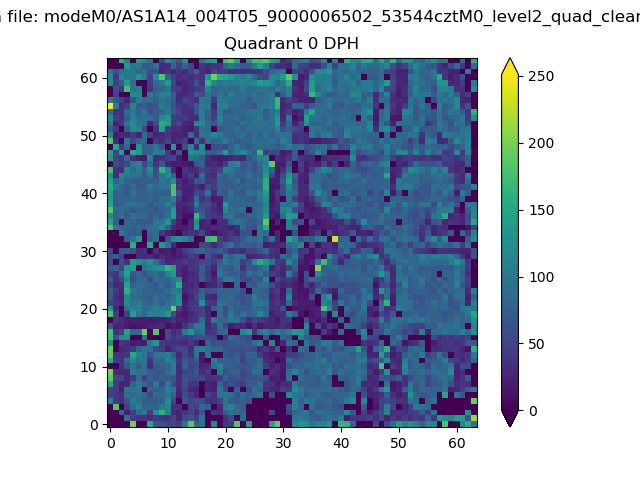 |
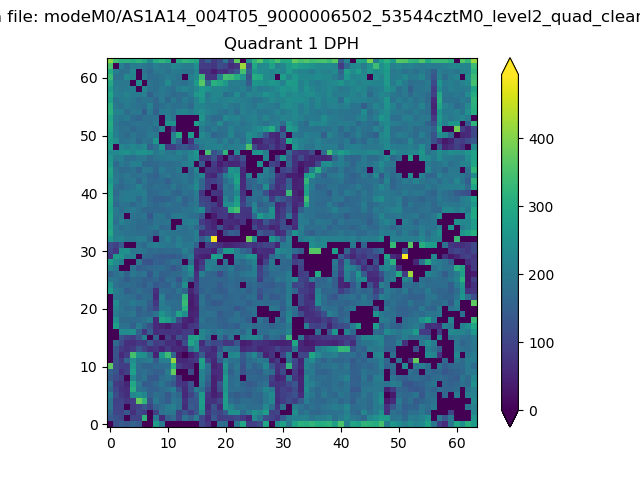 |
Quadrant B |
|---|---|---|---|
| Quadrant D | 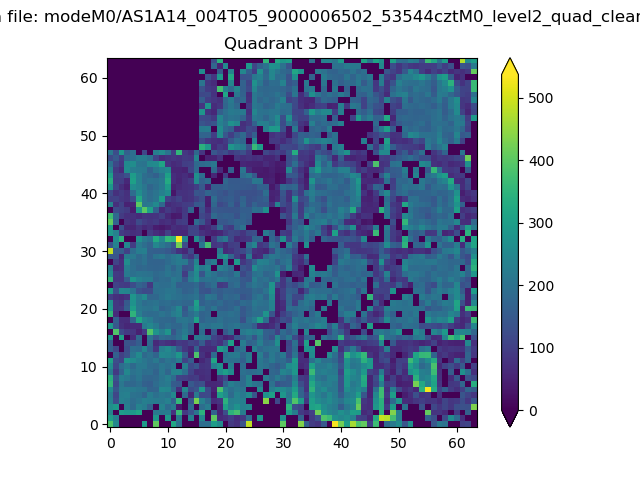 |
 |
Quadrant C |
| Plot type | Count rate plots | Images |
|---|---|---|
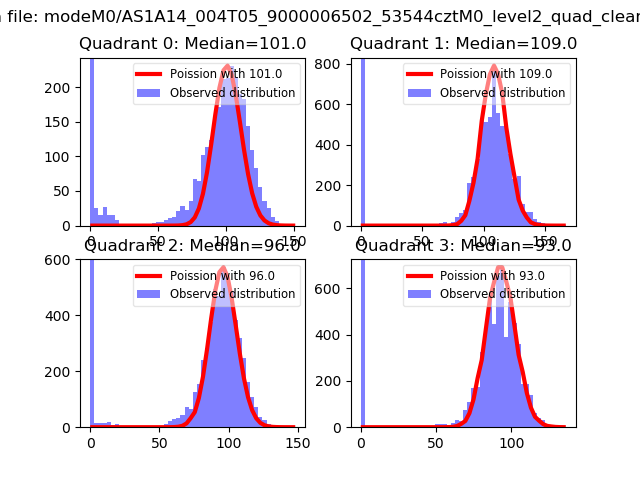
| Comparison with Poisson distribution Blue bars denote a histogram of data divided into 1 sec bins. Red curve is a Poisson curve with rate = median count rate of data. |
 |
 |
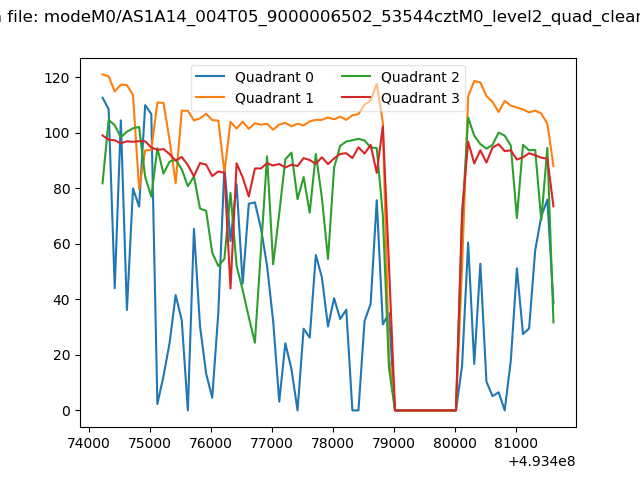
| Quadrant-wise count rates Data is divided into 100 sec bins |
 |
|
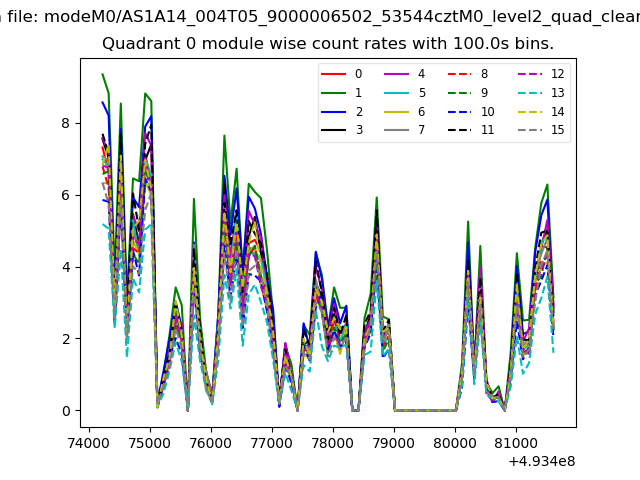
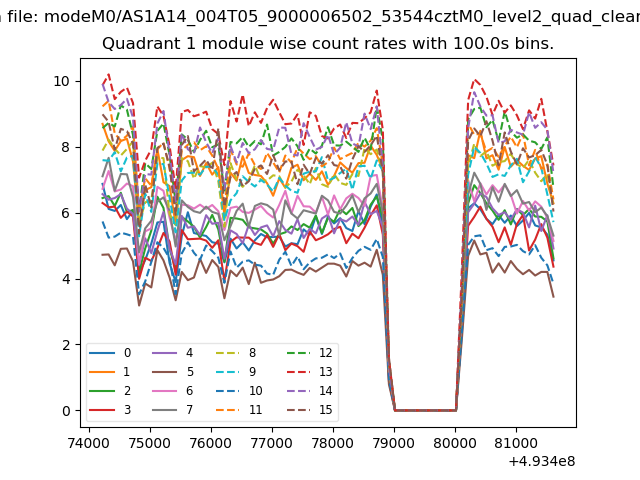
| Module-wise count rates for Quadrant A Data is divided into 100 sec bins |
 |
 |
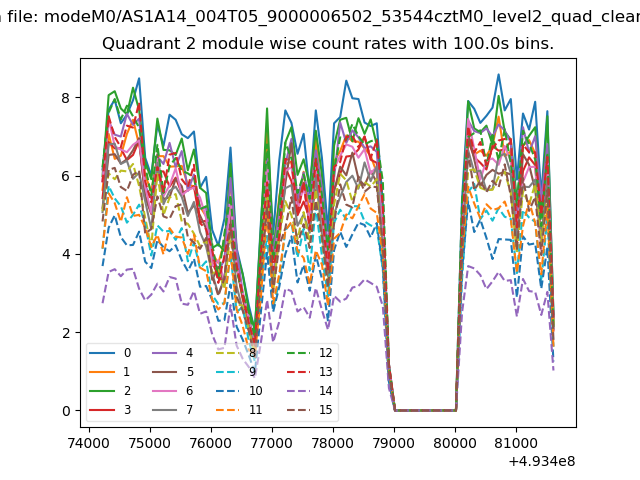
| Module-wise count rates for Quadrant B Data is divided into 100 sec bins |
 |
 |
| Module-wise count rates for Quadrant C Data is divided into 100 sec bins |
 |
 |
| Module-wise count rates for Quadrant D Data is divided into 100 sec bins |
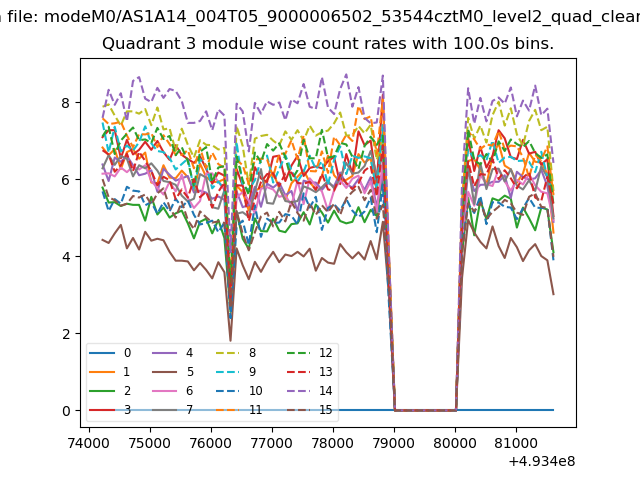 |
 |
| Parameter | Plot |
|---|---|
| CZT HV Monitor | 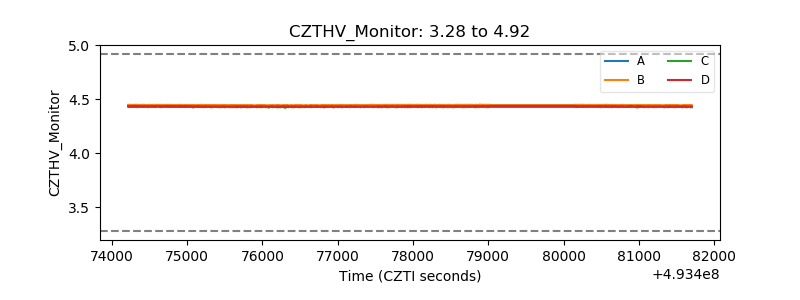 |
| D_VDD | 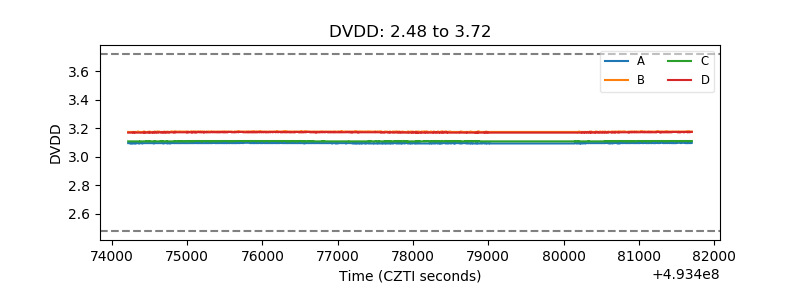 |
| Temperature 1 | 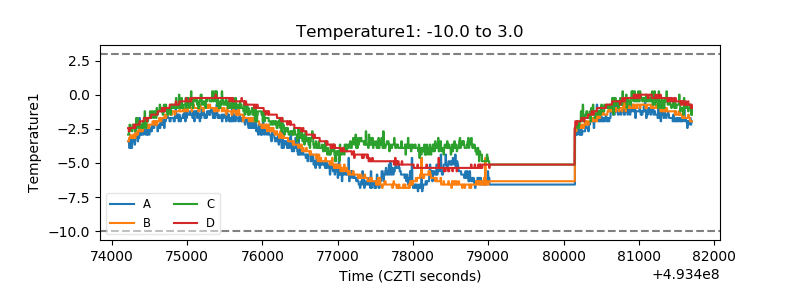 |
| Veto HV Monitor | 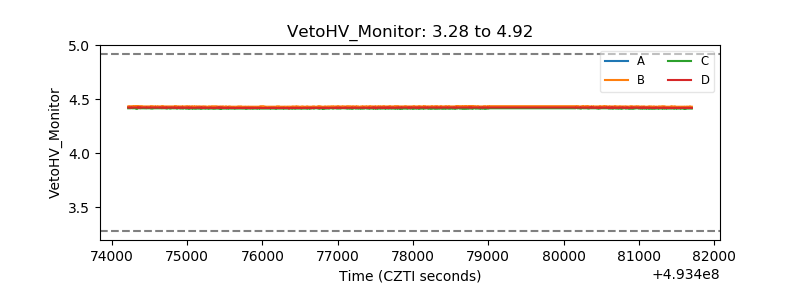 |
| Veto LLD | 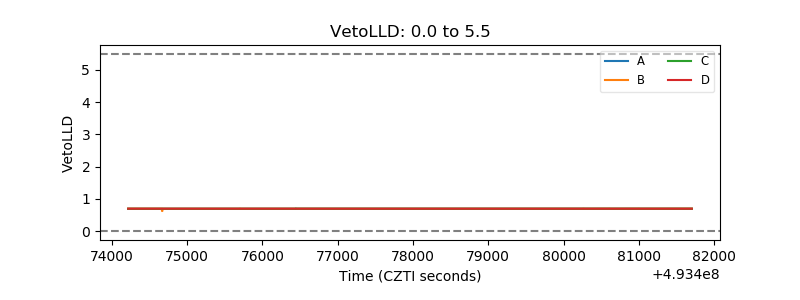 |
| Alpha Counter | 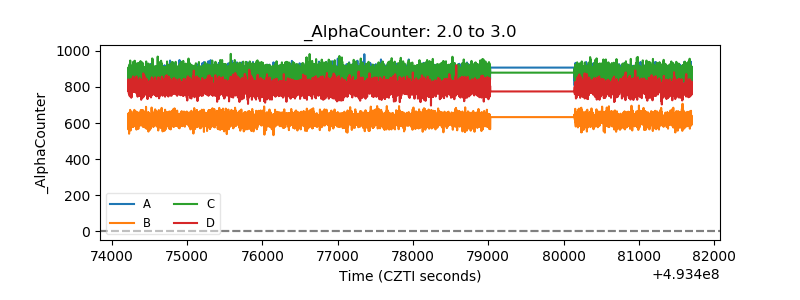 |
| _CPM_Rate | 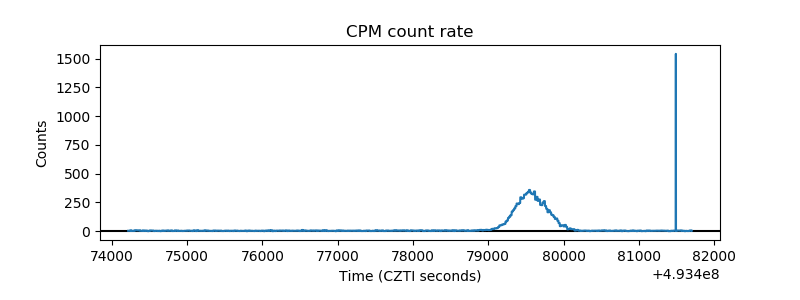 |
| CZT Counter | 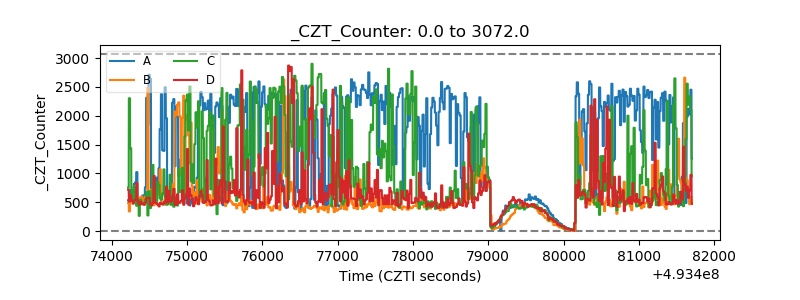 |
| +2.5 Volts monitor | 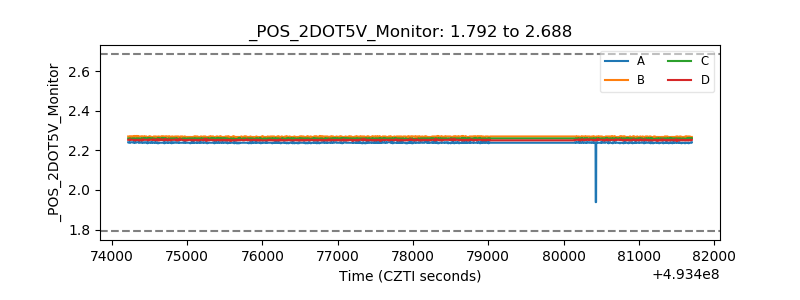 |
| +5 Volts monitor | 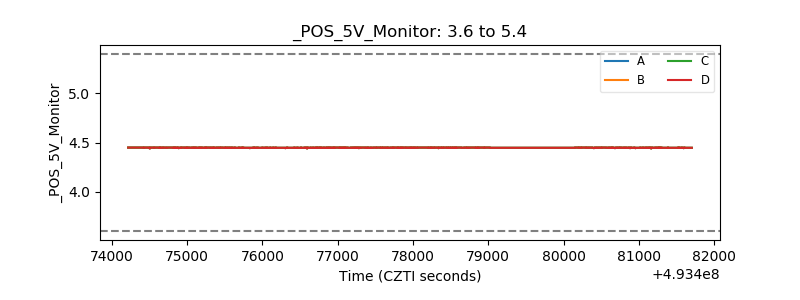 |
| _ROLL_ROT | 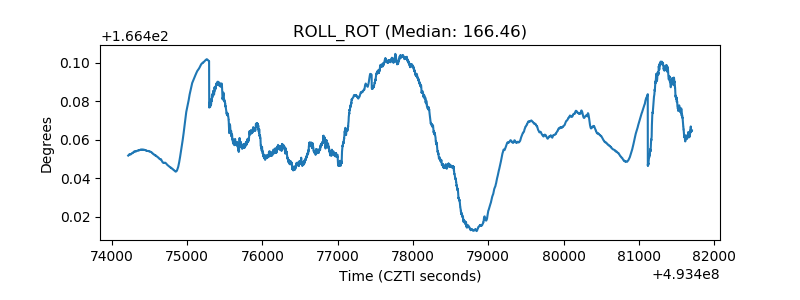 |
| _Roll_DEC | 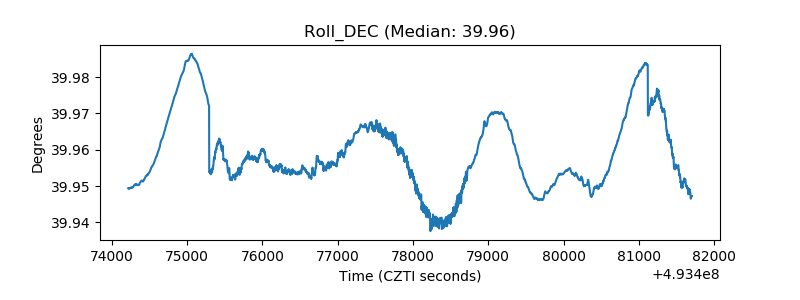 |
| _Roll_RA | 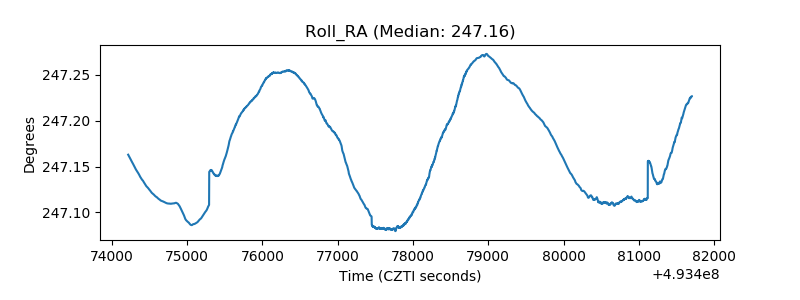 |
| Veto Counter | 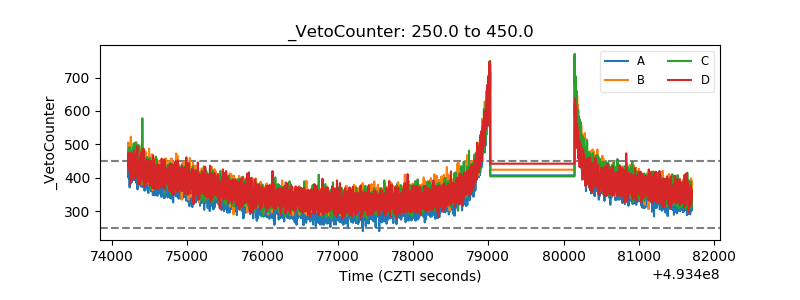 |