| Param | Original file | Final file |
|---|---|---|
| Filename | modeM0/AS1A14_004T05_9000006502_53545cztM0_level2.fits | modeM0/AS1A14_004T05_9000006502_53545cztM0_level2_quad_clean.evt |
| Size (bytes) | 687,242,880 | 85,887,360 |
| Size | 655.4 MB | 81.9 MB |
| Events in quadrant A | 8,607,915 | 446,633 |
| Events in quadrant B | 3,846,541 | 657,780 |
| Events in quadrant C | 7,434,251 | 499,911 |
| Events in quadrant D | 5,047,645 | 543,426 |
| Mode M9 | |||
|---|---|---|---|
| Quadrant | BADHDUFLAG | Total packets | Discarded packets |
| A | 0 | 9 | 0 |
| B | 0 | 9 | 0 |
| C | 0 | 9 | 0 |
| D | 0 | 9 | 0 |
| Mode SS | |||
|---|---|---|---|
| Quadrant | BADHDUFLAG | Total packets | Discarded packets |
| A | 0 | 132 | 0 |
| B | 0 | 132 | 0 |
| C | 0 | 132 | 0 |
| D | 0 | 132 | 0 |
| Mode M0 | |||
|---|---|---|---|
| Quadrant | BADHDUFLAG | Total packets | Discarded packets |
| A | 0 | 30074 | 1 |
| B | 0 | 15973 | 1 |
| C | 0 | 26550 | 1 |
| D | 0 | 19412 | 1 |
| Quadrant | Total seconds | Saturated seconds | Saturation percentage |
|---|---|---|---|
| A | 6487 | 2240 | 34.530600% |
| B | 6487 | 286 | 4.408818% |
| C | 6487 | 1360 | 20.965007% |
| D | 6488 | 536 | 8.261406% |
Noise dominated data is calculated using 1-second bins in cleaned event files. If a bin has >2000 counts, and if more than 50% of those come from <1% of pixels, then it is considered to be noise-dominated and hence unusable.
| Quadrant | # 1 sec bins | Bins with >0 counts | Bins with >2000 counts | High rate bins dominated by noise | Noise dominated (total time) | Noise dominated (detector-on time) | Marked lightcurve |
|---|---|---|---|---|---|---|---|
| A | 7416 | 6486 | 1890 | 1890 | 25.49% | 29.14% | 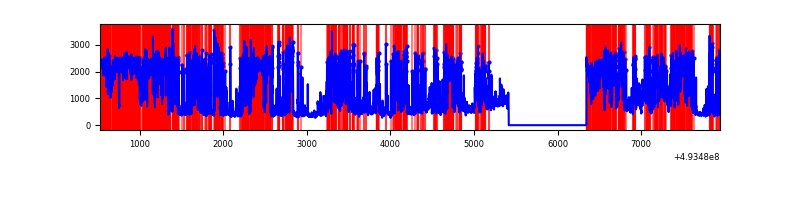 |
| B | 7417 | 6487 | 180 | 180 | 2.43% | 2.77% | 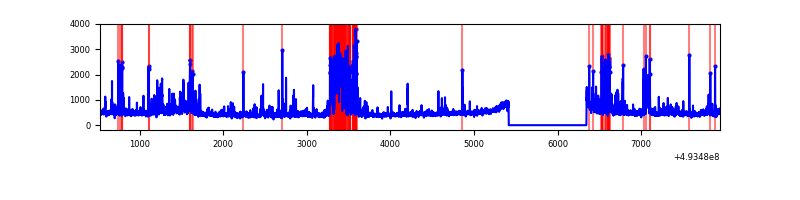 |
| C | 7417 | 6487 | 1241 | 1241 | 16.73% | 19.13% | 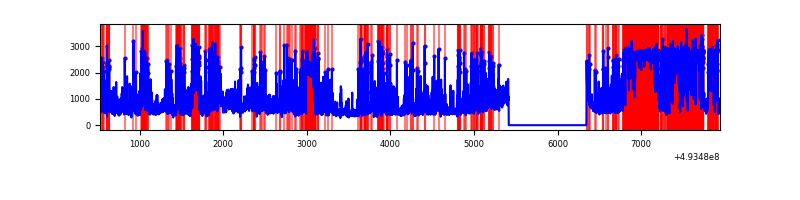 |
| D | 7418 | 6488 | 477 | 477 | 6.43% | 7.35% | 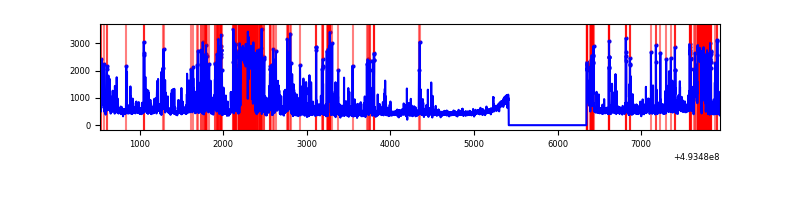 |
Top three noisy pixels from each quadrant. If the there are fewer than three noisy pixels in the level2.evt file, extra rows are filled as -1
| Pixel properties | Quadrant properties | ||||||
|---|---|---|---|---|---|---|---|
| Quadrant | DetID | PixID | Counts | Sigma | Mean | Median | Sigma |
| A | 3 | 63 | 5203280 | 35474.17 | 591 | 578 | 146.7 |
| A | 15 | 174 | 575929 | 3922.98 | 591 | 578 | 146.7 |
| A | 4 | 249 | 237984 | 1618.73 | 591 | 578 | 146.7 |
| B | 5 | 185 | 661372 | 4432.07 | 694 | 671 | 149.1 |
| B | 8 | 128 | 122258 | 815.62 | 694 | 671 | 149.1 |
| B | 10 | 28 | 51001 | 337.62 | 694 | 671 | 149.1 |
| C | 15 | 224 | 2063748 | 11838.38 | 626 | 621 | 174.3 |
| C | 1 | 241 | 2025310 | 11617.82 | 626 | 621 | 174.3 |
| C | 15 | 198 | 257297 | 1472.83 | 626 | 621 | 174.3 |
| D | 13 | 153 | 1094883 | 5688.39 | 673 | 644 | 192.4 |
| D | 2 | 153 | 310853 | 1612.62 | 673 | 644 | 192.4 |
| D | 2 | 120 | 139327 | 720.94 | 673 | 644 | 192.4 |
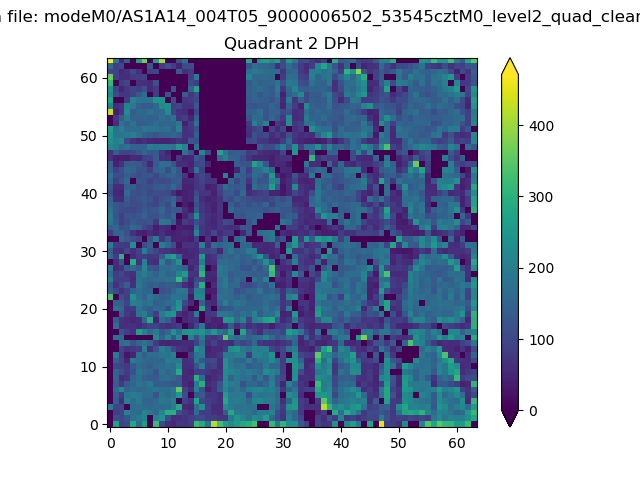
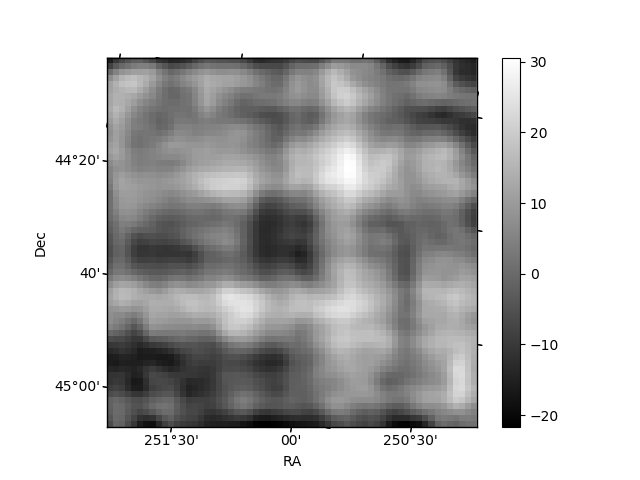
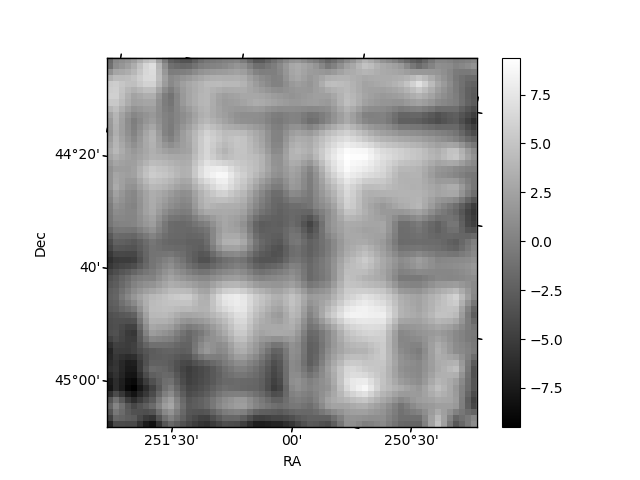
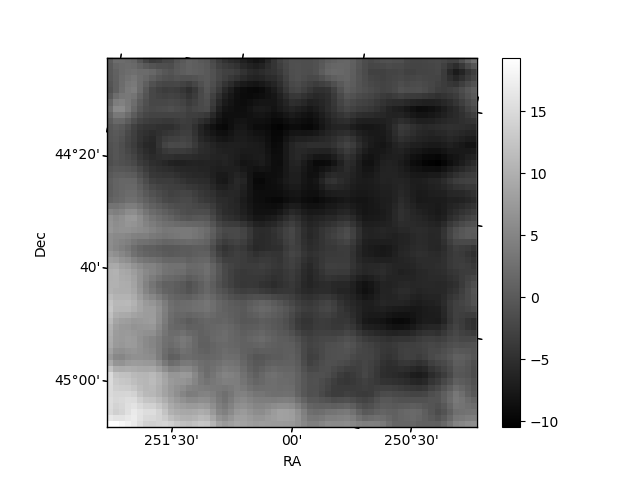
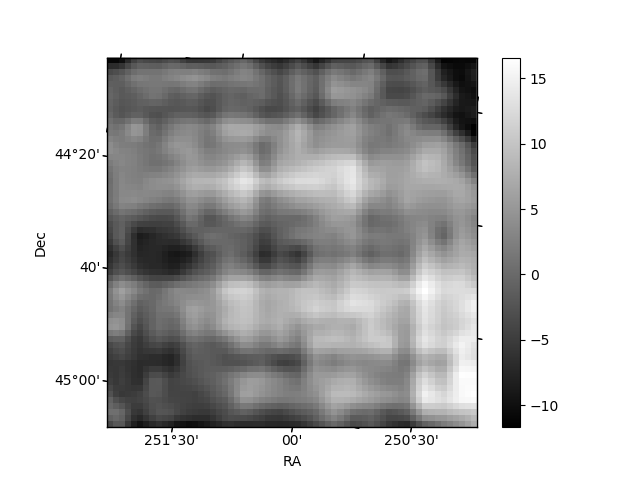
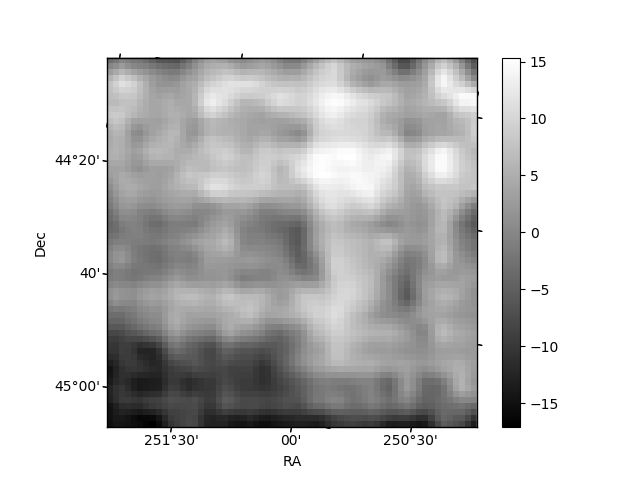
Histogram calculated using DETX and DETY for each event in the final _common_clean file
| Quadrant A | 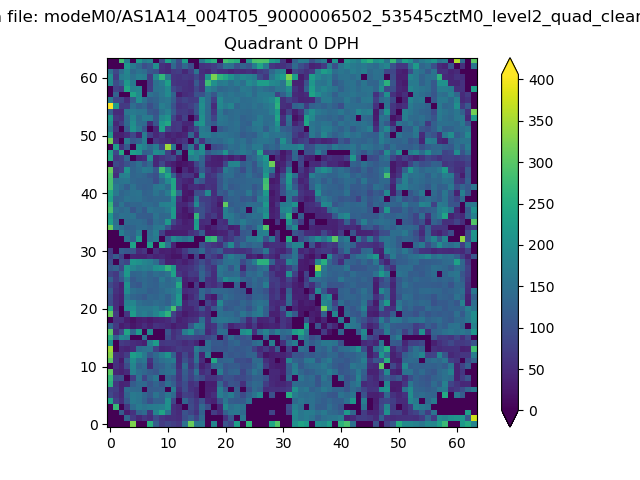 |
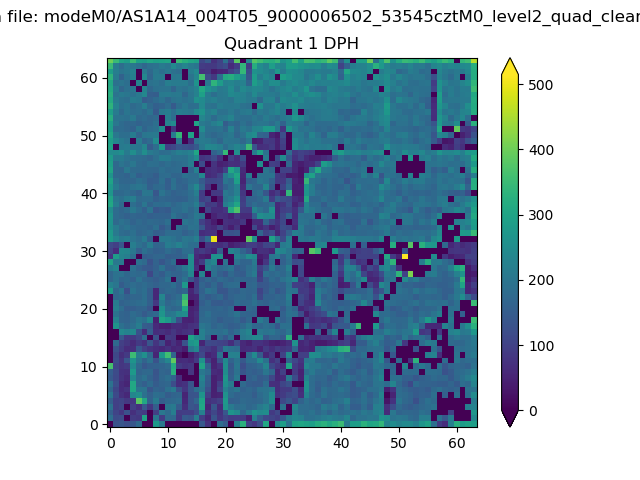 |
Quadrant B |
|---|---|---|---|
| Quadrant D | 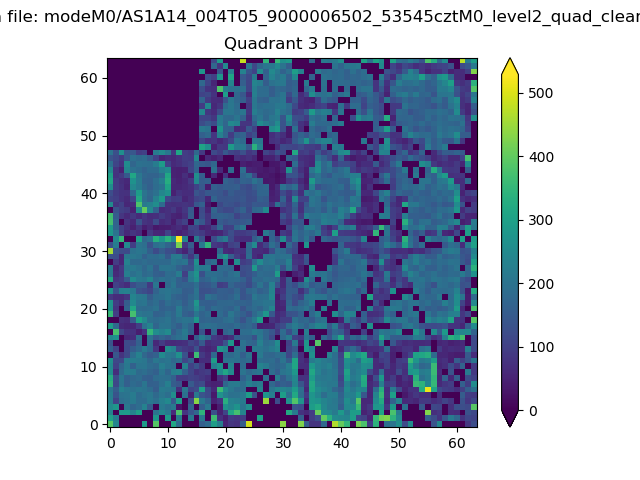 |
 |
Quadrant C |
| Plot type | Count rate plots | Images |
|---|---|---|
| Comparison with Poisson distribution Blue bars denote a histogram of data divided into 1 sec bins. Red curve is a Poisson curve with rate = median count rate of data. |
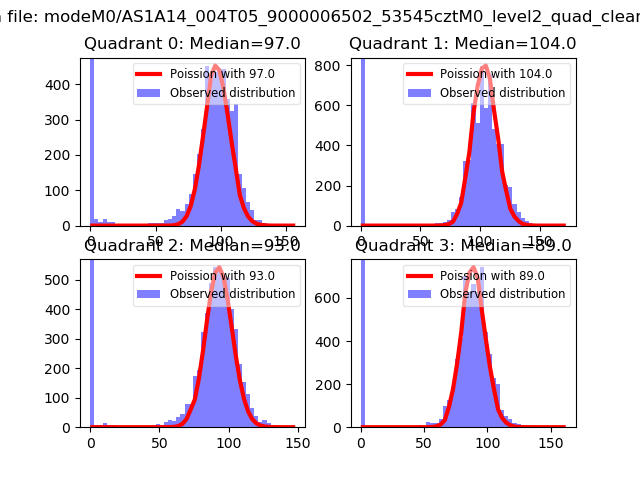 |
 |
| Quadrant-wise count rates Data is divided into 100 sec bins |
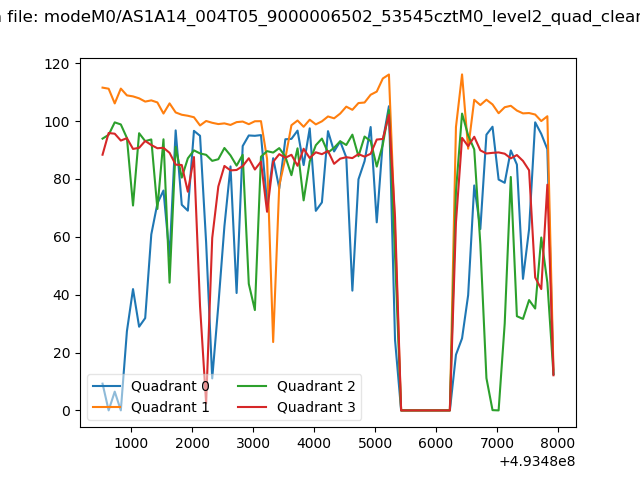 |
|
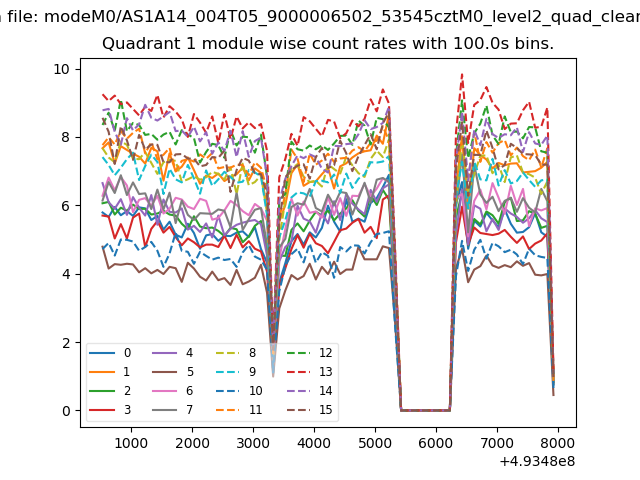
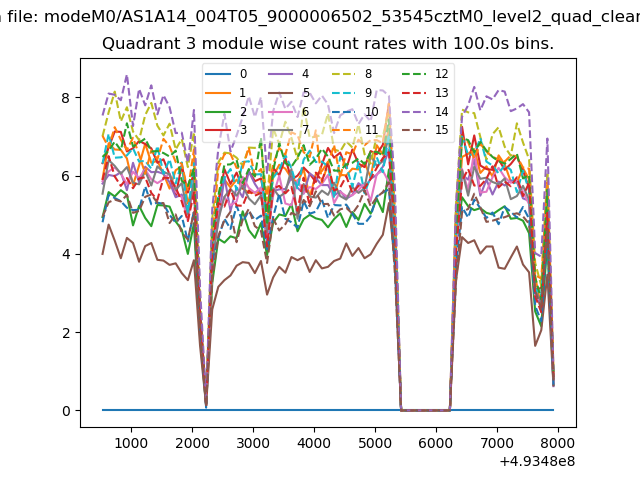
| Module-wise count rates for Quadrant A Data is divided into 100 sec bins |
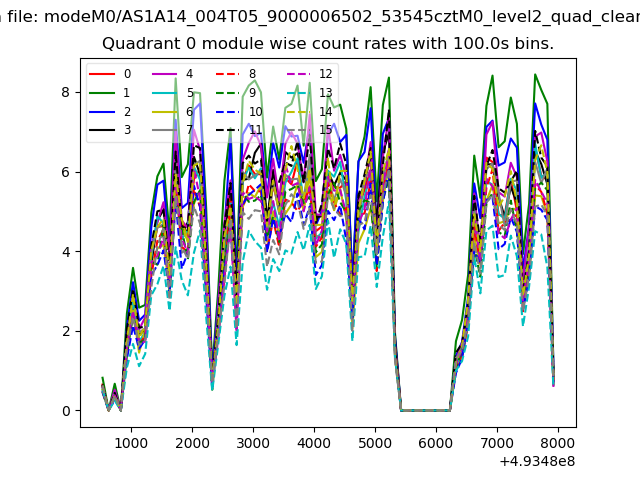 |
 |
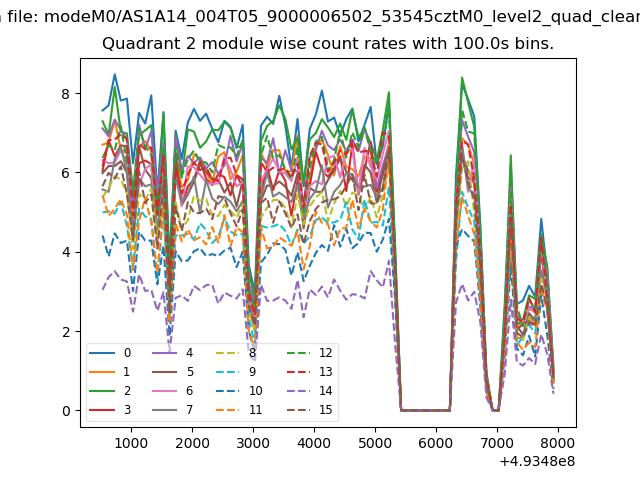
| Module-wise count rates for Quadrant B Data is divided into 100 sec bins |
 |
 |
| Module-wise count rates for Quadrant C Data is divided into 100 sec bins |
 |
 |
| Module-wise count rates for Quadrant D Data is divided into 100 sec bins |
 |
 |
| Parameter | Plot |
|---|---|
| CZT HV Monitor | 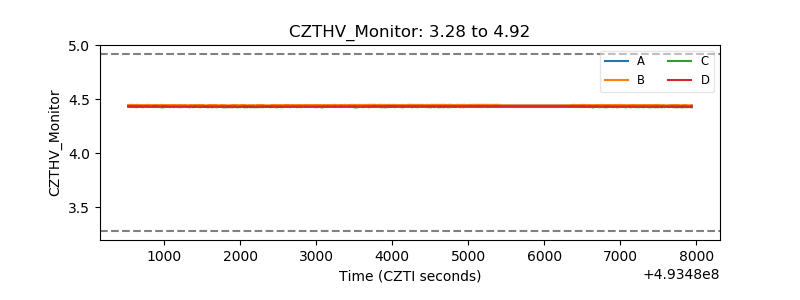 |
| D_VDD | 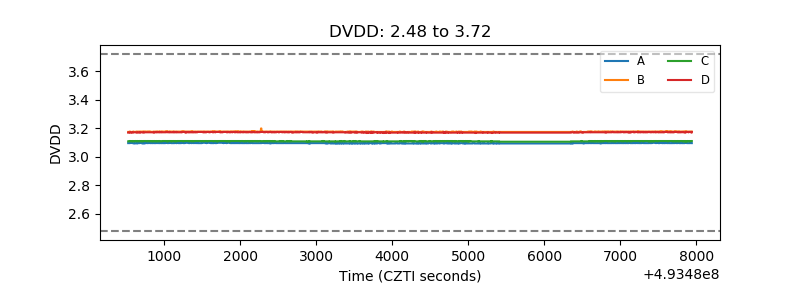 |
| Temperature 1 | 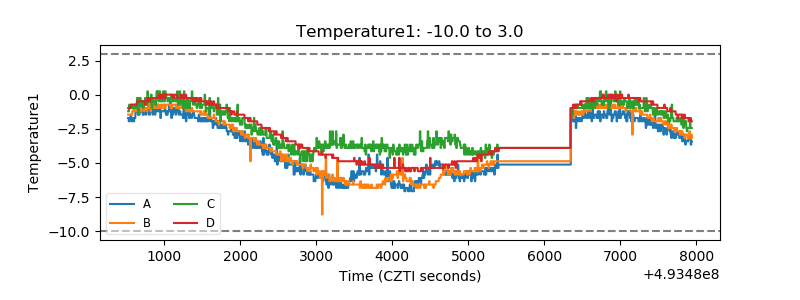 |
| Veto HV Monitor | 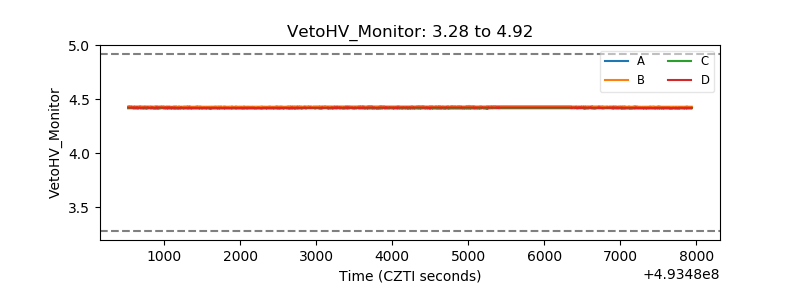 |
| Veto LLD | 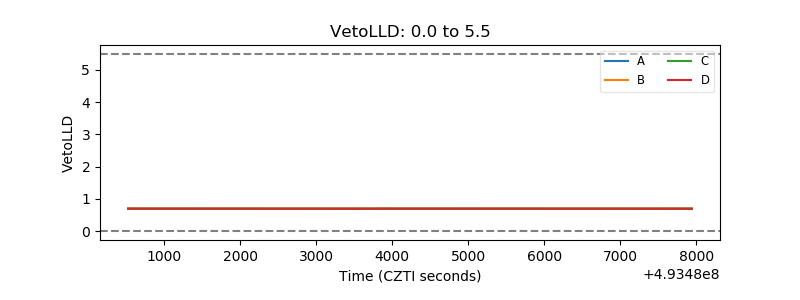 |
| Alpha Counter |  |
| _CPM_Rate | 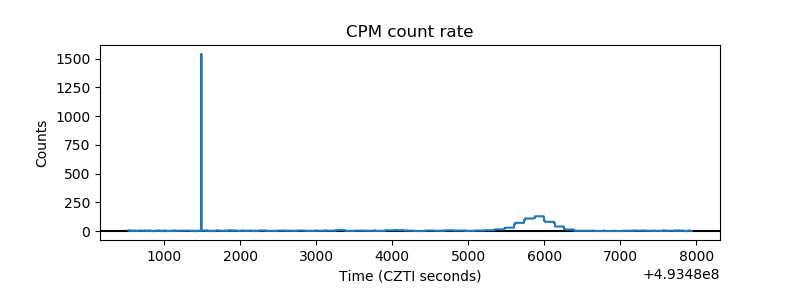 |
| CZT Counter | 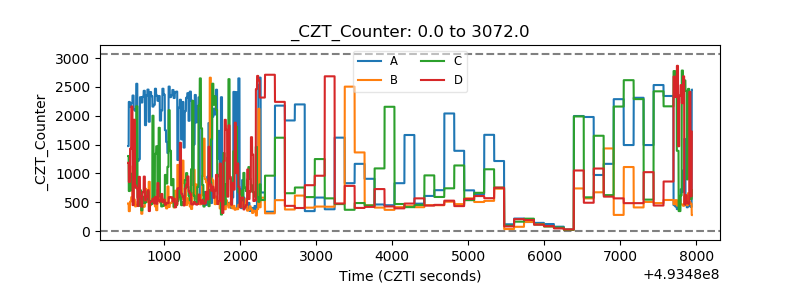 |
| +2.5 Volts monitor | 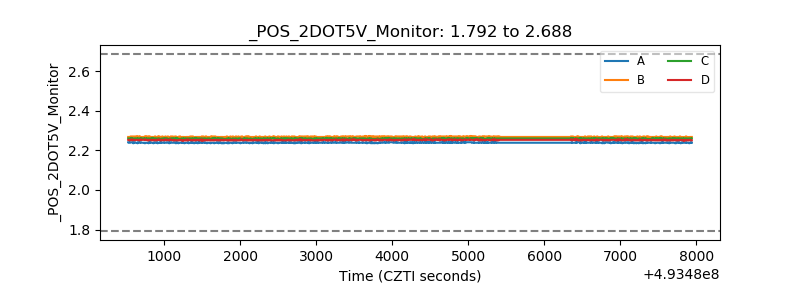 |
| +5 Volts monitor | 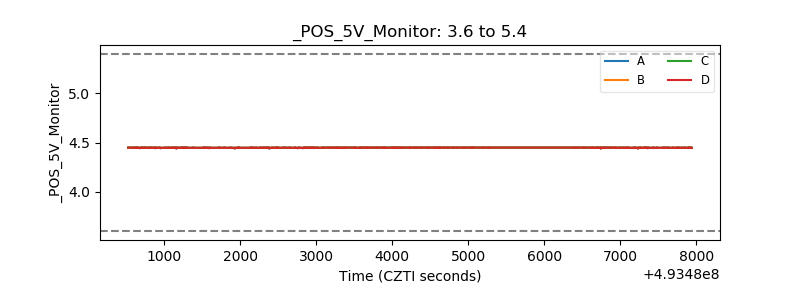 |
| _ROLL_ROT | 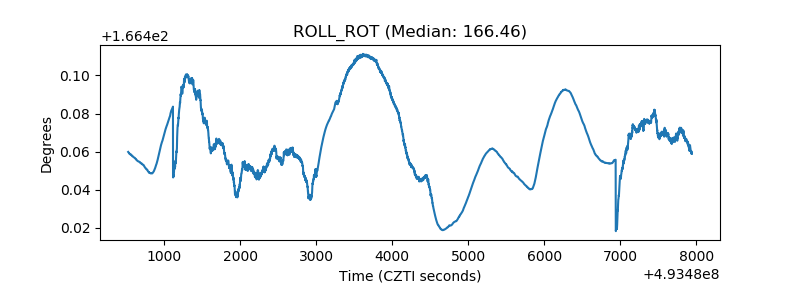 |
| _Roll_DEC | 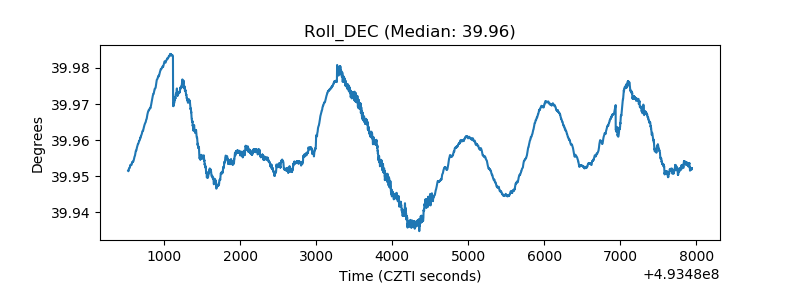 |
| _Roll_RA | 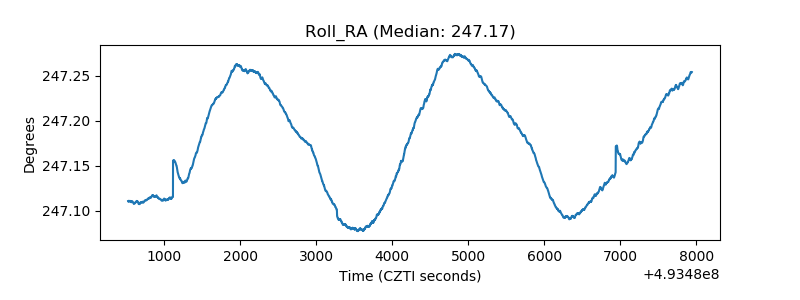 |
| Veto Counter | 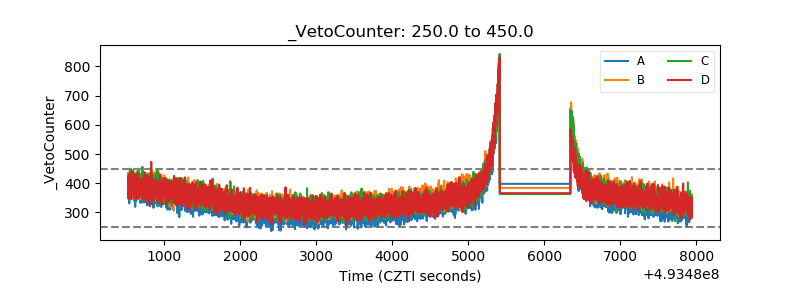 |