| Param | Original file | Final file |
|---|---|---|
| Filename | modeM0/AS1A14_004T05_9000006502_53548cztM0_level2.fits | modeM0/AS1A14_004T05_9000006502_53548cztM0_level2_quad_clean.evt |
| Size (bytes) | 786,957,120 | 101,139,840 |
| Size | 750.5 MB | 96.5 MB |
| Events in quadrant A | 7,592,151 | 614,036 |
| Events in quadrant B | 3,932,340 | 784,362 |
| Events in quadrant C | 10,023,178 | 512,996 |
| Events in quadrant D | 6,984,723 | 613,530 |
| Mode SS | |||
|---|---|---|---|
| Quadrant | BADHDUFLAG | Total packets | Discarded packets |
| A | 0 | 154 | 0 |
| B | 0 | 154 | 0 |
| C | 0 | 154 | 0 |
| D | 0 | 154 | 0 |
| Mode M0 | |||
|---|---|---|---|
| Quadrant | BADHDUFLAG | Total packets | Discarded packets |
| A | 0 | 27968 | 1 |
| B | 0 | 17211 | 0 |
| C | 0 | 35152 | 0 |
| D | 0 | 26114 | 0 |
| Quadrant | Total seconds | Saturated seconds | Saturation percentage |
|---|---|---|---|
| A | 7722 | 1503 | 19.463869% |
| B | 7723 | 45 | 0.582675% |
| C | 7723 | 2258 | 29.237343% |
| D | 7723 | 868 | 11.239156% |
Noise dominated data is calculated using 1-second bins in cleaned event files. If a bin has >2000 counts, and if more than 50% of those come from <1% of pixels, then it is considered to be noise-dominated and hence unusable.
| Quadrant | # 1 sec bins | Bins with >0 counts | Bins with >2000 counts | High rate bins dominated by noise | Noise dominated (total time) | Noise dominated (detector-on time) | Marked lightcurve |
|---|---|---|---|---|---|---|---|
| A | 7722 | 7722 | 1268 | 1268 | 16.42% | 16.42% | 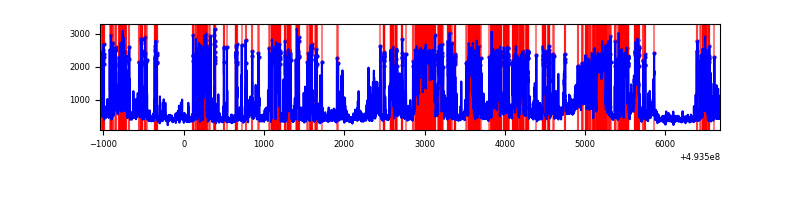 |
| B | 7723 | 7723 | 33 | 33 | 0.43% | 0.43% | 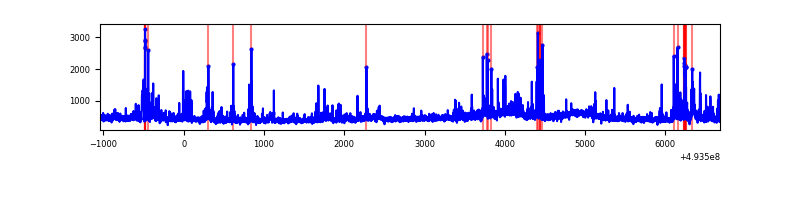 |
| C | 7723 | 7723 | 2070 | 2070 | 26.80% | 26.80% | 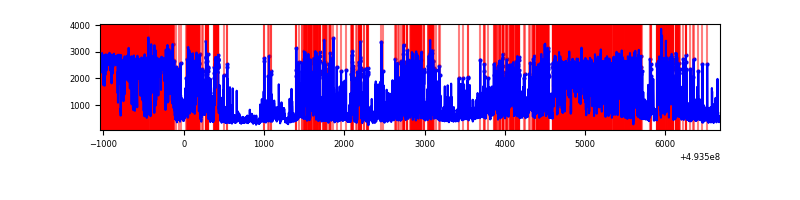 |
| D | 7723 | 7723 | 891 | 891 | 11.54% | 11.54% | 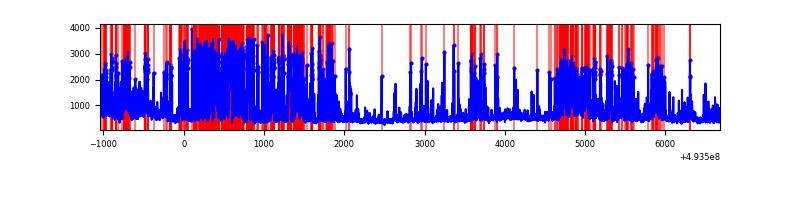 |
Top three noisy pixels from each quadrant. If the there are fewer than three noisy pixels in the level2.evt file, extra rows are filled as -1
| Pixel properties | Quadrant properties | ||||||
|---|---|---|---|---|---|---|---|
| Quadrant | DetID | PixID | Counts | Sigma | Mean | Median | Sigma |
| A | 3 | 63 | 3923983 | 21053.66 | 747 | 730 | 186.3 |
| A | 15 | 174 | 394432 | 2112.75 | 747 | 730 | 186.3 |
| A | 3 | 62 | 173391 | 926.56 | 747 | 730 | 186.3 |
| B | 5 | 185 | 145922 | 838.3 | 814 | 786 | 173.1 |
| B | 0 | 213 | 98157 | 562.41 | 814 | 786 | 173.1 |
| B | 12 | 18 | 86389 | 494.44 | 814 | 786 | 173.1 |
| C | 15 | 224 | 5085120 | 27050.01 | 674 | 669 | 188.0 |
| C | 1 | 241 | 790087 | 4199.82 | 674 | 669 | 188.0 |
| C | 15 | 147 | 506946 | 2693.47 | 674 | 669 | 188.0 |
| D | 15 | 94 | 1847681 | 8370.51 | 769 | 733 | 220.6 |
| D | 13 | 153 | 1107716 | 5016.93 | 769 | 733 | 220.6 |
| D | 7 | 70 | 150945 | 680.77 | 769 | 733 | 220.6 |
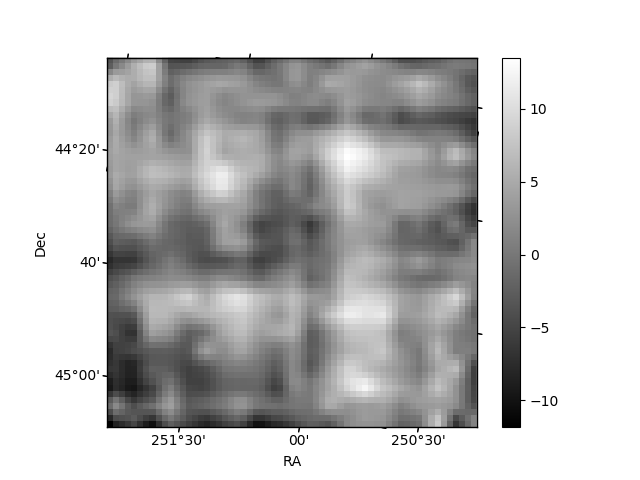
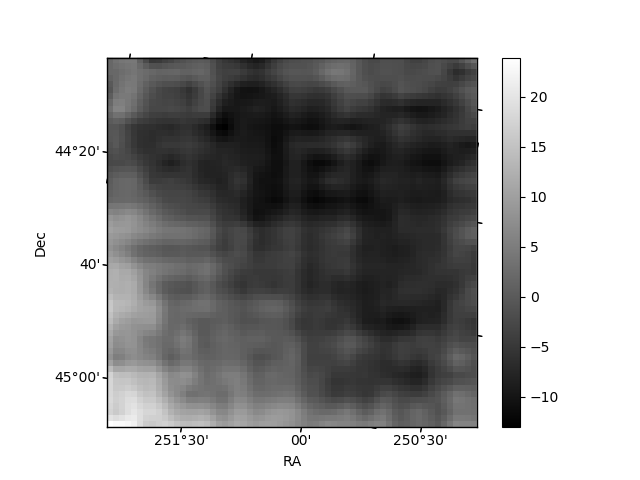
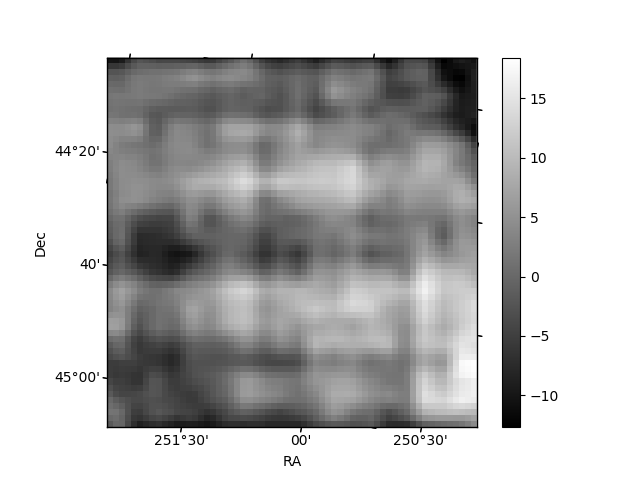
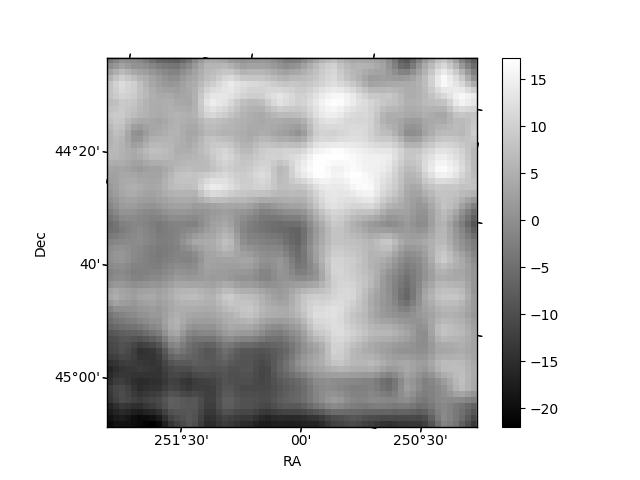
Histogram calculated using DETX and DETY for each event in the final _common_clean file
| Quadrant A | 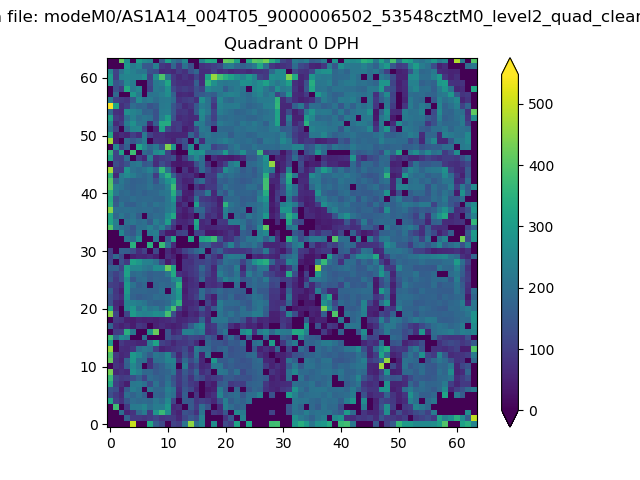 |
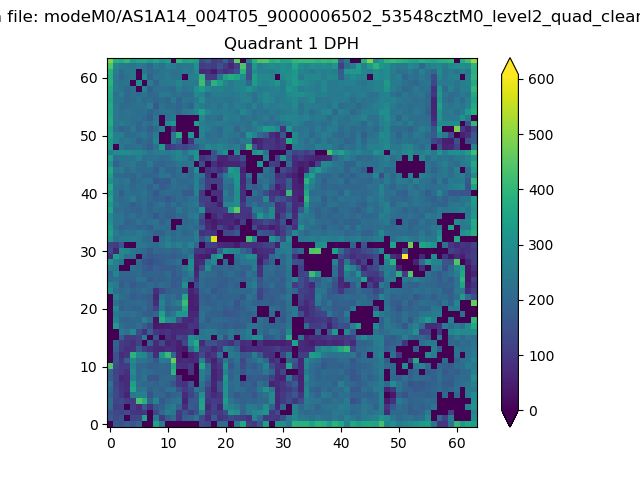 |
Quadrant B |
|---|---|---|---|
| Quadrant D | 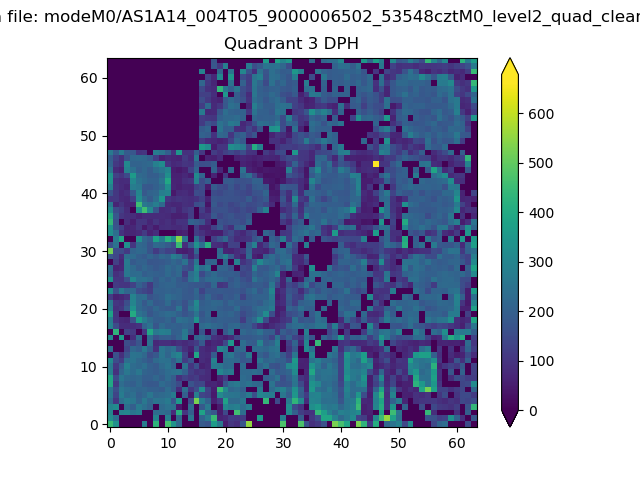 |
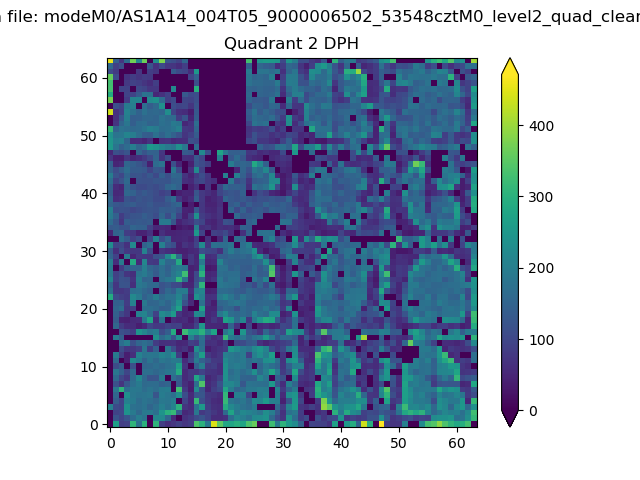 |
Quadrant C |
| Plot type | Count rate plots | Images |
|---|---|---|
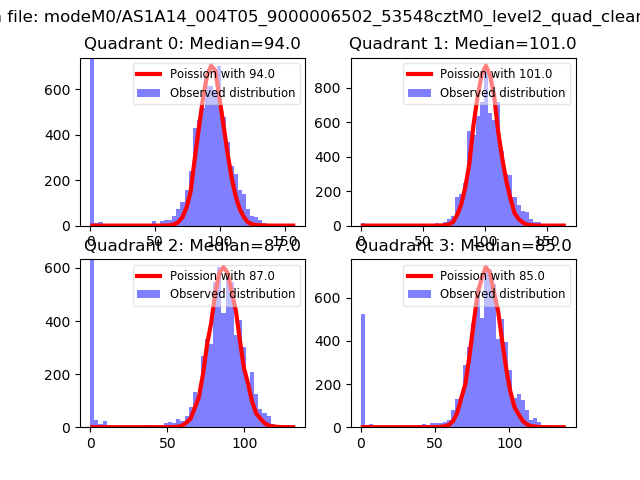
| Comparison with Poisson distribution Blue bars denote a histogram of data divided into 1 sec bins. Red curve is a Poisson curve with rate = median count rate of data. |
 |
 |
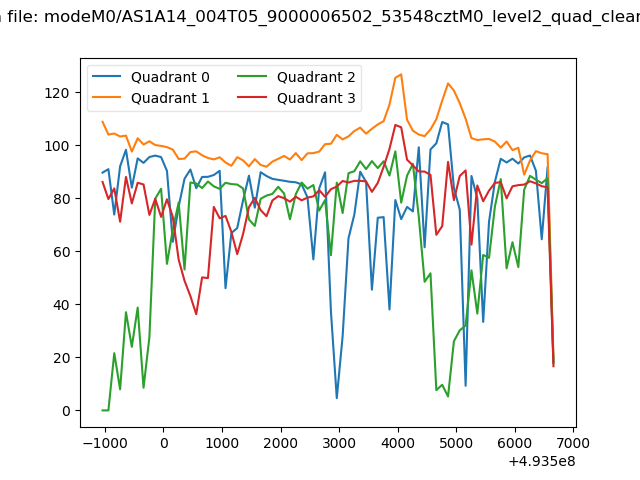
| Quadrant-wise count rates Data is divided into 100 sec bins |
 |
|
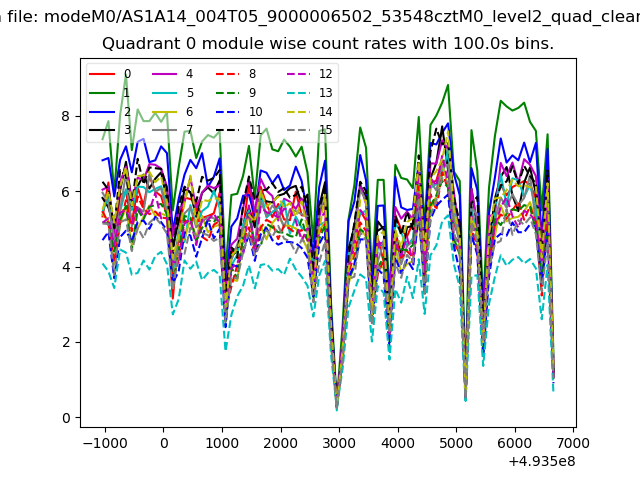
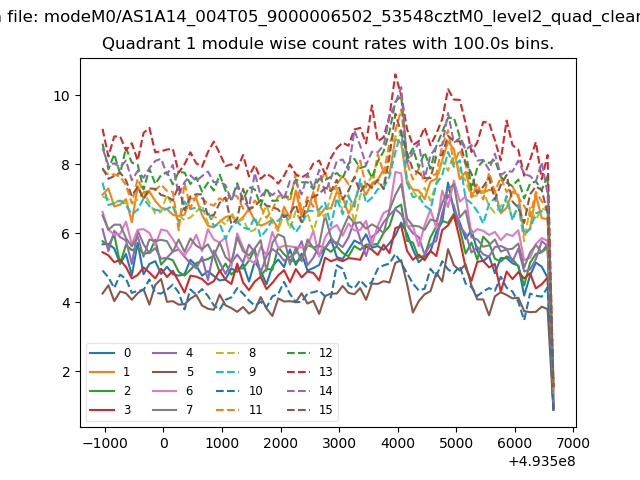
| Module-wise count rates for Quadrant A Data is divided into 100 sec bins |
 |
 |
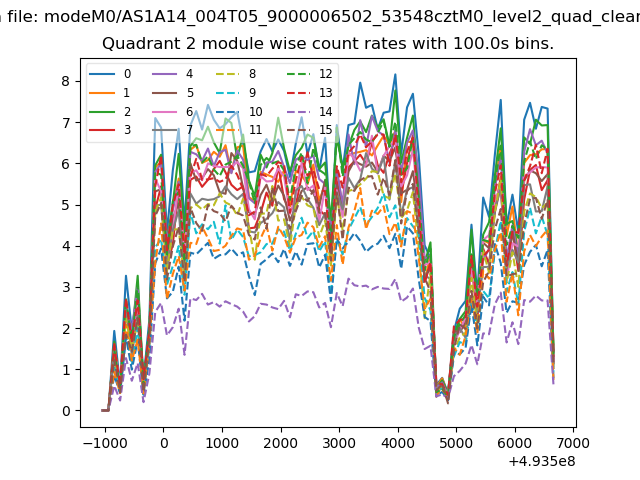
| Module-wise count rates for Quadrant B Data is divided into 100 sec bins |
 |
 |
| Module-wise count rates for Quadrant C Data is divided into 100 sec bins |
 |
 |
| Module-wise count rates for Quadrant D Data is divided into 100 sec bins |
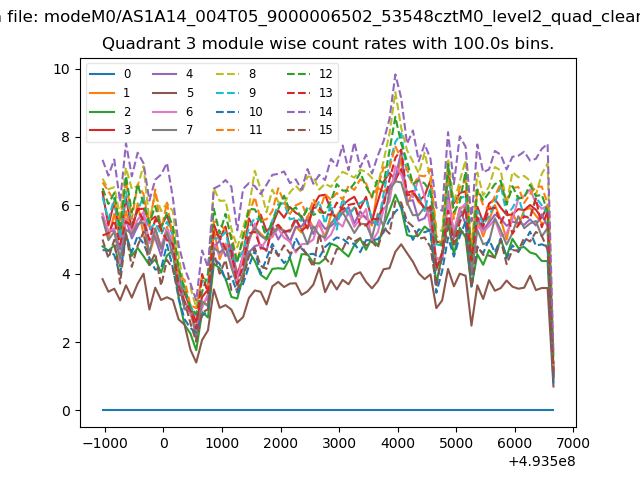 |
 |
| Parameter | Plot |
|---|---|
| CZT HV Monitor | 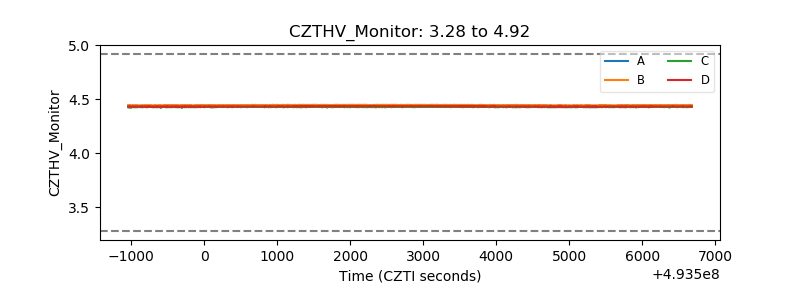 |
| D_VDD | 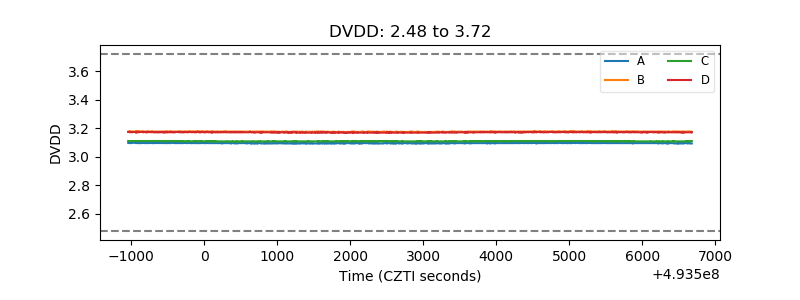 |
| Temperature 1 | 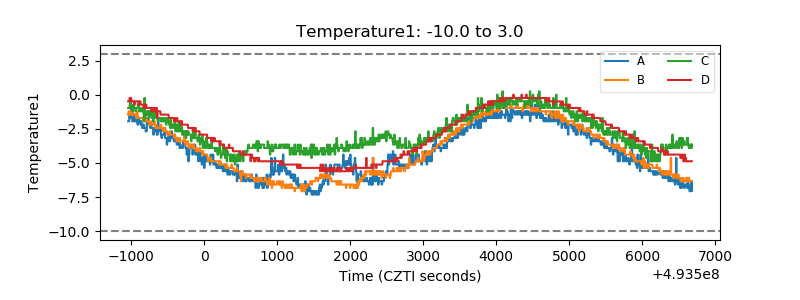 |
| Veto HV Monitor | 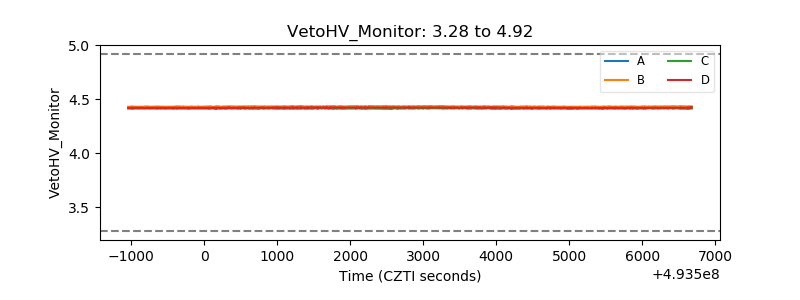 |
| Veto LLD | 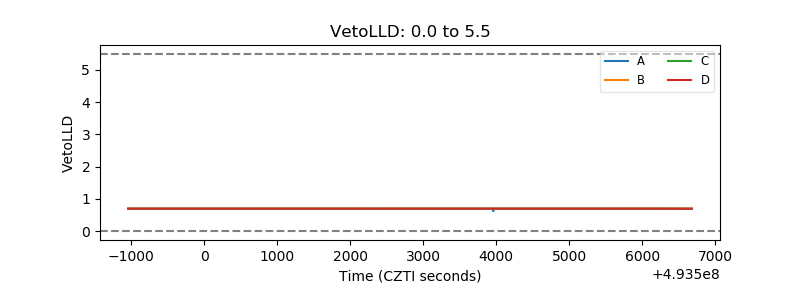 |
| Alpha Counter | 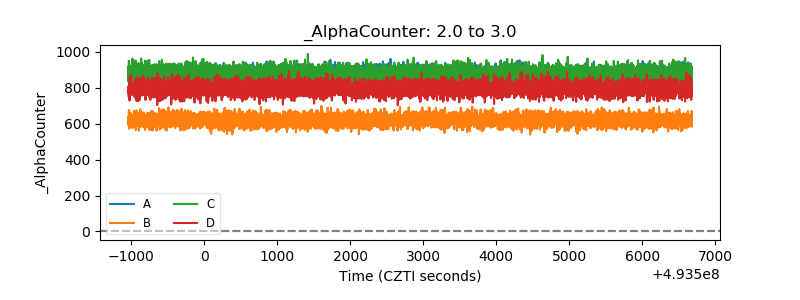 |
| _CPM_Rate | 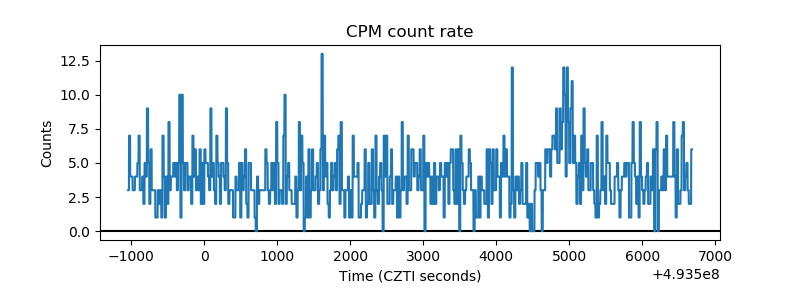 |
| CZT Counter | 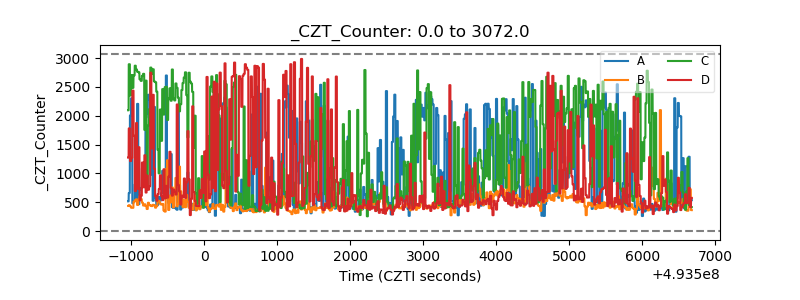 |
| +2.5 Volts monitor |  |
| +5 Volts monitor |  |
| _ROLL_ROT | 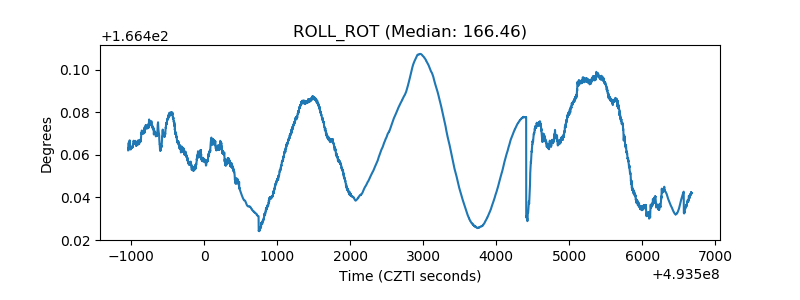 |
| _Roll_DEC | 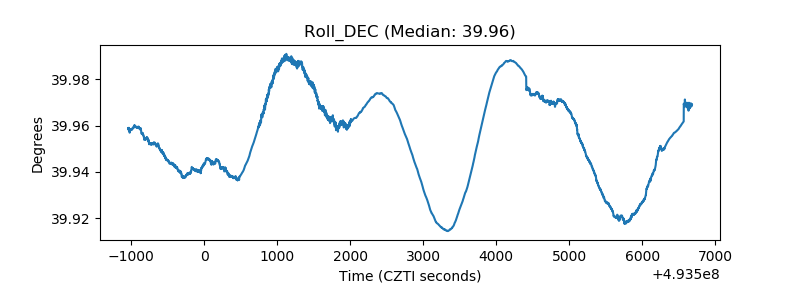 |
| _Roll_RA | 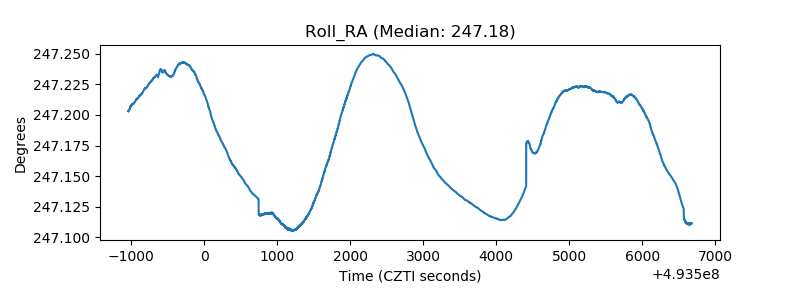 |
| Veto Counter | 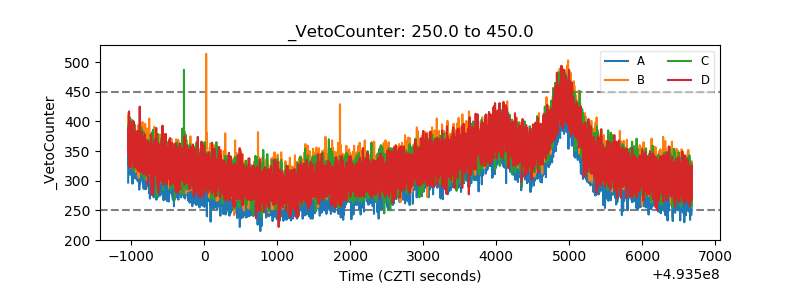 |