| Param | Original file | Final file |
|---|---|---|
| Filename | modeM0/AS1A14_004T05_9000006502_53549cztM0_level2.fits | modeM0/AS1A14_004T05_9000006502_53549cztM0_level2_quad_clean.evt |
| Size (bytes) | 715,832,640 | 106,329,600 |
| Size | 682.7 MB | 101.4 MB |
| Events in quadrant A | 7,676,416 | 640,042 |
| Events in quadrant B | 4,465,288 | 779,204 |
| Events in quadrant C | 8,147,753 | 596,828 |
| Events in quadrant D | 5,602,297 | 658,845 |
| Mode SS | |||
|---|---|---|---|
| Quadrant | BADHDUFLAG | Total packets | Discarded packets |
| A | 0 | 158 | 0 |
| B | 0 | 158 | 0 |
| C | 0 | 158 | 0 |
| D | 0 | 158 | 0 |
| Mode M0 | |||
|---|---|---|---|
| Quadrant | BADHDUFLAG | Total packets | Discarded packets |
| A | 0 | 28213 | 0 |
| B | 0 | 18848 | 0 |
| C | 0 | 29692 | 0 |
| D | 0 | 22163 | 0 |
| Quadrant | Total seconds | Saturated seconds | Saturation percentage |
|---|---|---|---|
| A | 7821 | 1359 | 17.376295% |
| B | 7821 | 261 | 3.337169% |
| C | 7821 | 1454 | 18.590973% |
| D | 7822 | 337 | 4.308361% |
Noise dominated data is calculated using 1-second bins in cleaned event files. If a bin has >2000 counts, and if more than 50% of those come from <1% of pixels, then it is considered to be noise-dominated and hence unusable.
| Quadrant | # 1 sec bins | Bins with >0 counts | Bins with >2000 counts | High rate bins dominated by noise | Noise dominated (total time) | Noise dominated (detector-on time) | Marked lightcurve |
|---|---|---|---|---|---|---|---|
| A | 7821 | 7821 | 1186 | 1186 | 15.16% | 15.16% | 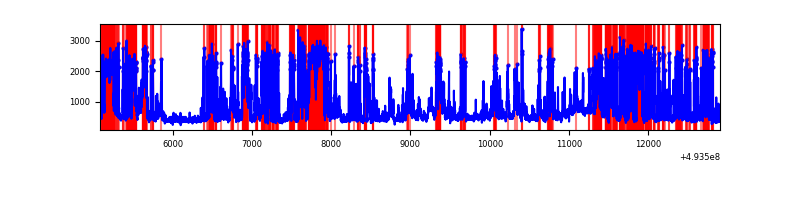 |
| B | 7821 | 7821 | 154 | 154 | 1.97% | 1.97% | 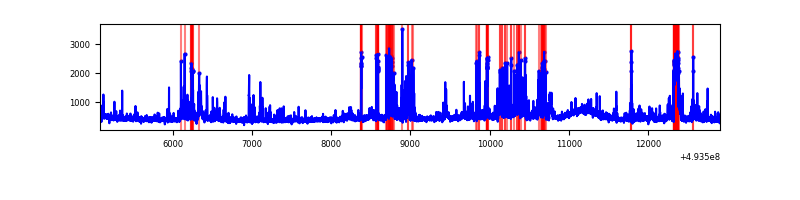 |
| C | 7821 | 7821 | 1250 | 1250 | 15.98% | 15.98% | 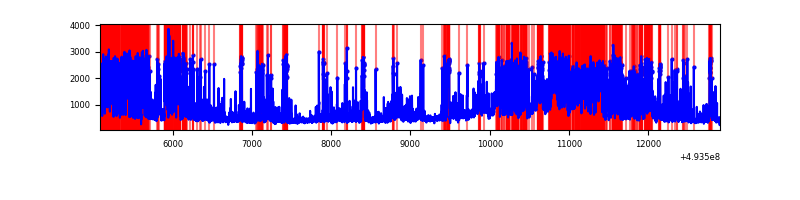 |
| D | 7822 | 7822 | 286 | 286 | 3.66% | 3.66% | 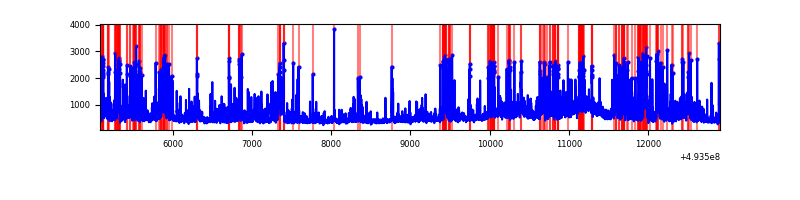 |
Top three noisy pixels from each quadrant. If the there are fewer than three noisy pixels in the level2.evt file, extra rows are filled as -1
| Pixel properties | Quadrant properties | ||||||
|---|---|---|---|---|---|---|---|
| Quadrant | DetID | PixID | Counts | Sigma | Mean | Median | Sigma |
| A | 3 | 63 | 3414385 | 17439.99 | 784 | 764 | 195.7 |
| A | 15 | 174 | 998252 | 5096.11 | 784 | 764 | 195.7 |
| A | 3 | 78 | 55582 | 280.06 | 784 | 764 | 195.7 |
| B | 2 | 249 | 290700 | 1640.73 | 830 | 801 | 176.7 |
| B | 5 | 185 | 167446 | 943.15 | 830 | 801 | 176.7 |
| B | 10 | 254 | 159148 | 896.19 | 830 | 801 | 176.7 |
| C | 15 | 224 | 3739758 | 17885.26 | 755 | 749 | 209.1 |
| C | 12 | 252 | 507709 | 2425.0 | 755 | 749 | 209.1 |
| C | 15 | 147 | 287429 | 1371.31 | 755 | 749 | 209.1 |
| D | 13 | 153 | 658999 | 2821.3 | 814 | 778 | 233.3 |
| D | 6 | 174 | 283187 | 1210.48 | 814 | 778 | 233.3 |
| D | 7 | 96 | 275432 | 1177.24 | 814 | 778 | 233.3 |
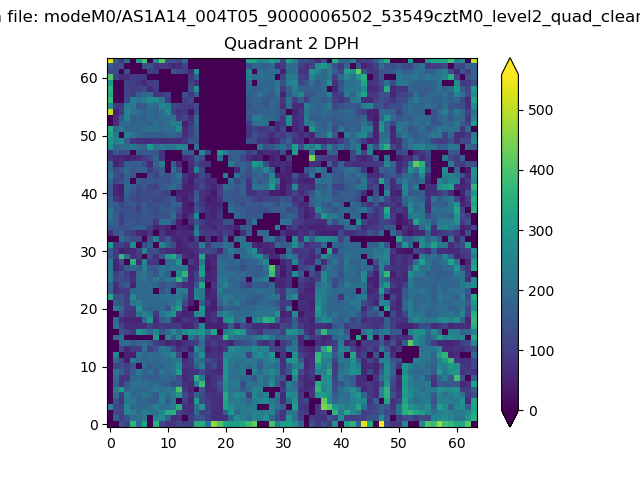
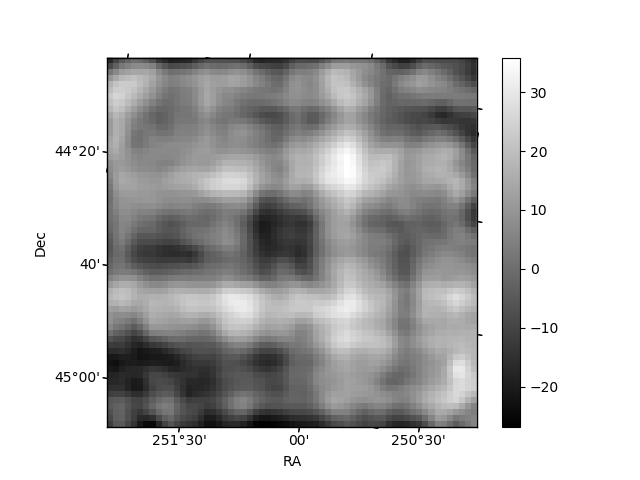
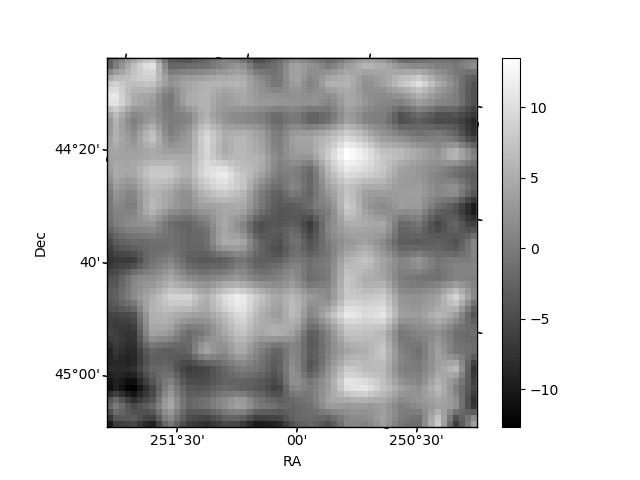
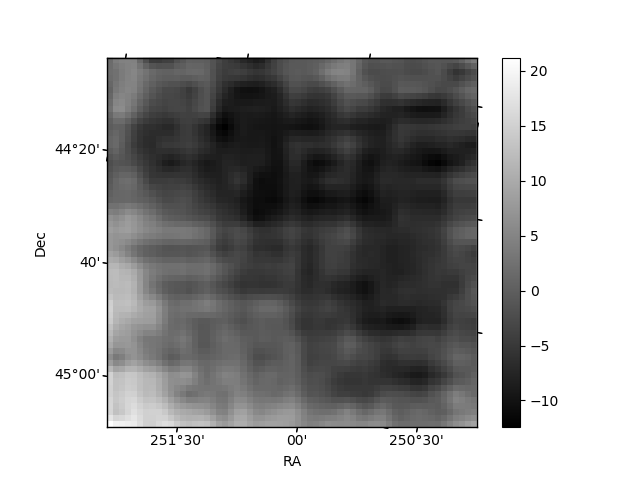
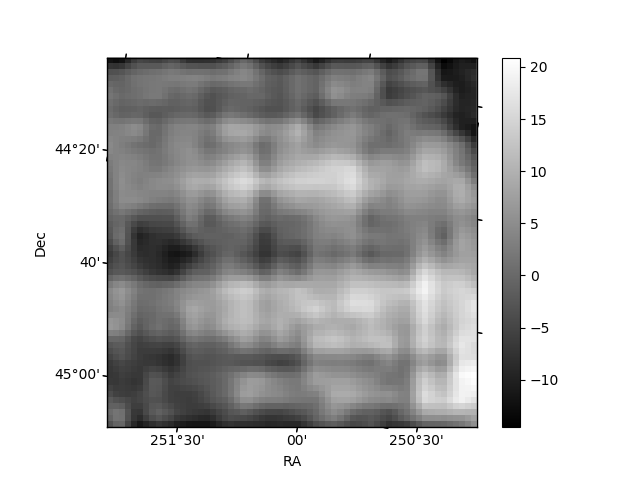
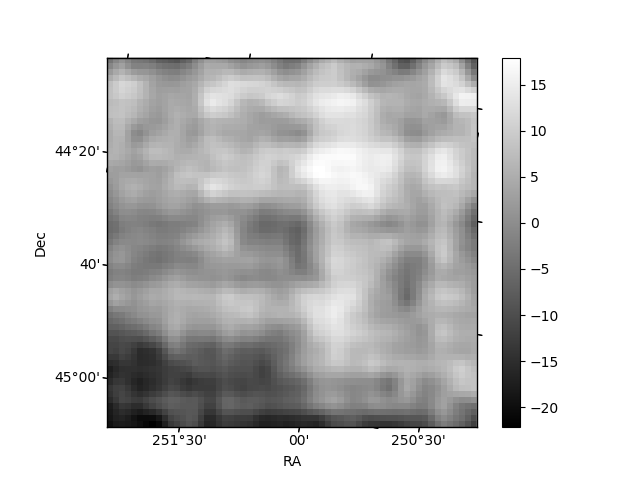
Histogram calculated using DETX and DETY for each event in the final _common_clean file
| Quadrant A | 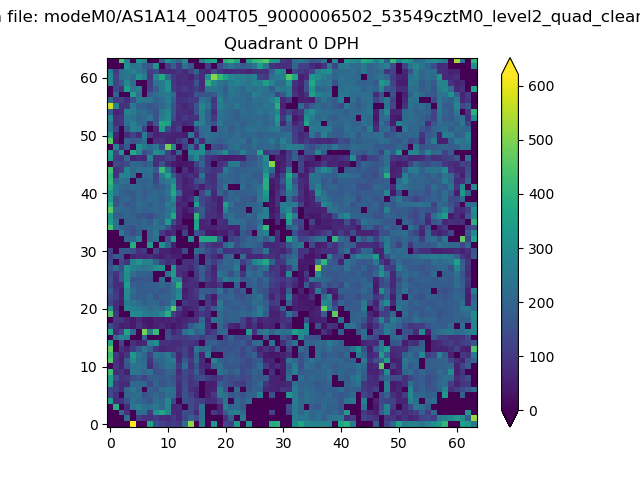 |
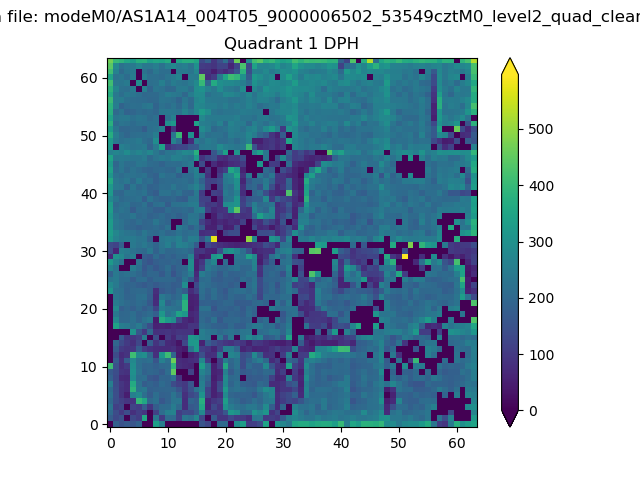 |
Quadrant B |
|---|---|---|---|
| Quadrant D | 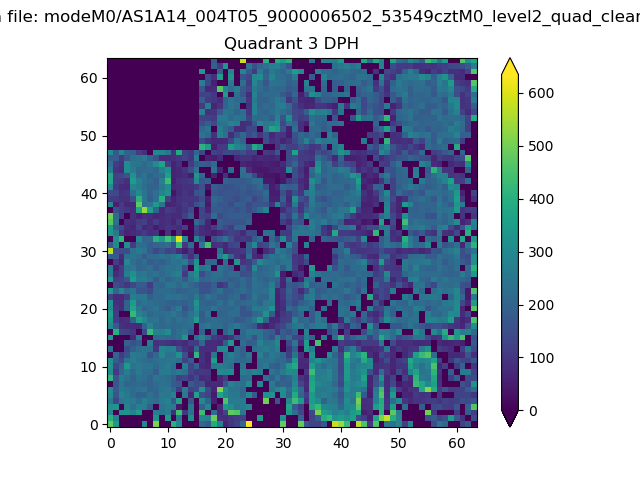 |
 |
Quadrant C |
| Plot type | Count rate plots | Images |
|---|---|---|
| Comparison with Poisson distribution Blue bars denote a histogram of data divided into 1 sec bins. Red curve is a Poisson curve with rate = median count rate of data. |
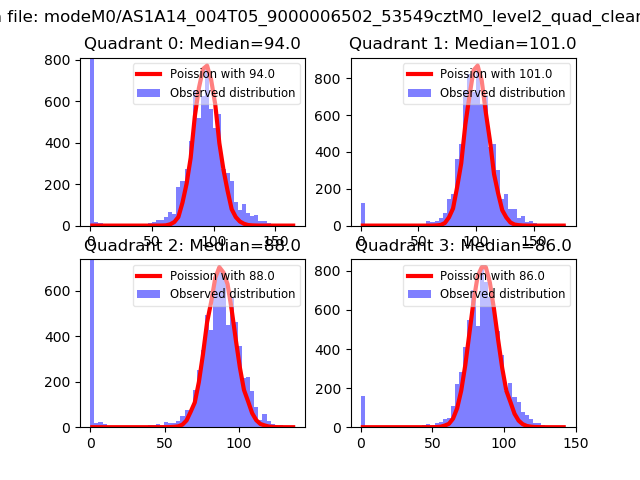 |
 |
| Quadrant-wise count rates Data is divided into 100 sec bins |
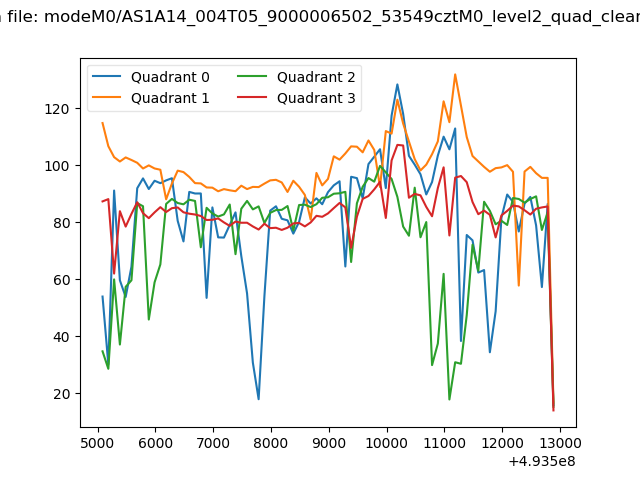 |
|
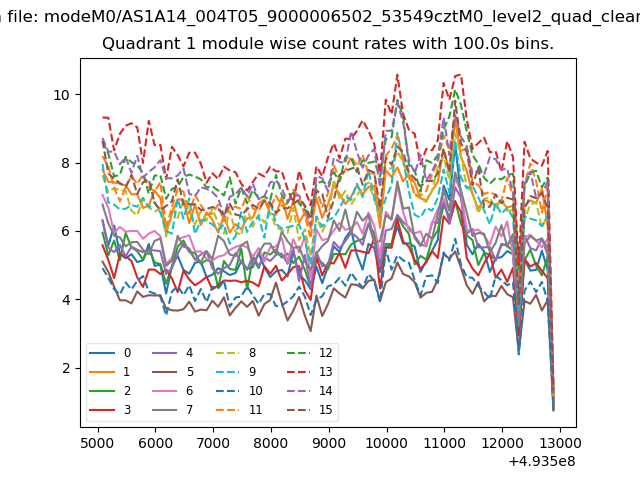
| Module-wise count rates for Quadrant A Data is divided into 100 sec bins |
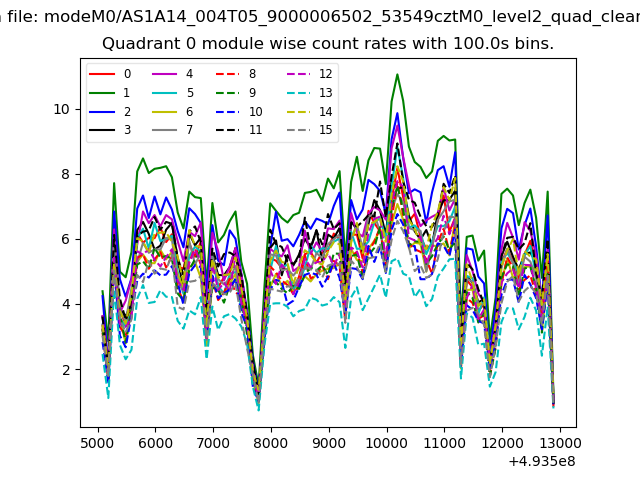 |
 |
| Module-wise count rates for Quadrant B Data is divided into 100 sec bins |
 |
 |
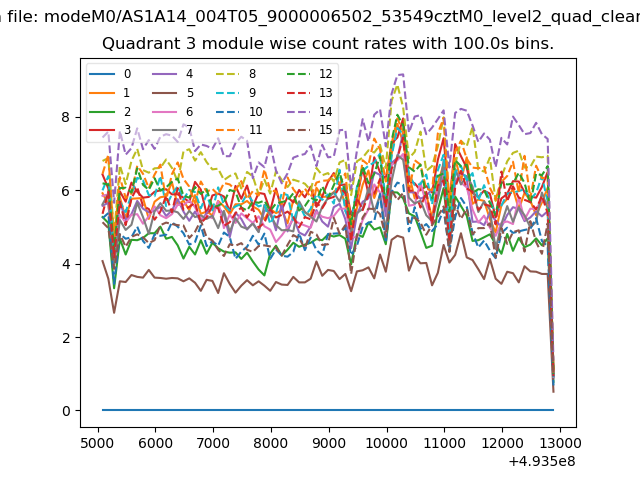
| Module-wise count rates for Quadrant C Data is divided into 100 sec bins |
 |
 |
| Module-wise count rates for Quadrant D Data is divided into 100 sec bins |
 |
 |
| Parameter | Plot |
|---|---|
| CZT HV Monitor | 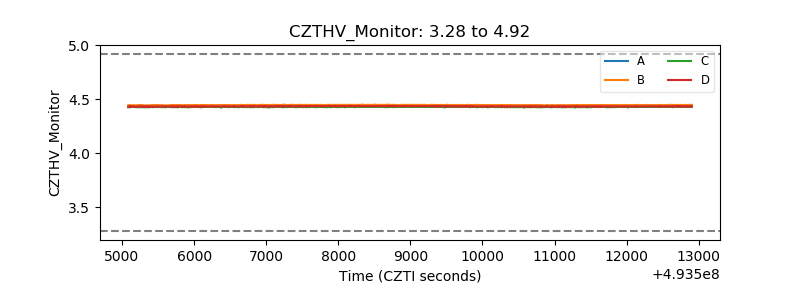 |
| D_VDD | 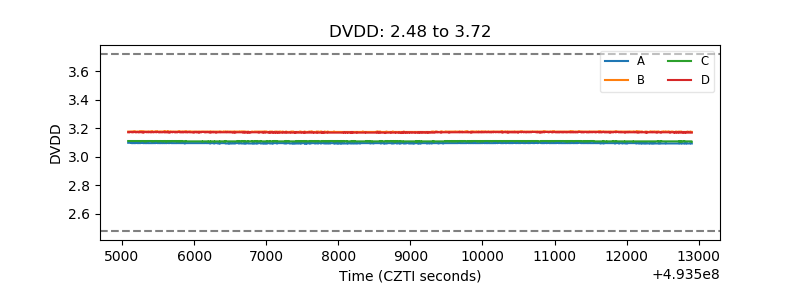 |
| Temperature 1 | 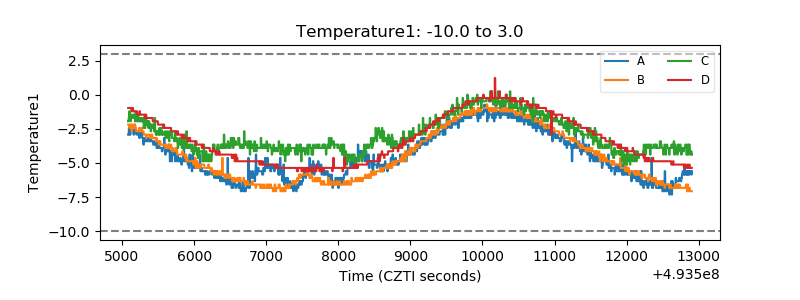 |
| Veto HV Monitor | 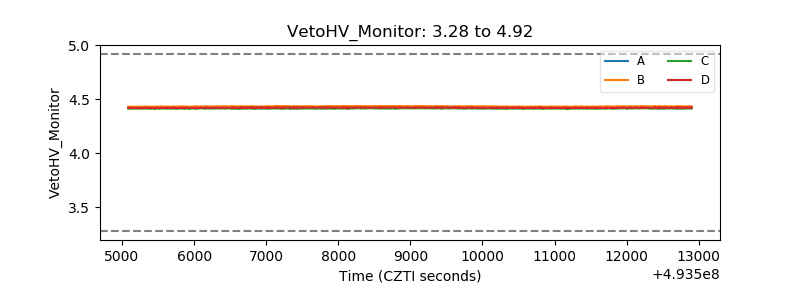 |
| Veto LLD | 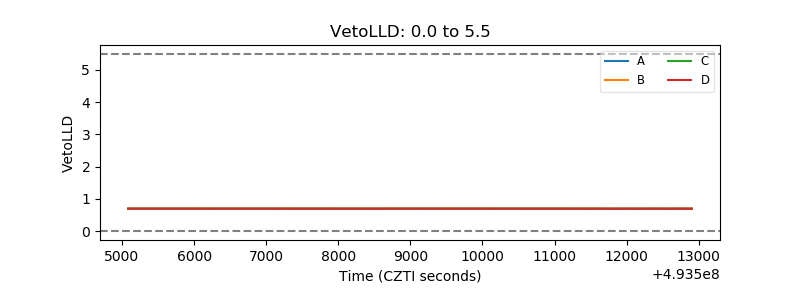 |
| Alpha Counter | 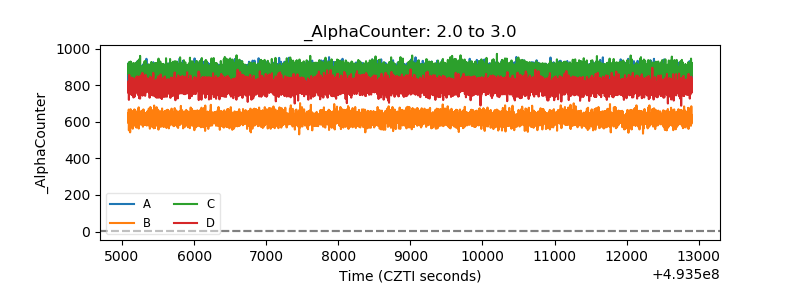 |
| _CPM_Rate | 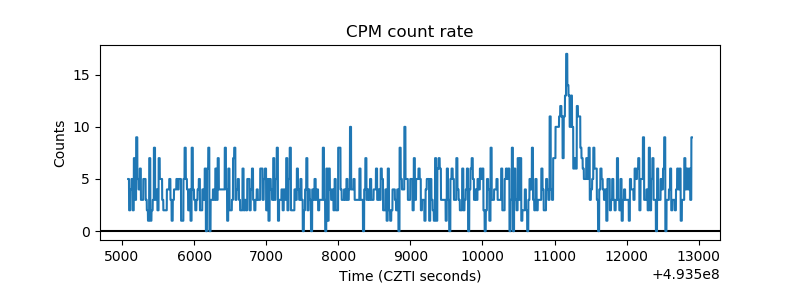 |
| CZT Counter | 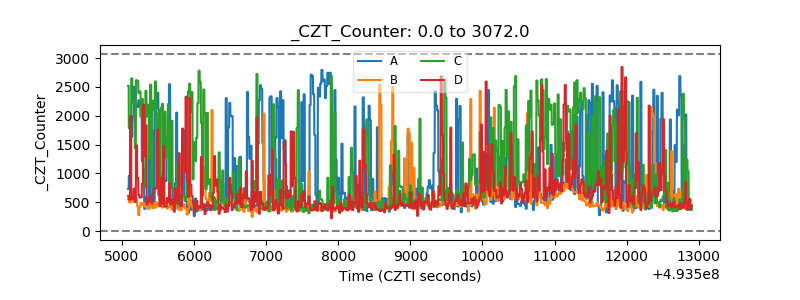 |
| +2.5 Volts monitor |  |
| +5 Volts monitor |  |
| _ROLL_ROT | 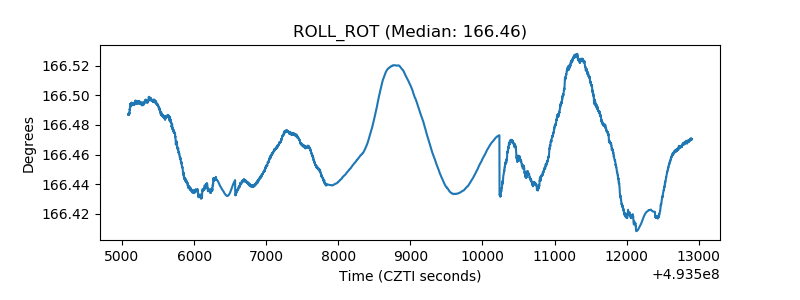 |
| _Roll_DEC | 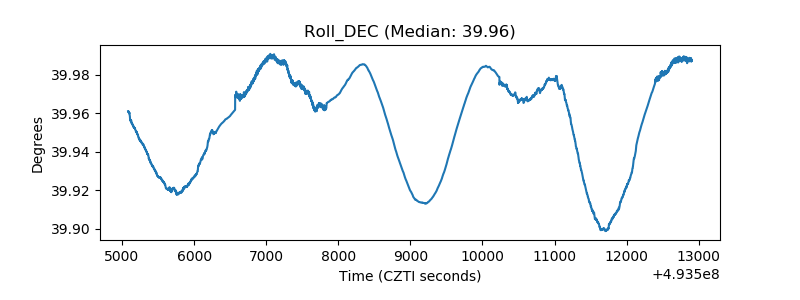 |
| _Roll_RA | 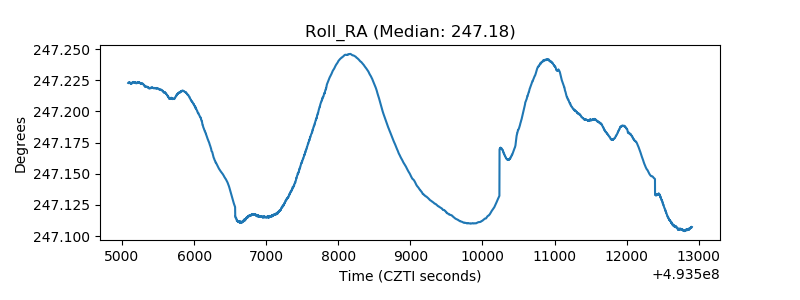 |
| Veto Counter | 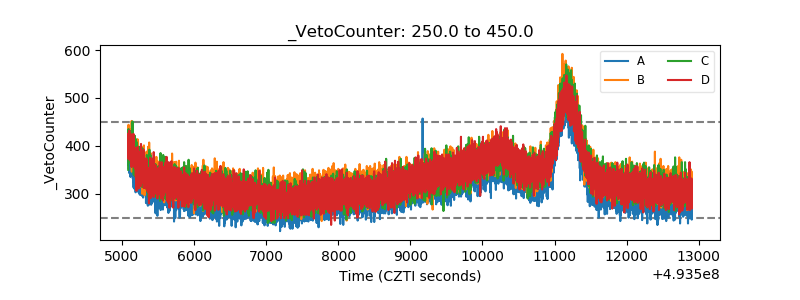 |